HO model - 2x2x2
1/23
There's no tags or description
Looks like no tags are added yet.
Name | Mastery | Learn | Test | Matching | Spaced | Call with Kai |
|---|
No analytics yet
Send a link to your students to track their progress
24 Terms
Assumptions
2 countries + 2 sectors + 2 Factors
H & F
H: L-abundant L=L*, K* > K → L / K > L* / K*
Identical tech across countries with CRS
All markets perfectly competitive
Preferences identical across countries + homothetic
No trade costs
Factors move freely across sectors but not across countries
no migration or capital flows
Not a small open economy - relative price endogenous
How to solve firm problem without factor prices
Using PPF
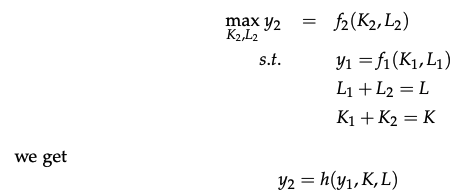
max y2 for a given y1 & resource constraints
How much you can produce of good 2 depends on how much you produce of 1
Any point on the PPF is efficient
PPF max equation
Solving the firm problem using PPF
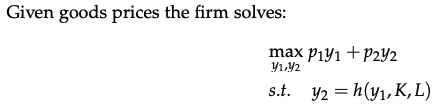
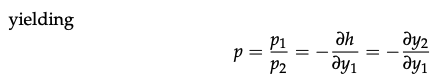
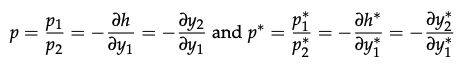
Slope of PPF = MRT (Marginal rate of transformation)
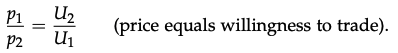
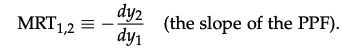
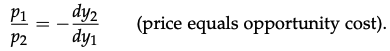
Relative p = MRT → tangency is optimal production mix
Solving the consumer problem using PPF
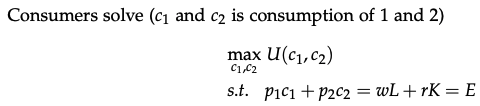
Relative p = MRS (marginal rate of substitution)
Autarky equilibrium with PPF
Markets clear when c1 = y1 & c2 = y2
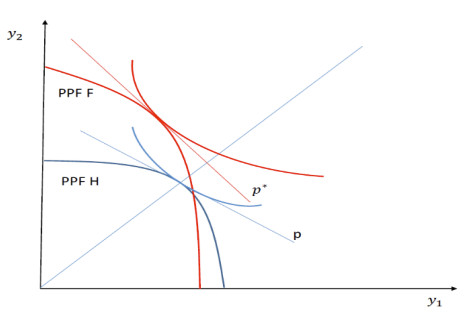
H is L-abundant & good 1 is L-intensive
1 cheaper in H than F
Equilibrium
Quantities: y1 / y2 > y*1 / y*2
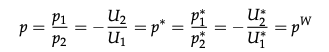
Price: p = p1 / p2 < p* = P*1 / p*2
p < p*
Efficient point: MRS = MRT
Opening to trade effects on p
Since 1 is L-intensive p* > p
if world price is p then there will be excess D for 1 in F
opening up to trade leads to equilibrium world price: p < pw < p*
Relative world demand
same preferences implies same relative demand in World as in H and F
Relative world Supply
Marginal rate of Substitution (MRS)
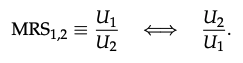
Optimal consumer choice / equilibrium condition in trade
Same preferences in Home and Foreign ⇒ same relative-demand relationship
marginal rate of transformation (MRT)
Equilibrium in production / (profit maximisation) with trade:

MRS = MRT in equilibrium

Preferences identical - common world relative-D curve
Tech / Endowments may differ - World relative-S curve reflects global production possibilities
World relative price (pw) equates Dw = DS
Trade equilibrium (p & y graph)
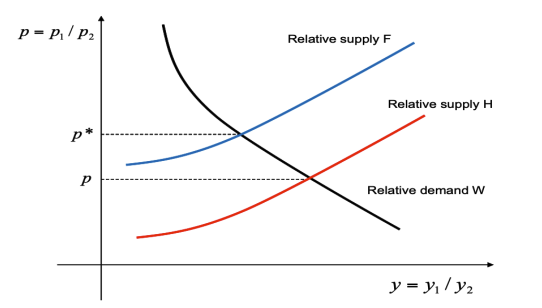
Intuition: if H is abundant in L, when we open up to trade, the price of the L-intensive good goes up compared to its autarky level, opposite happens to the price of the other good
Gains from trade - H
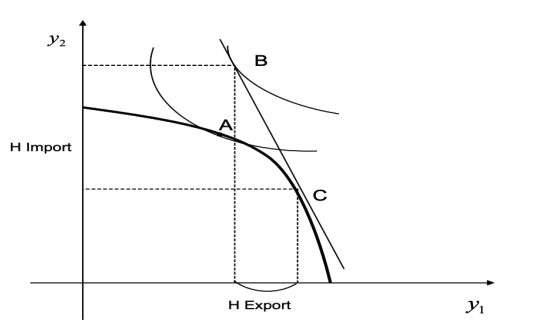
A - autarky equilibrium
B - trade equilibrium for consumption
C - trade equilibrium for production
under trade H consumes more of both 1&2 → better off
Same for F
Increased p allows for greater consumption possibilities
Specialisation in trade equilibrium
no full specialisation in production (each nation produces some of 1 & 2)
Different to Ricardian model
BUT there is full specialisation in trade
Only 1 nation exports each good
HO theorem & collaries
Theorem
In a 2x2x2 economy, with same technologies, same homothetic preferences across countries, but different factor endowments, no FIR and both goods produced, the country relative abundant of labor exports the L-intensive good and the country relative rich of capital exports K-intensive goods.
Only difference between 2 nations is endowments
Corollaries
Trade increases welfare in both countries. Consumers reach a higher level of utility
Stolper-Samuelson: trade raises real reward of a country’s abundant factor and reduces that of the scarce factor
leads to a conflict of interest between the scarce and abundant inputs.
Trade leads to factor price equalization
HO predictions - trade & inequality
Trade increase relative price of skilled good in skill-intensive country
Trade increases inequality in skill-intensive country (developed) and decreases it in the unskilled-intensive country (developing)
Trade increases inequality via across-sector reallocations of labor/production: from the scarce to the abundant sectors
HO predictions & real world data - inequality in developed nations
US skill premium has increased when nations more open to trade (globalisation increasing)
increase in skill premium for production workers
Lawrence & Slaughter (1993) & Acemoglu & Autor (2011)
BUT relative prices dont increase
Negative relationship between skill intensity & Export price
HO predicts opposite
HO model distributional effects assumptions
Assume goods produced with skilled & unskilled L
Assume trade between developed & developing nations
North-South trade
HO predictions & real world data - inequality in developing nations
Inequality increases also in many developing countries
Goldberg & Pavcnik (2007)
Evidence of a skill premium in South– skilled workers wages still rising
HO predictions & real world data - trade and inequality across sectors
High shares of within-industry contribution to skill premium / benefits to skilled workers
Berman et al. (1998)
Why does HO model fail
No technology included in model
Innovation / tech progress → Productivity gain → prices fall
K cheaper or more complementary to skilled L → Productivity gain → prices fall
Increased D for skilled-L in developing → skill premium / inequality rise