4.1.6 - The labour market
1/60
There's no tags or description
Looks like no tags are added yet.
Name | Mastery | Learn | Test | Matching | Spaced | Call with Kai |
|---|
No analytics yet
Send a link to your students to track their progress
61 Terms
Labour Market =
Consists of the demand for labour coming from employers (firms) combined with the supply of labour coming from individuals seeking work.
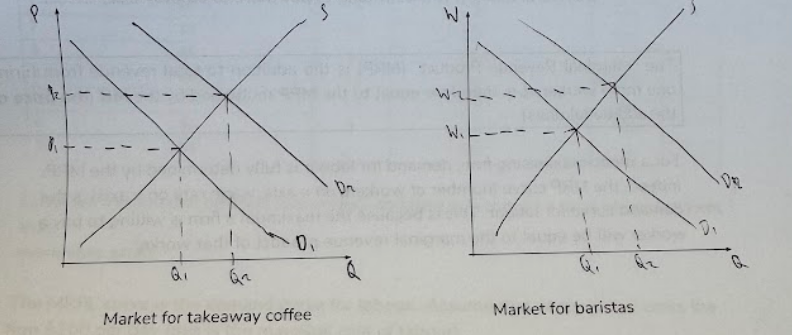
How does demand for product determine the demand for labour?
The demand for labour is derived from the demand for the product/service they are used to produce. (Derived demand for labour)
Therefore, increase in demand for takeway coffees → increase demand for baristas
Show on Diagrams the result of an increase in demand for takeway coffees on baristas
Marginal Revenue Product (MRP) =
The addition to total revenue generated by the firm by employing one extra worker
= MPP x MR
Marginal Physical Product (MPP)
The additional output that an extra worker produces
Demand for Labour =
The quantity of workers an employer is willing and able to hire at a given wage rate in a given time period.
What does the MRP curve represent?
MRP = D.
MRP is the demand curve for labour for an individual firm.
MRP used for diagram for firm, not for industry diagram (which uses D)
Why is the Demand curve for Labour Downwards Sloping?
Law of diminishing marginal productivity - As more workers are hired, the additional output produced by each new worker decreases → MRP decreases → firms willing to hire more only at lower wages
Where is the Profit-Maximising point for a firm on labour market
MRP = MC
Diagram for Competitive Labour Market (Firm & Industry)
In competitive labour market, each firm can only hire workers if they offer the market-clearing wage rate, because if they offered less, they would work at other rival firms instead. → Supply curve is horizontal

Factors causing a MOVEMENT along a firm’s Demand for Labour
Price of Labour (wage rate)
e.g. change in min wage
Causes MRP to extend/contract
Factors causing a SHIFT in a firm’s Demand for Labour
Consumer demand for product - DD4L
Productivity of labour (e.g. from training/education) → ↑MPP → ↑MRP
Price/productivity of other FoP - e.g. capital more expensive → swap labour in
Market price of final product → change in MR → change in MRP
Government employment subsidy → allows firm to employ more workers
Elasticity of Demand for Labour (definition + formula)
= Responsiveness of quantity demanded for labour to a change in the wage rate
= % Change in Quantity Demanded of Labour / % Change in Wage Rate
Determinants of Elasticity of Demand for Labour
Time period - In LR, easier to substitute in capital so more elastic
Ease of capital subtitutiton - More elastic if labour can easily be substituted by capital
Elasticity of Demand for Product - If product is elastic, firm cannot pass on higher wage costs to consumers without losing sales, so labour is elastic.
Proportion of Total Costs - If labour is a large % of total costs, rise in wages have a larger impact on costs → more elastic
Supply of Labour =
The quantity of labour that a worker is willing and able to supply at different hourly wage rates
Why is the Supply curve of Labour Upwards Sloping?
Substitution effect - ↑Wages → reward for working increases → Workers substitute leisure for labour by working more hours → Supply increases (extension)
Factors causing a MOVEMENT along a firm’s Supply of Labour
Monetary Factors
Wage Rate
Bonuses
Factors causing a SHIFT in a firm’s Supply of Labour
Non-Monetary Factors
Holidays - more holidays → ↑satisfaction → supply shifts right
Occupational Mobility - increase in training/educaiton
Geographical Mobility
Wages in other jobs
Changes in Population - rise in immigration → supply increases
Elasticity of Supply of Labour (definition + formula)
Responsiveness of quantity supplied of labour to a change in the wage rate.
= % Change in Quantity Supplied / % Change in Wage Rate
Determinants of Elasticity of Supply of Labour
Barriers to Entry:
Occupational Mobility - More skills & qualifications required, longer training period → more inelastic
Geographical Mobility - Higher house prices → more inelastic
Time Period - In LR, more elastic
Unemployment - When high u/e, more workers competing for same jobs → more elastic
Characteristics/Assumptions of Perfectly Competitive Labour Market
Very large number of workers
Workers are homogeneous
Firms maximise profits, hiring workers up to MRP=MC
No barriers to entry for workers
Price-taking - no firm or worker can influence ruling wage rate
Perfect information about workers’ skills; working conditions, outside wages
Large number of firms/employers
Diagram for Perfectly Competitive Labour Market (Firm & Industry)
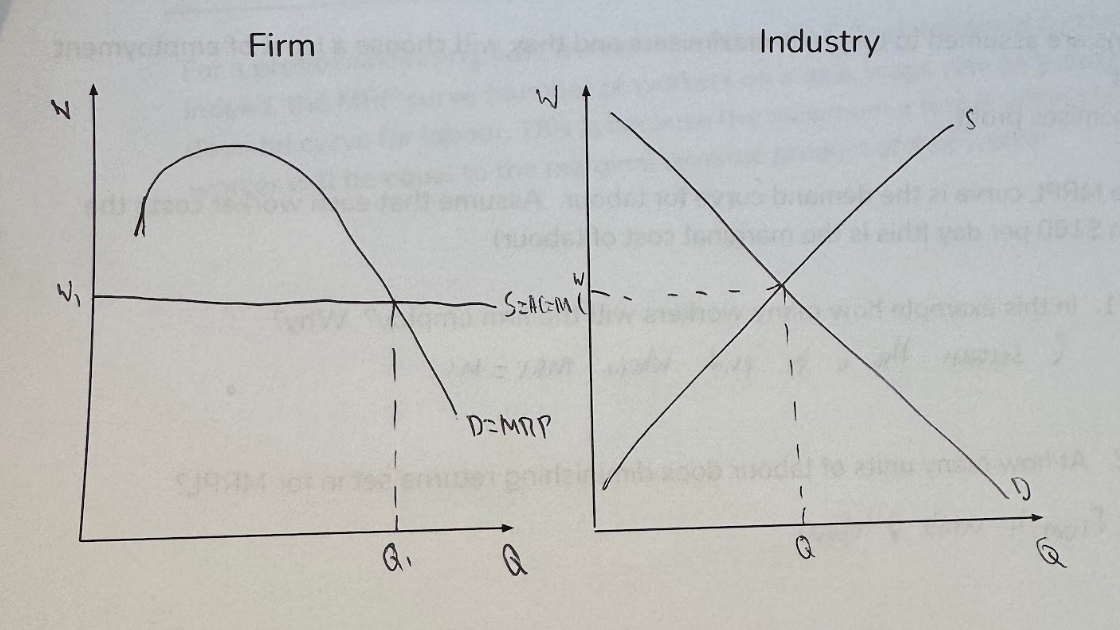
Why is Supply Horizontal for Firms in Perfectly Competitive Labour Markets?
In competitive labour market, each firm can only hire workers if they offer the market-clearing wage rate, because if they offered less, they would work at other rival firms instead. → Supply curve is horizontal
(firms are wage-takers)
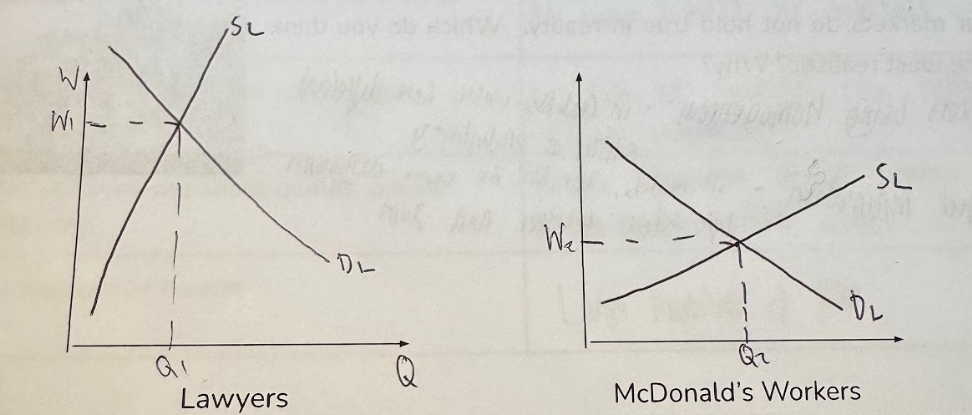
Labour Market for High-Skilled Job vs Market for Low Skilled-Job (Diagrams + Chain of Analysis)
For this example, High-Skilled = Lawyer, Low-Skilled = McDonald’s Worker
Elasticity of Supply:
Supply of Lawyers is more inelastic - More barriers to entry, like rigorous qualification exams, education - need degree, training.
Whereas, supply of McDonald’s workers is elastic - low entry requirements - no education needed, little training
Labour Demand:
Demand for Lawyers exists at much higher wages - Lawyers produce higher MR → higher MRP → firms more willing and able to hire lawyers
→ Equilibrium Wage for Lawyers is higher at W1 compared to W2 for McDonald’s workers
Reasons why Labour Markets may be Imperfectly Competitive:
Monopsony
Trade Union
Imperfect Information
Monopsony =
A market with a single buyer
Monopsony Power =
Ability to influence wages, so they pay lower wages than would prevail in a competitive market.
Real World Examples of Monopsonies
Sweatshops - workers have nowhere else to work
NHS
Space Agencies
Mining company in a remote town
Cafe in a remote town
Diagram of Monopsony (vs competitive)
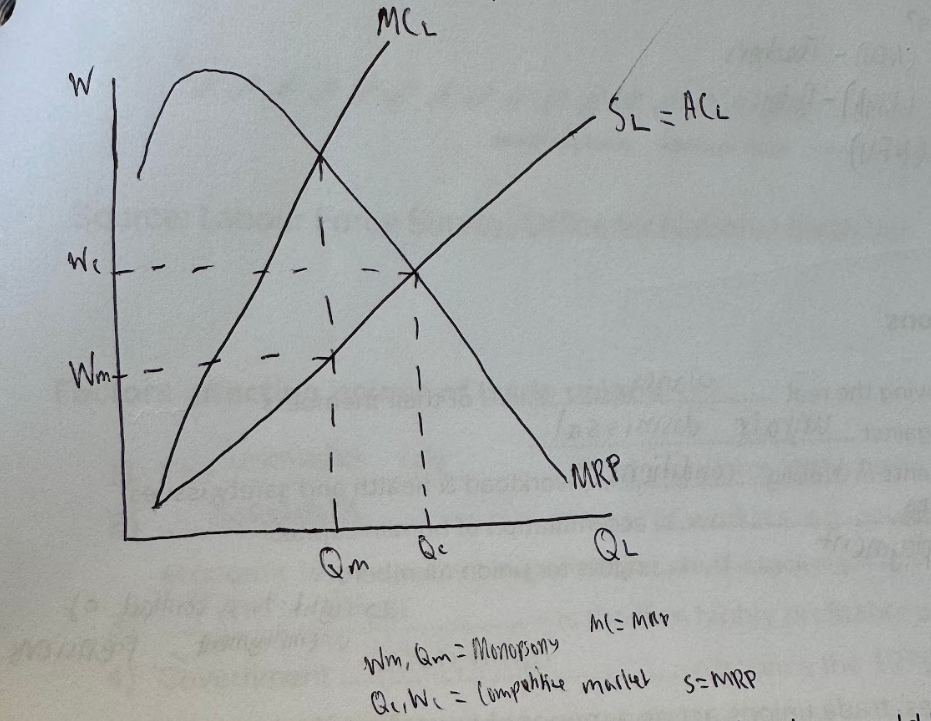
Monopsony Chain of Analysis
Monopsonist is the only employer in the industry
So it must raise the wage offered to attract new workers if it wishes to employ more labour → supply is upwards sloping
MC is not same as supply curve because when raising wage to hire new worker, the monopsonist has to raise the wage of all existing workers too (to the same rate as new workers) → MC is greater than AC (S)
Assuming monopsonist aims to maximise profits, it will demand labour up to the point where MC = MRP
At this point, wage paid to workers is lower at Wm compared to what would be prevail in a competitive market at Wc
Quantity of labour is also lower at Qm compared to Qc

Trade Union =
A group of workers who join together to maintain and improve their conditions of employment, including their pay.
have ‘collective bargaining’ power
Real World Examples of Trade Unions
Nation Education Union (NEU) - Teachers
British Medical Association (BMA) - Doctors
National Farmer’s Union (NFU)
Roles of Trade Unions
Protecting & improving real wages
Protecting workers against unfair dismissal
Promoting improvements in working conditions
Workplace training
Protection of employment rights → right to a contract of unemployment, pensions
Factors affecting the Power of Trade Unions
Unionisation Rate - % of workforce in the trade union
Bargaining Power of workers - whether their jobs are a necessity to society
Firm’s power - is firm profitable or struggling to survive?
Government intervention
Diagram of Trade Union in Perfectly Competitive Labour Market
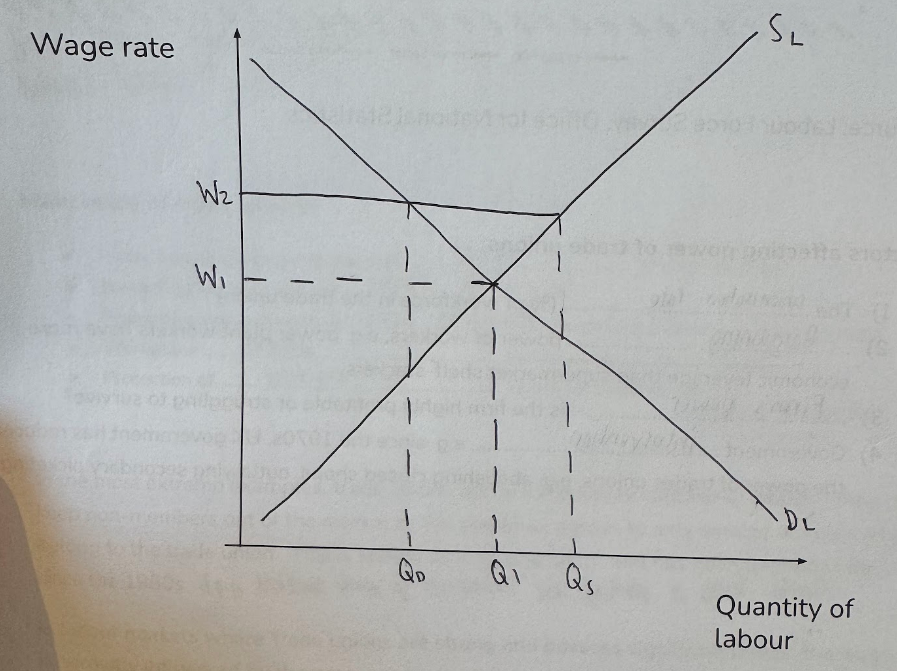
Impact of Trade Union in Perfectly Competitive Labour Market Chain of Analysis
In a competitive labour market, wages were W1.
Trade union acts as a monopoly supplier of labour → collectively bargains for a higher wage of W2 above the equilibrium wage rate
Wages increase from W1 to W2 (trade union markup)
But employment falls from Q1 to Qd
As supply extends to Qs and demand contracts to Qd, there is real wage unemployment of Qs-Qd
The labour supply curve is kinked - perfectly elastic up to Qs, but to raise labour supply beyond this, firms must offer higher wages.

Evaluations of Trade Union Impact on Wages & Unemployment
Counter:
Unions may instead lobby for more workplace training → higher MRP → demand for labour shifts right → employment & wages increase
Higher wages may induce higher demand for the products → Higher wages → more disposable income → Increase in spending → demand for product shifts right → demand for labour shifts right → employment and wage increase
IDO:
Level of wage rate imposed - the greater it is above equilibrium, the lower the level of employment
Elasticity of Supply & Demand for labour - if inelastic, effect on u/e is smaller
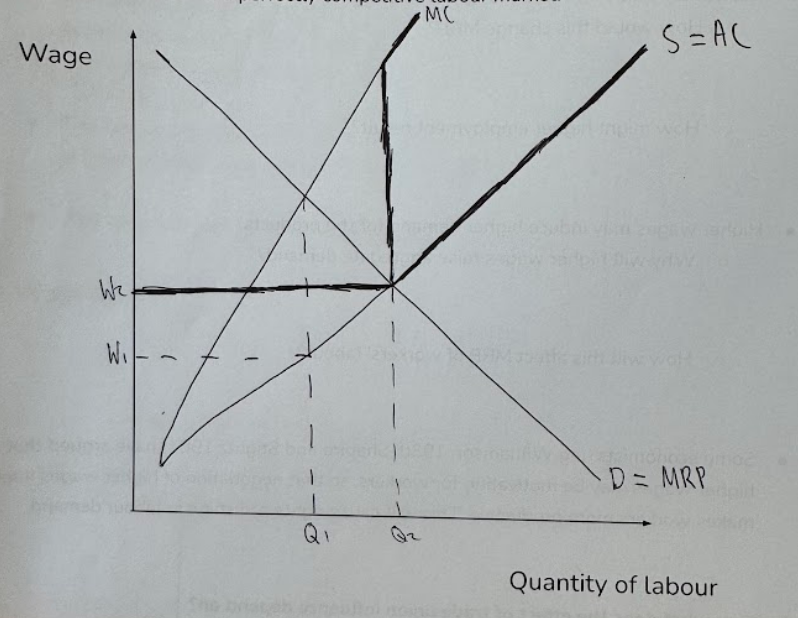
Diagram of Trade Union in Monopsony Labour Market

Impact of Trade Union in Monopsony Labour Market Chain of Analysis
In a monopsony, profit-maxing point where wages are at W1 and employment is Q1
Trade union acts as a monopoly supplier of labour → collectively bargains for a higher wage of W2
MC and AC is now perfectly elastic up to Q2 as hiring one extra worker up to this point costs the same wage rate.
The profit-maximising point where MC=MRP is now at W2, Q2
Wage has increased from W1 to W2 and employment has increased from Q1 to Q2
Imperfect Information
National Minimum Wage =
The lowest wage which a worker can be employed, set by the government.
aka National Living Wage
Trade Union and National Minimum Wage
They have the same diagrams & same chain of analysis on competitive and monopsony labour markets
Impact of NMW on Perfectly Competitive Labour Market Chain of Analysis
In a competitive labour market, wages were W1.
Government sets NMW of W2 above the equilibrium wage rate
Wages increase from W1 to W2
But employment falls from Q1 to Qd
As supply extends to Qs and demand contracts to Qd, there is real wage unemployment of Qs-Qd
The labour supply curve is kinked - perfectly elastic up to Qs, but to raise labour supply beyond this, firms must offer higher wages.

Impact of NMW on Monopsony Labour Market Chain of Analysis
In a monopsony, profit-maxing point where wages are at W1 and employment is Q1
Government sets NMW of W2
MC and AC is now perfectly elastic up to Q2 as hiring one extra worker up to this point costs the same wage rate.
The profit-maximising point where MC=MRP is now at W2, Q2
Wage has increased from W1 to W2 and employment has increased from Q1 to Q2

Evaluations of NMW Impact on Wages & Unemployment
IDO:
Level of wage rate imposed - the greater it is above equilibrium, the lower the level of employment
Elasticity of Supply & Demand for labour - if inelastic, effect on u/e is smaller
Counter:
‘Corporate Flight’ - if NMW set too high, firms may just leave and move to other locations with lower NMW
Combination of Policies required to reduce poverty - need to also do investment in training, reforms to welfare system
Advantages of a National Minimum Wage
Poverty alleviation:
Ensures a fair wage, reduces wage inequality, reduces social deprivation & crime
UK NLW = At least 67% of median hourly wages
‘Relative Poverty’ defined as 60% of median income
Therefore, NLW prevents relative poverty
Greater incentives to work:
Earnings/poverty trap reduced as it makes taking a job more beneficial/worthwhile
Increases productivity:
Workers on higher wages tend to work harder
Reduced government spending:
on in-work benefits (universal credit)
& on out-of-work benefits via lower earnings trap effect
Prevents monopsonist exploitation:
Higher wages & higher employment in monopsonist markets
Disadvantages of a National Minimum Wage
Increases unemployment in competitive labour markets:
Employment falls from Q1 to Qd
Real wage unemployment of Qs-Qd (from contraction along D and extension along S)
Increases firms costs & raises prices:
SRAS left → increase prices → less internationally competitive + products more expensive for consumers
Increases inequality further:
Reduces income of the workers who lose their jobs in competitive labour markets (Q1-Qd)
Difficulty in targeting & setting the correct wage:
Different wages in every industry
Inflexibility:
Firms cannot reduce wages in a recession, so have to lay off workers instead
Types of Discrimination in Labour Market
Perfect Wage Discrimination
Labour Market Discrimination
Perfect Wage Discrimination =
The firm pays each worker the minimum wage that worker is willing and able to supply labour at.
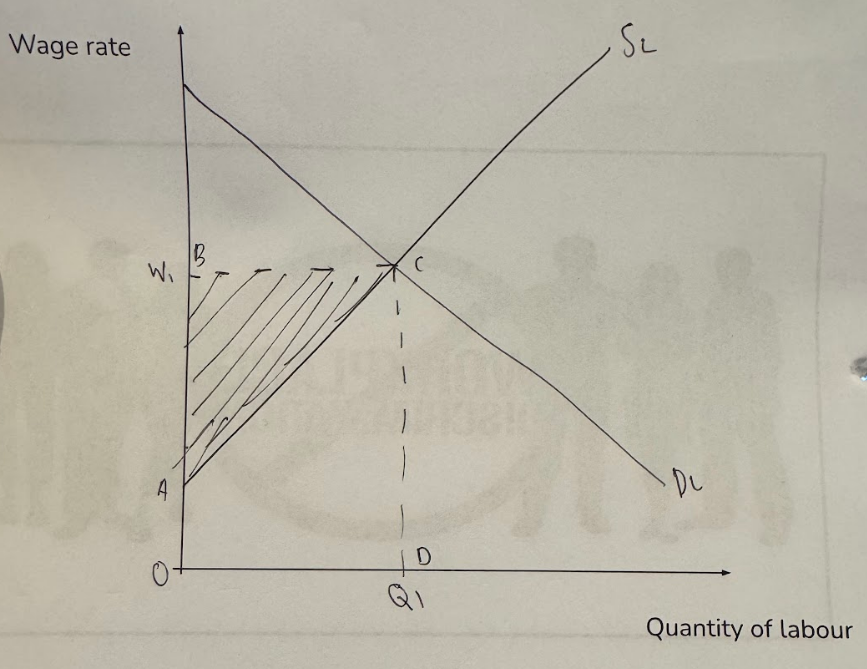
Perfect Wage Discrimination Diagram
Original Wage Bill without Discrimination = Area OBCD
New Wage Bill = OACD
Area that monopsony gains = ABC
Advantages of Perfect Wage Discrimination (for Workers, Employers, Economy)
Workers:
Lower wage bill may lead to higher employment
Employers:
Lower wage bill → lower costs → higher profits
Economy:
Lower costs → lower prices → more internationally price competitive
Disadvantages of Perfect Wage Discrimination (for Workers, Employers, Economy)
Workers:
Vulnerable workers exploited by being paid lower wages → lower living standards
Employers:
Admin cost - must estimate optimal wage for each worker
Risk of industrial unrest (e.g. strikes)
Economy:
Inequality - lower income workers have higher MPC
Labour Market Discrimination =
Firms pay different wages to different groups of workers for reasons unrelated to their willingness & ability to supply labour.
e.g. due to prejudice
Positive Discrimination =
Firms pay workers more than their true MRP
Negative Discrimination =
Firms pay workers less than their true MRP
Examples of Labour Market Discrimination
Think demographics:
Gender
Ethnicity
Age
Appearance
Class
Conditions necessary for Labour market Discrimination
Firm has some wage-making power
No seepage - lower paid workers cannot access the higher paid jobs
Willingness & ability to supply labour is different for different workers
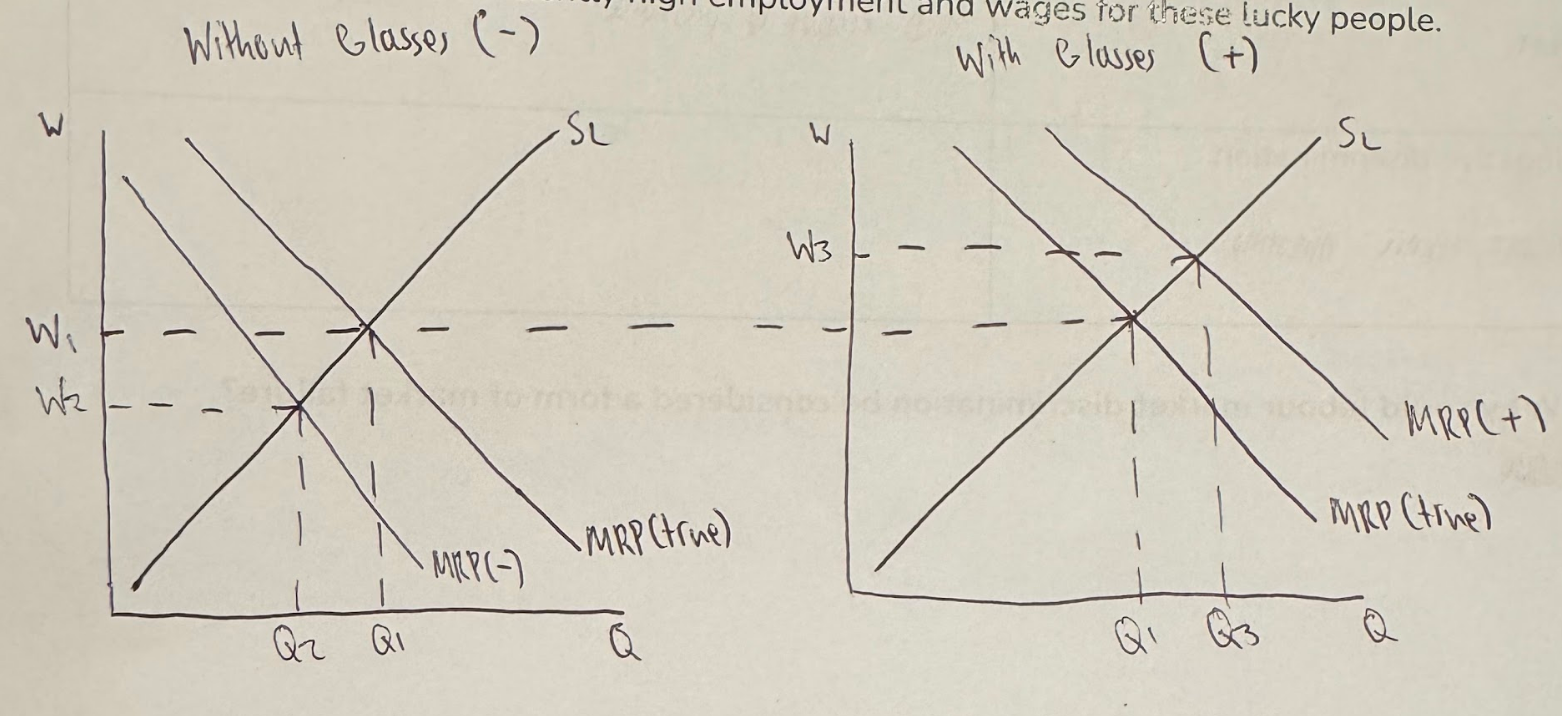
Positive vs Negative Discrimination Diagram & Chain of Analysis
Employers profile employees by their demographic factors, such as wearing glasses or not
Each demographic factor has its own market segment - employees wearing glasses have a separate segment to employees not wearing glasses
Firms mistakenly believe that workers who wear glasses are more productive than those who don’t
→ the perceived MRP of those wearing glasses is higher than their true MRP, shown by MRP (+) → their wage is W3 at Q3
The perceived MRP of those not wearing glasses is lower than thier true MRP, shown by MRP (-) → their wage is W2 at Q2
The result is that those with glasses are paid higher wage of W3
Disadvantages of Labour Market Discrimination (for Workers, Employers, Economy)
Workers:
Negatively discriminated workers get exploited by being underpaid and underemployed → lower living standards
Employers:
Overall firms have a higher wage bill:
Pay higher wages to a higher quantity of positively discriminated workers.
Increases average wage more than negative discrimination decreases average wage
→ higher wage than before discrimination
Economy:
Inequality within society
→ Poverty trap → no incentive for people to work
→ Low access to g&s
→ ↑Gov spending on welfare benefits
Advantages of Labour Market Discrimination (for Workers, Employers, Economy)
Workers:
Positively discriminated workers benefit from higher wages → higher welfare + living standards
Factors causing a Gender Pay Gap
Breaks from working:
Maternity leave → harder to achieve promotions when re-entering labour market
Access to education:
In many developing countries, opportunity for women to undertake education is limited
Employer discrimination:
Employers negatively discriminate against women