AP Stats Unit 1 DEAD Words
 Multiple Choice & FRQ
 Call Kai
1/21

Earn XP
Description and Tags
Name | Mastery | Learn | Test | Matching | Spaced | Call with Kai | Chat |
|---|
No analytics yet
Send a link to your students to track their progress
22 Terms
Investigative Question
A question that you answer by collecting and analyzing data, not be looking up a single fact or doing arithmetic calculation.
Prospective Study
Research is identified in a group of participants and is followed forward in time to record outcomes as they happen.
Retrospective Study
Research looks at outcomes that have already occurred and examine past records or data to work backwards and find prior exposures or behaviors.
Categorical vs. Quantitative Variables
Categorical- a variable that represents categories or groups, rather than numerical values.
Quantitative- a variable that takes a numerical value and represents an amount or measurement.
Relative Frequency
The proportion or percentage of times a specific value or category occurs in a data set.
Formula: (count in category) ÷ (total sample size)
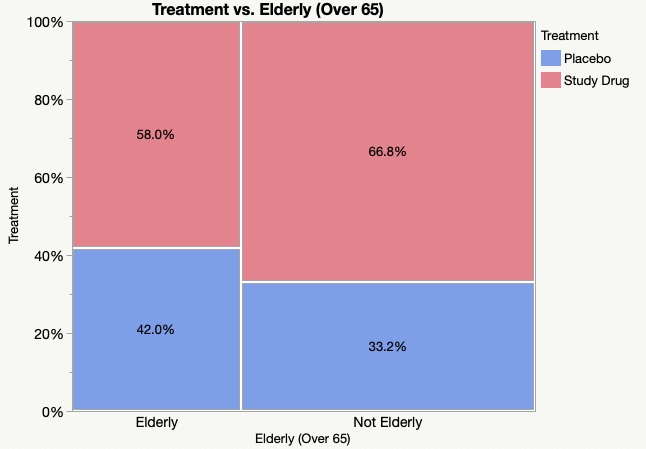
Mosaic Plot
Represents all three relative frequency types (joint, marginal, + conditional) as a rectangle divided into tiles where x-axis/width of bar is scaled proportionally to the group’s share of the data. Usually two categorical groups.
Discrete vs. Continuous Variables
Discrete- countable numerical values (usually whole numbers) like students in a classroom.
Continuous- value that is measured rather than counted, no gaps, infinitely many possible real values within a range like exact heights of students in inches.
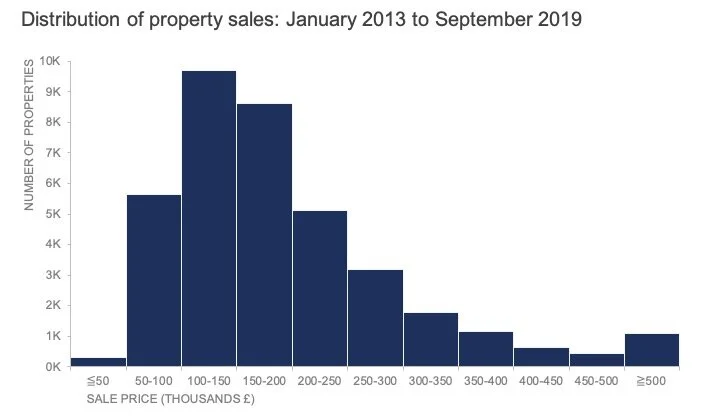
Histogram
A graphical display of a quantitative data where data is split into equal-width intervals (called bins) withheld adjacent bars with no spaces.
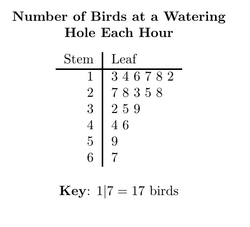
Stem (and Leaf) Plot
A data display that organizes quantitative data values by splitting each number into a leading stem and a trailing leaf.
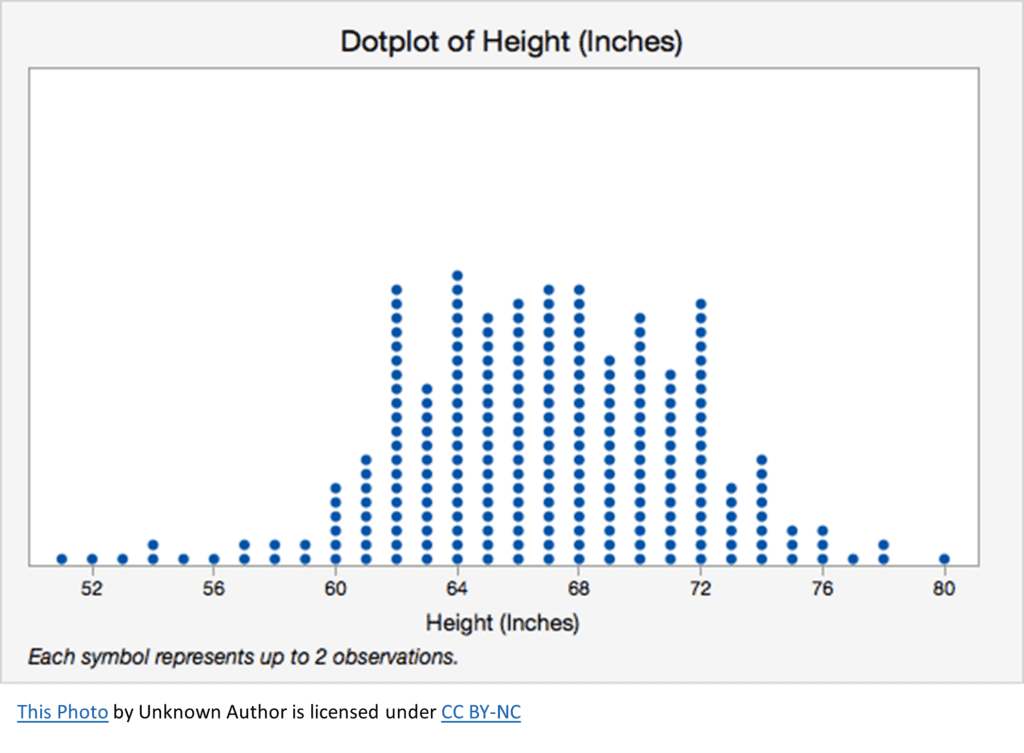
Dot Plot
A graphical display that shows distribution of quantitative data by plotting individual data points as dots along a labeled number line.
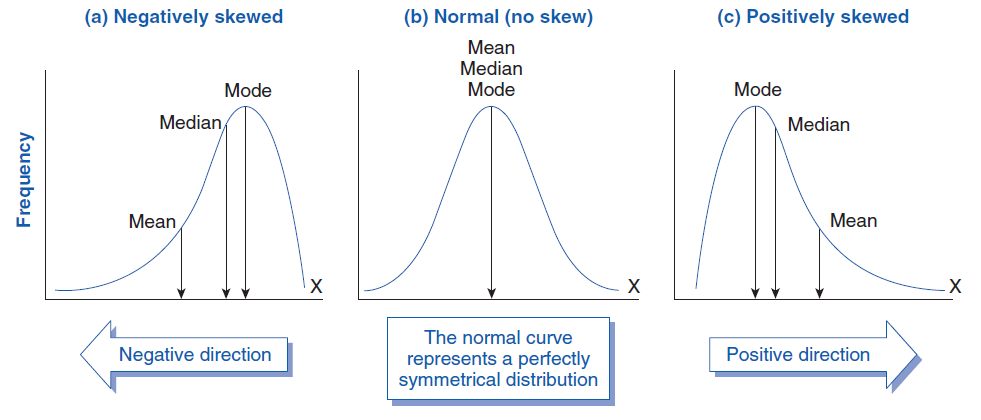
Skew
A non-symmetric distribution where one tail stretches longer than the other.
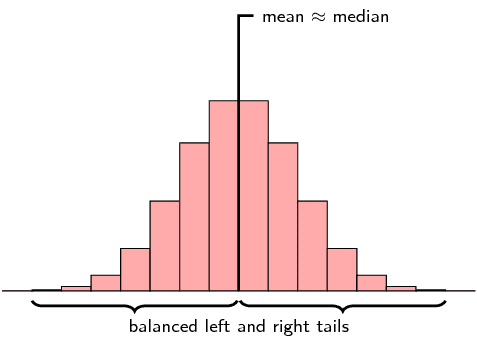
Symmetric
A data distribution where the left and right sides look like approximate mirror images of each other when divided in the middle.
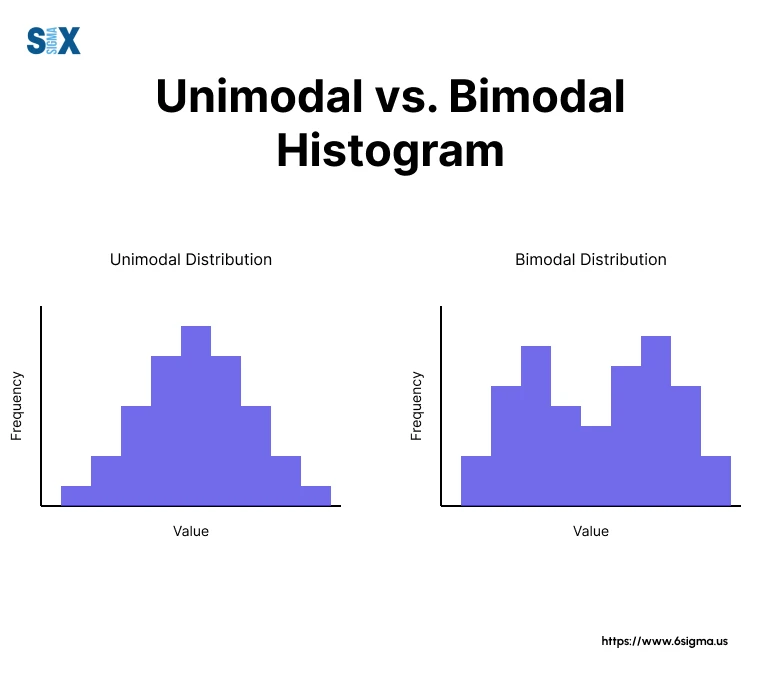
Bimodal
A data distribution with two clear, distinct peaks or humps where data values cluster most often.
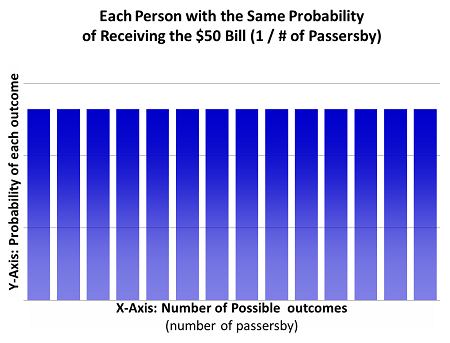
Uniform
A data distribution where every outcome or interval of equal length within a specified range has equal or similar likelihood of occurring.
Mean
Arithmetic average of data set.
Formula: (sum of all values) ÷ (total number of values)
Median
The exact middle value in an ordered data set that divides exactly in half.
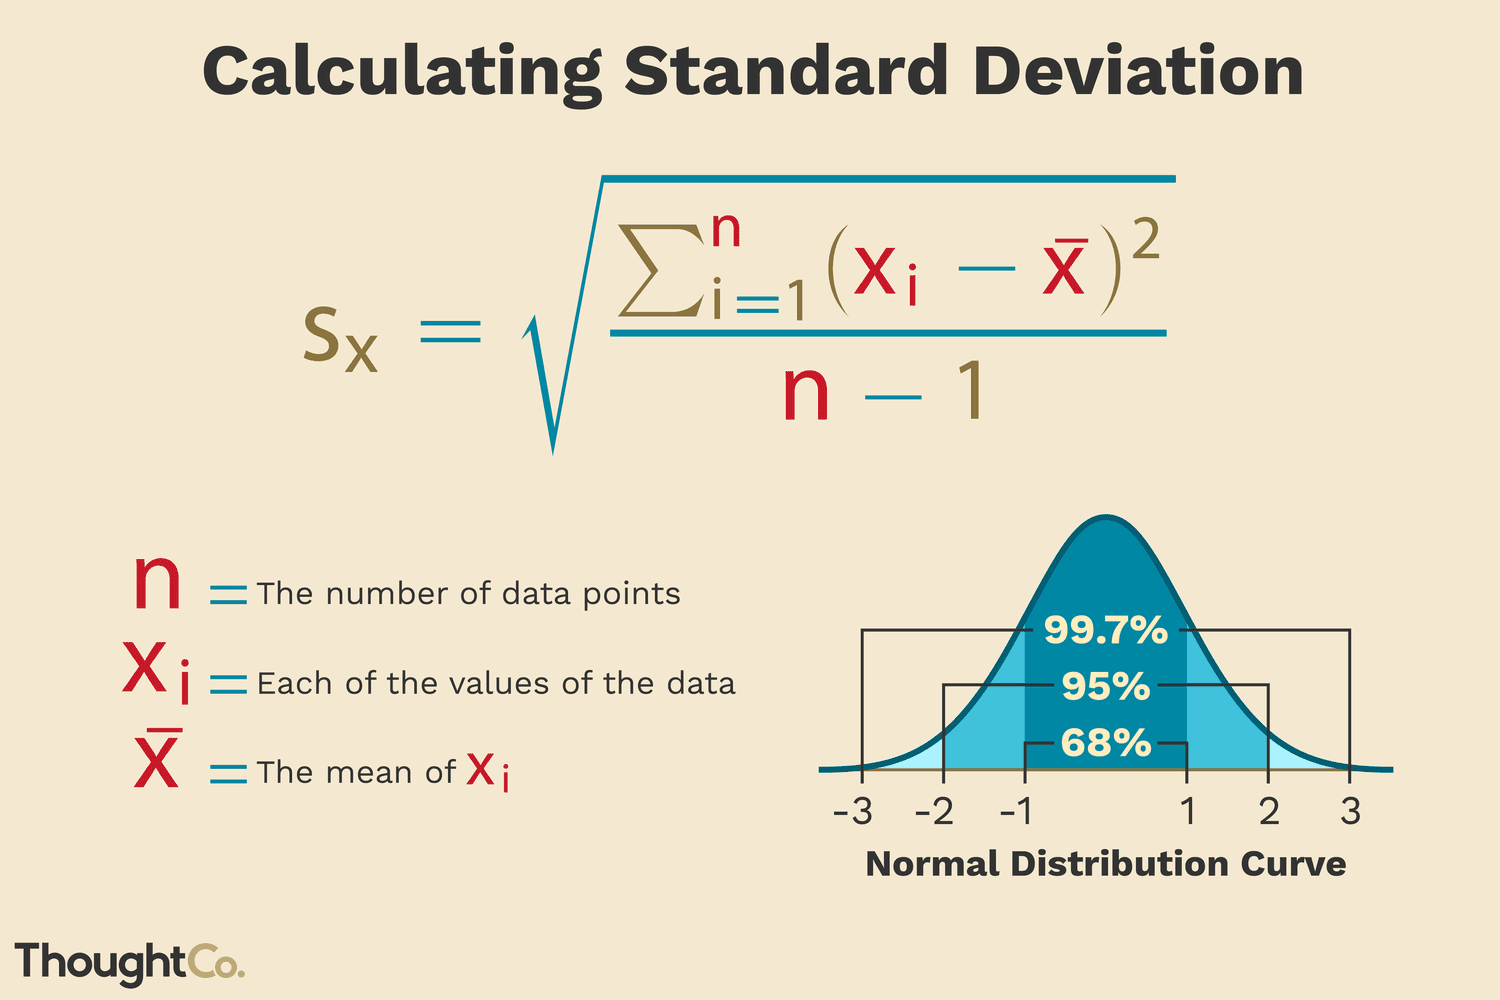
Standard Deviation
A measurement that tells the average distance of data values in a data set from their mean (average).
Outliers
A data point that lies far away from the overall pattern of the rest of the data set.
Inter-Quartile Range (IQR)
Range of the middle 50% of a data set.
Formula: Q3-Q1
Box Plot/5 Number Summary
Box Plot- displays 5 number summary, graphical representation of the key statistics of a data set
5 Number Summary- minimum, first quartile (Q1), median (Q2), third quartile (Q3), maximum
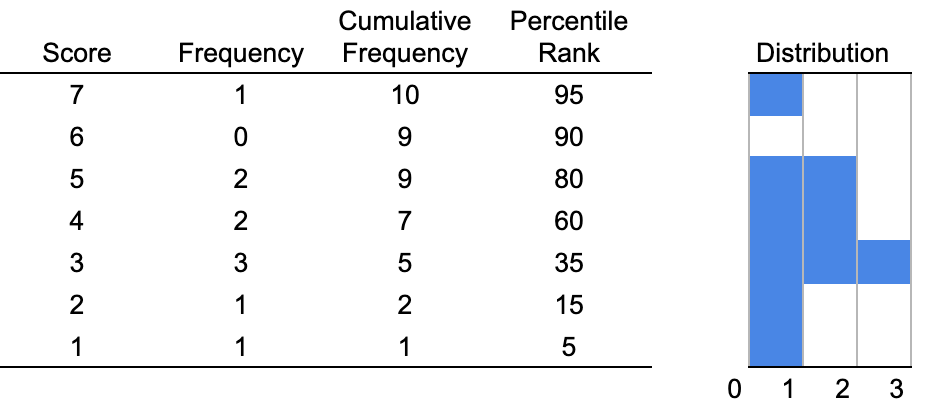
Percentile
The measure of the percentage of data points that are lower than a particular data point.
Z-Score
(aka standardized score) Tells exactly how many standard deviations a specific data points is above or below the mean of a distribution.