Lecture 7: Environmental Quality Guidelines
1/24
There's no tags or description
Looks like no tags are added yet.
Name | Mastery | Learn | Test | Matching | Spaced | Call with Kai |
|---|
No analytics yet
Send a link to your students to track their progress
25 Terms
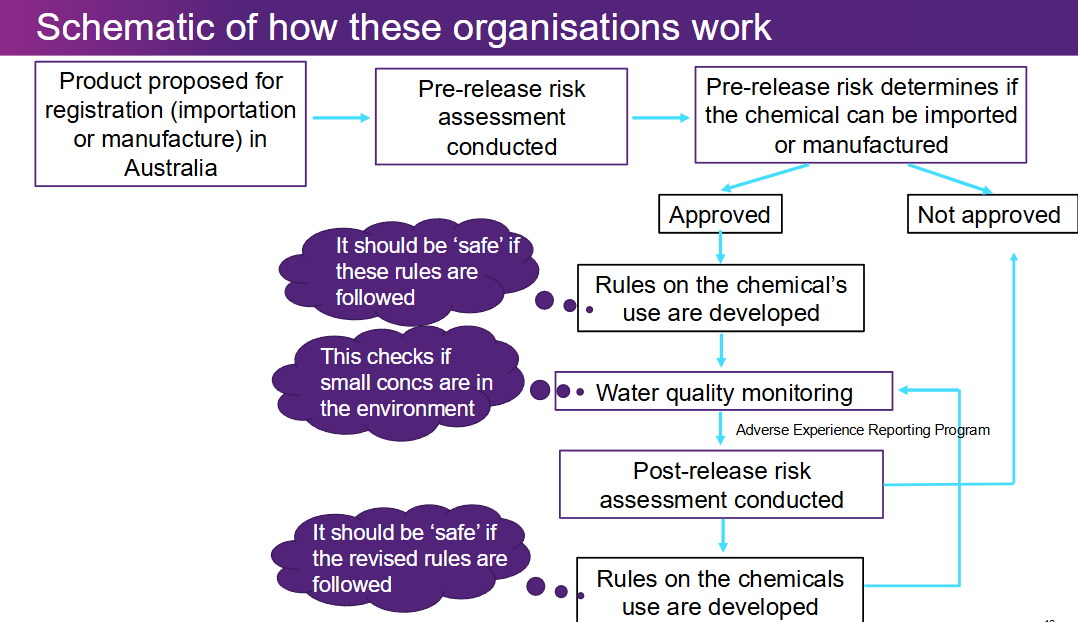
Two types of chemical management
Management of importation and manufacture of chemicals
Management of the harmful effects associated with chemical use
Organisations that manage the importation and manufacturing of chemicals
Australian Pesticides and Veterinary Medicines Administration (APVMA)
Australian Industrial Chemicals Introduction Scheme (AICIS) (Formerly the National Industrial Chemical Notification and Assessment Scheme (NICNAS)) regulation of importation
and manufacture of industrial chemicalsTherapeutic Goods Administration (TGA) – for human medicines
Managing the harmful effects of chemicals
This is done by deriving and using environmental quality guidelines:
Water Quality Guidelines – Surface water and Groundwater
Sediment Quality Guidelines
Soil Quality Guidelines
Biosolids contaminant guidelines
Draft mineral fertiliser contaminant guidelines
Food Safety Standards
Air toxics limits
National Assessment Guidelines for Dredging
How do we manage water quality in Australia?
Australian and New Zealand Guidelines for Fresh and Marine Water Quality (WQGs)
WQGs aim to protect water resources for various *Community Values
risk-based protection (e.g. % of species) is provided by meeting *Default Guideline Values (DGVs)
*uses previously referred to as Environmental Values
*previously called Trigger Values (TVs)
Community Values protected by Australian Gov
Aquatic ecosystems
Primary industries
irrigation
farm supply
livestock
farm use
aquaculture
human consumption of aquatic foods
Recreation and aesthetics
primary contact
secondary contact
visual amenity
Drinking water
Cultural, spiritual and ceremonial
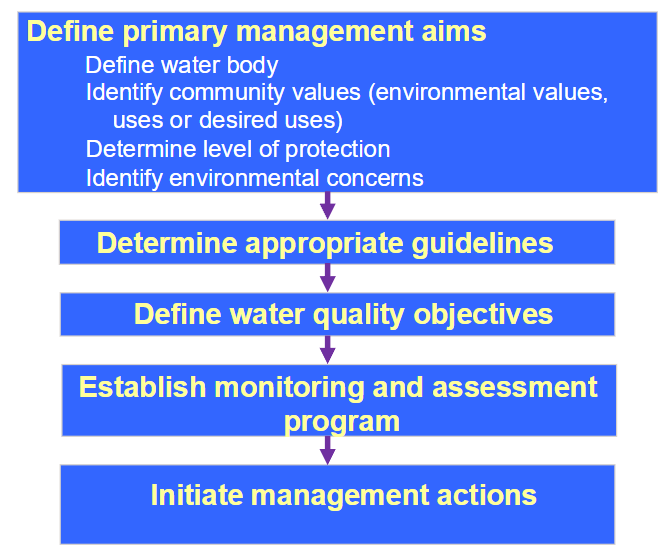
Water quality management framework
Many essential industries are licensed to pollute (in QLD it is called an Environmental Authority):
waste water treatment plants
mine and refineries
aquaculture and meat processing
The WQGs are for ambient water and are not meant to be applied directly to discharges emanating from licensed activities
underlying philosophies: should not pollute up to guideline, continual improvement
Analogy of EQG policy
When the concentration is < EQG, you CAN NOT increase the pollutant concentration up to the EQG.
When the concentration is > EQG, you are required to decrease the pollutant concentration down to < EQG (may not be given license to operate if your pollution will exceed this level)
Three methods of deriving EQGs
Background (reference) concentration method
used for physicochemical properties and naturally occurring pollutants
*Worst known case method
*Risk-based method
*used for synthetic pollutants
*decreasing order of this list is preferred method for toxicants
Background (reference) concentration method
Not used for synthetic chemicals as these do not occur naturally
Used for physicochemical properties and naturally occurring chemical
For stressors that cause problems:
at high concentrations the guideline is the 80th percentile of the reference distribution
e.g. nutrients, suspended particulates, biochemical oxygen demand and salinity
at low concentrations the guideline is the 20th percentile of the reference distribution
e.g. low temperature, low dissolved oxygen content
at high and low concentrations, the guideline is both the 20th and 80th percentile of the reference distribution
e.g. temperature, salinity and pH
Percentiles
Each WQG has three values: 20th, 50th and 80th percentiles (%ile) e.g. 20th %ile means that 20% of the data have lower values and 80% have larger values.
How do you apply percentiles to the guidelines?
If your median is between the 20th and 80th percentiles, then you are within the guidelines. A further investigation will occur when the median concentration of n independent samples taken at a test site exceeds the 80pth percentile. For groundwater and HEV waters there should be no detectable changes to the 20th, 50th and 80pth percentiles.
Pros and cons of background concentration method
Pros
a simple concept
Cons
not simple to determine the background concentration when human activity has occurred nearby
background concentration varies spatially
does not permit any addition of a chemical (overly conservative)
not risk based
lead to potentially unnecessary investigations
Worst known case method (AF method)
It is the Assessment Factor method which is applied to anthropogenic contaminants:
Conduct a thorough literature review for appropriate data
Take the lowest toxicity value and divide by an appropriate assessment factor
The AFS are used to account for uncertainty associated with available data:
Greater certainty that the EQGs will the protect the environment the smaller the AF
Less certainty the larger the AF
Determining the size of AFs to be used
The AFs for the extrapolations are multiplied together e.g. if there is only acute lab data but for ‘many’ species, the AF would be 100 (10 × 10), if there is only acute lab data for ‘few’ species the AF would be 1000 (10 × 10 × 10).
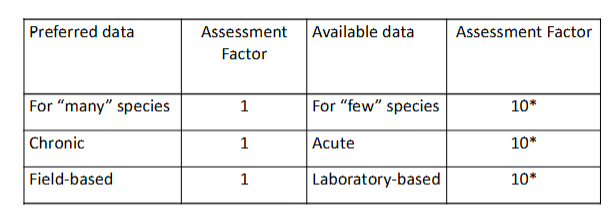
If you were to calculate a guideline value using the Assessment Factor method what data would you like to have?
Data for many species
because the sensitivity of species varies and the more species there are data for the more likely we will protect most species
Chronic toxicity data
because guidelines should protect organisms from life-time exposure
Field-based toxicity data
because that is more realistic that from controlled laboratory conditions
Pros and cons of AF methods
Pros
very easy to understand
very easy to calculate
size of AF can be easily adapted
Cons
AFs are arbitrary (little scientific basis)
not fully consistent with risk paradigm
do not provide a consistent or known level of protection
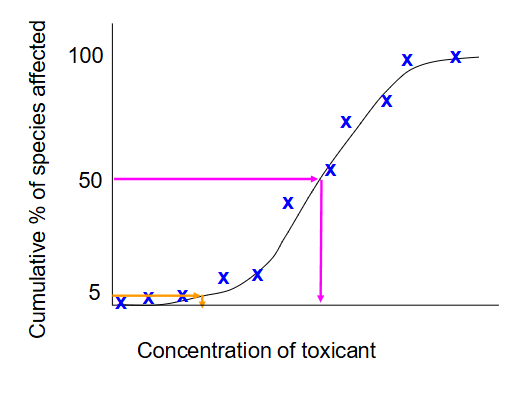
Species Sensitivity Distribution (SSD) Methods
In these methods the cumulative frequency of the sensitivity of a single species is plotted against the toxicant concentration at which each species begins to experience toxicity. Then the concentration that corresponds to protecting a certain percentage of species
is calculated e.g. PC50 (pink) and PC95 (orange)
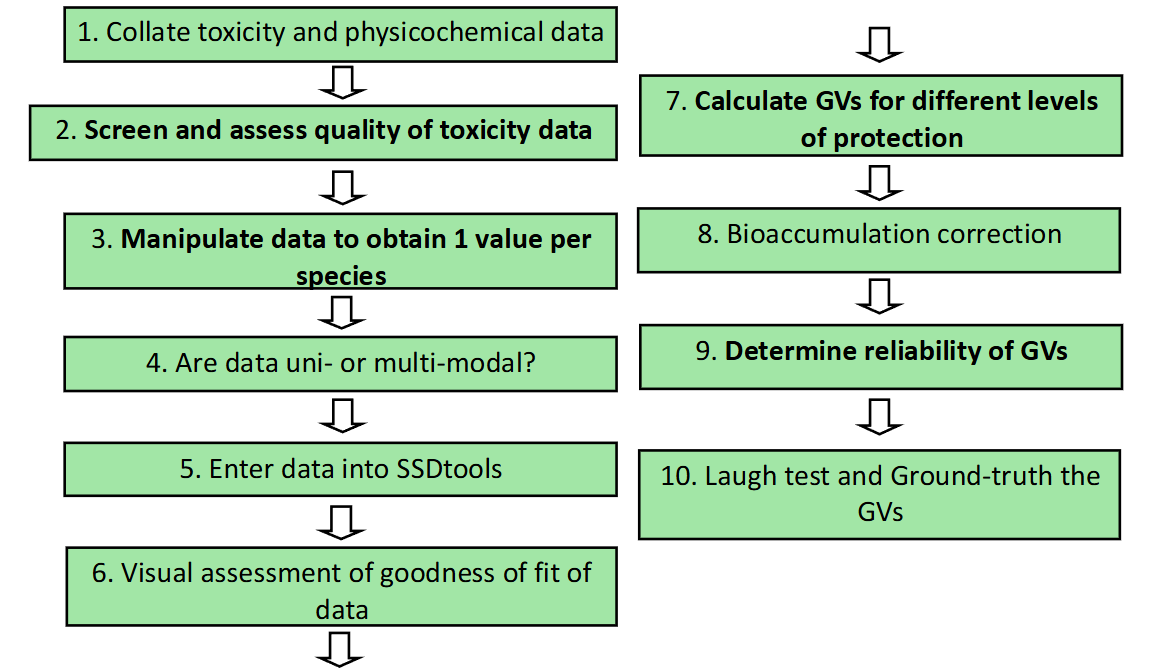
Overview of the method for deriving toxicant GVs using a SSD method
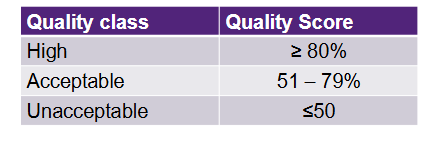
Quality of data and EQs
Data needs to be good quality
Every data point that passes screening must
be assessedin AUS-NZ we use the assessment
method of Warne et al. (2018) and
Heemsbergen et al. (2009), adapted from
Hobbs et al. (2005)other data quality assessment methods
existe.g. CRED (Moermond et al. 2016)
Assesses experimental design; chemical, biological, and statistical methods used in toxicity tests
Why do we calculate a single toxicity value for each species (SSD)?
So that each species is given equal weighting (importance) in the species sensitivity distribution and DGVs. This also implies that all species are of equal importance.
Methods of obtaining a single value per species (SSD)
Arithmetic mean
(a + b + c) / 3
Geometric mean
anti-log [(log a + log b + log c)/3]
better measure of central tendency
Lowest value
the lowest value for a species
Data manipulation rule:
if there was only one TV for species - use this
if there were several TVs for same endpoint, use geometric mean of values
if there were several TVs for different endpoints, the endpoint with the lowest geometric mean is used to represent specieis
![<ul><li><p><span>Arithmetic mean</span></p><ul><li><p><span> (a + b + c) / 3</span></p></li></ul></li></ul><ul><li><p>Geometric mean</p><ul><li><p>anti-log [(log a + log b + log c)/3]</p></li><li><p>better measure of central tendency</p></li></ul></li></ul><ul><li><p>Lowest value</p><ul><li><p>the lowest value for a species</p></li></ul></li></ul><p></p><p>Data manipulation rule: </p><ul><li><p>if there was only one TV for species - use this </p></li><li><p>if there were several TVs for same endpoint, use geometric mean of values </p></li><li><p>if there were several TVs for different endpoints, the endpoint with the lowest geometric mean is used to represent specieis</p></li></ul><p></p>](https://assets.knowt.com/user-attachments/e5ac5594-6ff3-4cf1-8de9-4e756d4b8427.png)
Workflow for Species Sensitivity Distributions
After obtaining one value per species:
data entered into the SSDtools software (this replaces Burrlioz)
this calculates the cumulative frequency value for each species
plots the cumulative frequency values against the concentration at which the toxicity occurs
calculates the concentrations (guidelines) that theoretically should protect 99, 95, 90 and 80% of species
SSDtools can calculate the concentration that should protect any % of species or the % species that should be protected by any concentration
Cumulative frequency distributions (unlogged and logged)
Dat
Cumulative frequency = rank/(n + 1) e.g. for the first data point CF = 1/(13 + 1) = 1/14 = 0.07 or 7 %