Opportunity Fund Final Flashcards
1/238
There's no tags or description
Looks like no tags are added yet.
Name | Mastery | Learn | Test | Matching | Spaced | Call with Kai |
|---|
No analytics yet
Send a link to your students to track their progress
239 Terms
Auditors Report
Where an auditor gives their opinion on if a company’s statements gives a fair and accurate depiction of its financial and operating results
Auditor
an accounting specialist who examines financial statements and records and attests to their accuracy and validity
The Big Three Core Financial Statements
Income Statement, Balance Sheet, Statement of Cash Flows
Gross Profit
Revenue-COGS
Gross Profit Margin
Gross Profit/ Revenue
Operating Income
Total Rev.-Direct Cost-Indirect cost
Gross Profit-Operating Expenses
Net Earnings+Interest Expense+Tax
Operating Margin
Operating Profit/ Revenue
Net Interest Expense
Interest Income-Interest Expense
Pre-tax margin
pre-tax income/ revenue
Net Income
Revenue-Total Expenses
Net Income Before Taxes - Income Taxes
Net Margin
Net Income/ Revenue
Time Value of Money consists of four beliefs
Investment risk is important
Money today is worth more than money tomorrow
Inflation must be considered when making investment decisions
investment opportunities costs must be considered
GDP Equation
Consumption + Investment + Government +Net Exports (Exports-Imports)
Macroeconomics Investors Focus on primarily:
national output
unemployment
inflation
interest rates
consumer spending/ confidence
government and trade balances - Deficits
Foreign Exchange Rates
Elasticity of Demand
Measures how quantity demanded responds to price changes.
Veblen goods
are a type of luxury good for which demand increases as the price increases, contrary to typical demand behavior. They are often associated with higher status and prestige.
Geffen good
is a type of inferior good for which demand increases as income decreases, showing an exception to the normal demand law.
What is a Stock?
a legal document representing ownership in a company
What is a stock market?
a marketplace where shares of publicly traded companies are bought and sold
What are the two sources of capital?
The two sources of capital are debt and equity, representing borrowed funds and funds raised from owners or investors, respectively.
How frequently can the income statement be prepared?
An income statement can be prepared quarterly or annually, depending on the reporting requirements of the business.
Cash Accounting
A method of accounting where revenues and expenses are recorded when cash is actually received or paid, as opposed to when they are incurred.
Accrual Accounting
A method of accounting where revenues and expenses are recorded when they are earned or incurred, regardless of when cash is actually received or paid.
Gross Margin
the percentage of total sales revenue that the company retains after incurring the direct costs associated with producing the goods and service it sells
on the Income Statement
Gross Margin Calculation:
(Gross Profit/ Revenue)x 100
Operating Margin (EBIT Margin)
Indicates how much of each dollar of revenue remains after accounting for both cost of goods sold and operating expenses. It measures a company’s operational efficency and pricing strategy
on the income statement
EBITDA Margin
shows the percentage of earnings before interest, taxes, depreciation, and amortization in relation to total revenue. It provides insight into a company’s operational performance without the impacts of financing and accounting decisions
EBITDA Margin Equation:
EBITDA/ Revenue x 100
Net Margin (Profit Margin)
Reflects the percentage of revenue that remains as net income after deducting all expenses, taxes, and interest. It measures the overall profitability of a company
Net Margin Equation
Net income/ revenue x 100
Free Cash Flow Margin
Measures the percentage of revenue that is converted into free cash flow. It indicates how efficiently a company generates cash from its operating activities.
Free Cash Flow Margin Equation
Free Cash flow/ revenue x 100
Balance Sheet
shows how much it has, what it owes, and what’s left for the owners. It is a snapshot in time that shows what a company owns and owes at that moment.
Total Assets=Total liability+ Shareholders’ equity
Goodwill
the extra amount paid when buying a company based off of value of brand, customers, or reputation. Goodwill can’t be created internally. Only recorded when a business is acquired
Goodwill formula
Goodwill= Purchase price - Net Identifiable assets
Short- term debt consists of:
Bank Loans
Commercial Paper
Credit Line
Revolver
Bank Loans
a type of short-term debt provided by banks, typically requiring repayment within one year, often used for working capital or immediate financial needs.
Commercial Paper
A short-term unsecured debt instrument used by corporations to raise funds, typically maturing in less than a year.
Credit Line
A flexible loan option that allows borrowers to access funds up to a specified limit, typically used for short-term financing needs and requiring repayment over a short period.
Revolver
A type of credit facility that allows borrowers to withdraw, repay, and withdraw again up to a maximum limit within a specified period. It is commonly used for managing cash flow fluctuations.
Working Capital
Working Capital = Current Assets - Current Liabilities
Long-term Debt
Corporate Bonds
Term loan
LT Line of credit
Property mortgages
Corporate Bonds
A type of debt security issued by corporations to raise capital, where investors receive periodic interest payments and repayment of the principal at maturity.
Term Loan
A loan from a financial institution for a specific amount that has a specified repayment schedule and a fixed or variable interest rate, typically used for purchasing assets or funding operations.
LT Line of Credit
A credit facility allowing access to a specified amount of funds by a borrower, usually on a revolving basis, to meet short-term financial needs.
Property Mortgage
A loan secured by real estate, typically used to purchase residential or commercial property, where the property serves as collateral for the loan.
Retained Earnings
cumulative profits not paid out in dividends
Net Identifiable Assets
All the assets you can see and measure, minus the liabilities
IRR (internal rate of return)
The discount rate that makes the net present value of cash flows from an investment equal to zero, indicating its profitability.
EVA (Economic Value Added)
A measure of a company's financial performance that shows the net profit after deducting the cost of capital, reflecting the value created for shareholders.
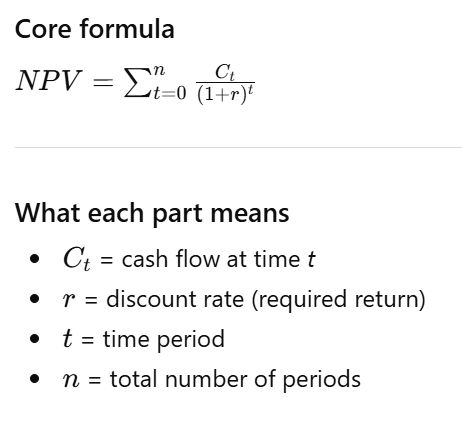
NPV (Net Present Value)
The difference between the present value of cash inflows and outflows over a period of time, used to assess the profitability of an investment.
ROIC (Return on Invested Capital)
A financial metric used to measure the efficiency of a company in allocating capital to profitable investments, calculated as the ratio of net income to invested capital.
ROI (Return on Investment)
(Return on Investment) is a measure used to evaluate the efficiency or profitability of an investment, calculated as the ratio of net profit to the initial cost of the investment.
IRR Equation (%):
(Future Value (FV)^(1/periods)/ Present Value (PV)) - 1
EVA
NOPAT-(WACC*capital invested)
NOPAT: Net Operating Profit After Tax
WACC: Weighted Average Cost of Capital
NPV Formula
ROIC formula
NOPAT/ Average Invested Capital
ROI Formula
Net Return/ Cost of Investment
10K includes five distinct sections:
Business Overview, Risk Factors, Management Discussion and Analysis, Financial Statements, and Notes to Financial Statements.
Equity Research
The process of analyzing a company's financials and performance to determine its value and potential investment merits. This often includes assessing market conditions, financial models, and competitive positioning.
What do Equity Researchers Do?
they look deep into:
Company financials
market trends
industry performance
management quality
then write detailed reports with investment advice
Research Report
A typical equity research report includes
company overview
financial analysis
valuation models (like DCF, P/E)
Price target
Recommendation (Buy/ Sell/ Hold)
Buy side versus sell side
Sell Side (brokerage firms)
publish reports for clients
influence trading volume
Buy-side (mutual funds, AMC’s)
do private research for internal investment decisions
Which accounting principle requires that expenses be recorded in the same accounting period as the related revenues they help generate?
Matching Principle
Cash Flow Statement
A financial statement that summarizes the amount of cash and cash equivalents entering and leaving a company. It provides insights into the company's liquidity, operational efficiency, and financial health by detailing cash flows from operating, investing, and financing activities.
What is the purpose of a cash flow statement?
The purpose of a cash flow statement is to provide a detailed picture of what happened to a business’s cash during a specified period, known as the accounting period. It demonstrates an organization’s ability to operate in the short and long term, based on how much cash is flowing into and out of the business.
Cash flow statement broken into three sections:
Operating, investing, and financing activities.
Operating Activites
operating activities detail cash flow that’s generated once the company delivers its regular goods or services and includes both revenue and expenses
Investment Activites
investment activities include cash flow from purchasing or selling assets— think physical property, such as real estate or vehicles, and non-physical property like patents— using free cash, not debt
Financing Activites
Financing activities detail cash flow from both debt and equity financing
Positive Cash Flow
indicates that a company has more money flowing into the business than out of it over a specified period. This is an ideal situation to be in because having an excess of cash allows the company to reinvest in itself and its shareholders, settle debt payments, and find new ways to grow the business
does not neccesarily trranslate to profit.
Negative Cash Flow
Having negative cash flow means your cash outflow is higher than your cash inflow during a period, but it doesn’t necessarily mean profit is lost. Instead negative cash flow may be caused by expenditure and income mismatch, which may or may not be a bad thing
Negative cash flow can come from the decision to expand the business and invest in future growth, or the decline in the underlying business. Given that, it’s critical to not make a knee-jerk assumption one way or the other.
Quick Ratio
Acct receivable+inventory/ accounts payable
EBIT
Earnings before interest and taxes
Depreciation and Amortization
D+A=DA
EBITDA
Earnings before interest, taxes, depreciation, and amortization
Return on Assets
Profit measure of choice/ asset base of choice
Return on equity
profit of choice/ shareholders equity
Debt to EBITDA
Total debt/ EBITDA
Interest Coverage Ratio (Times interest earned):
EBITDA/ Interest expense
Debt to Equity Ratio
Total debt/ Total shareholders equity
The difference between the balance of a fixed asset account and the related accumulated depreciation account is termed:
the book value
Days Sales Outstanding
(Average Accounts Receivable/ Revenue) x 365 days
Inventory Turnover Ratio
COGS/ Average Inventory
DCF
Discounted Cash Flow
helps to determine the value of an investment based on its future cash flows
the present value of expected future cash flow is arrived at by using projected discount rate
if the DCF is higher than the current cost of the investment, the opportunity could result in positive returns and may be worthwhile
companies typically use the weight average cost of capital for the discounted rate because it accounts for the rate of return expected by shareholders
a disadvantage of DCF is its reliance on estimations of future cash flows,
Okun’s Law
the inverse relationship between unemployment and GDP Growth
Inflation
Definition: A sustained increase in the general price level.
Measurement: CPI (consumer prices) or GDP deflator, which convert nominal values to real terms to separate price changes from real output.
Primary Causes:
Demand-pull: Aggregate demand grows faster than supply.
Cost-push: Rising input costs (wages, commodities).
Built-in: Expectations of future inflation lead to further increases.
Economic Effects:
Erodes real purchasing power.
Distorts relative prices and investment decisions.
Redistributes wealth between debtors and creditors (depending on whether inflation is anticipated).
Policy Response: Central banks use monetary policy (interest rates, open-market operations) to stabilize inflation, balancing the short-run tradeoff between reducing inflation and avoiding excessive output loss.
Nominal GDP
measures output at current market prices; it rises with output and price level changes
Real GDP
measures output at a constant prices (adjusted for inflation); its isolates changes in real production
GDP Deflator
is the price index that converts nominal to real GDP; when the deflator rises, nominal growth can overstate real growth
Policy relevance of Real vs. nominal GDP
Real GDP is used to assess economic growth and productivity; nominal GDP matters for tax receipts, debt ratios, and nominal income measures
What is equity analysis?
Equity analysis is the process of researching and evaluating a
company's financial health, industry position, and future
prospects to determine the PROPER value of its stock. The
primary goal of equity analysis is to determine whether to buy, sell,
or hold a particular stock. This involves a deep dive into various
aspects of a company, including its financial statements,
management quality, competitive landscape, corporate strategy,
and macroeconomic factors that might influence its performance.
By understanding these elements, analysts can form a
comprehensive view of a company's true worth, which may differ
significantly from its current market price.
Net cash balance:
all cash- all interest bearing debt
Total interest-bearing debt:
all short term debt+ all long term debt
Net working capital/ sales
same as working capital/ sales
Cash Flow to Debt Ratio
Total Debt/ Cash Flow From Operations
Operating Cash Flow Margin
Cash Flow From Operations/ Net Revenues
Free Cash Flow Yield
Free Cash Flow/ Market Capitalization
Free Cash Flow to Sales Ratio
Free Cash Flow/ Net Revenue
Free Cash Flow Conversion
Free Cash Flow/ Net Income