Normal & Binomial Distributions: Key Concepts and Applications
1/25
There's no tags or description
Looks like no tags are added yet.
Name | Mastery | Learn | Test | Matching | Spaced | Call with Kai |
|---|
No analytics yet
Send a link to your students to track their progress
26 Terms
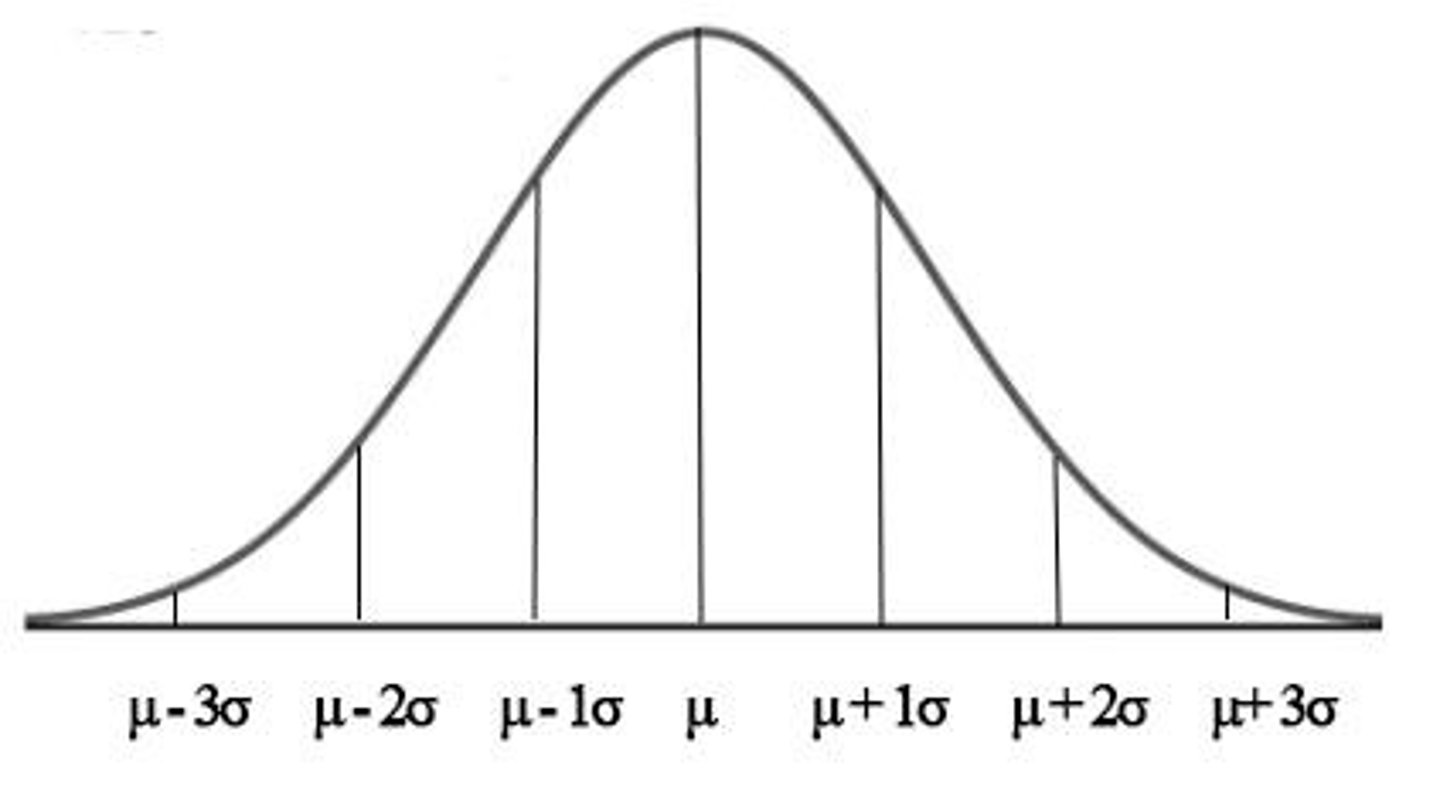
What are the three defining characteristics of a Normal distribution curve?
It is symmetric, unimodal, and bell-shaped.
What is the total area under a Normal distribution density curve?
1
What does the normal distribution model?
A continuous quantitative variable
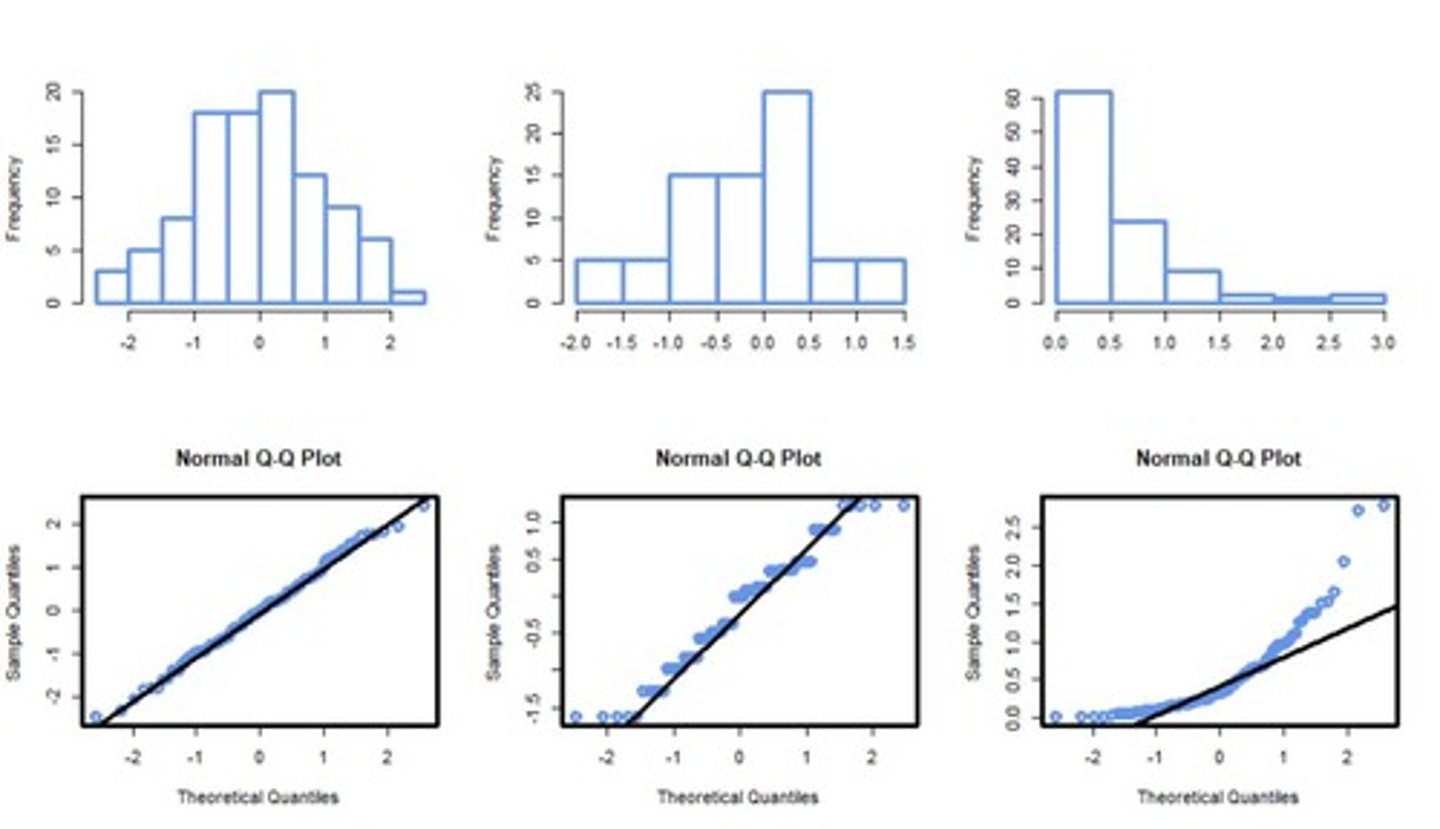
What is the purpose of a Normal Q-Q plot?
To assess whether a set of data plausibly came from a Normal distribution.
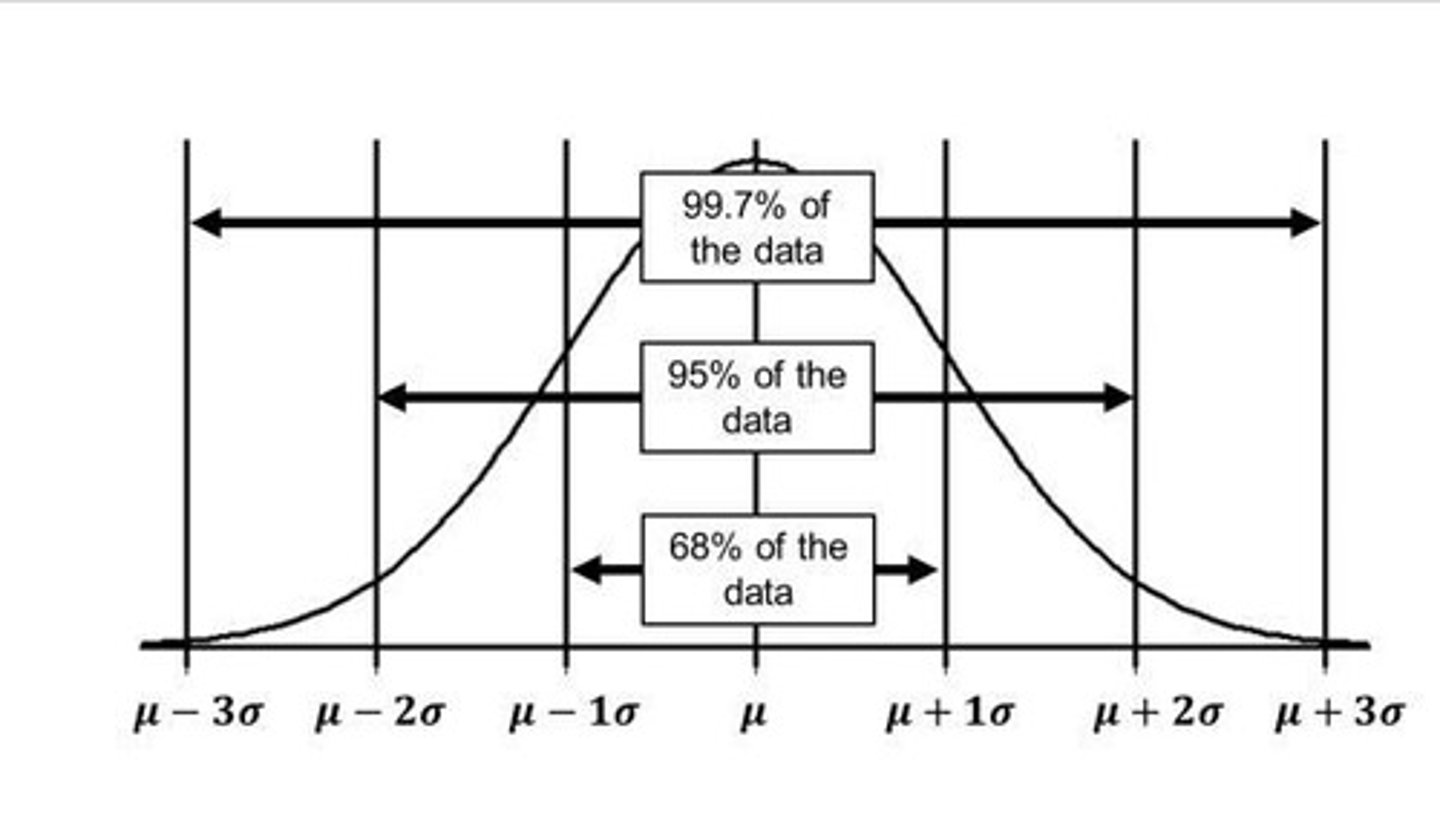
What does the Empirical Rule (68-95-99.7 Rule) state regarding standard deviations from the mean?
68% of data falls within 1 standard deviation, 95% within 2, and 99.7% within 3.
What is the formula for calculating a z-score?
z = (x - μ) / σ
What is z-score?
Tells you how many standard deviations the value x is above or below the mean (μ).
What are the mean and standard deviation of the standard normal distribution?
Mean = 0, Standard Deviation = 1
Why is standardizing data into z-scores useful?
It allows for the comparison of data points from different populations or distributions.
What is the Standard Normal Distribution?
A normal distribution of standardized z-scores, which are also normally distributed, with a mean of 0 and a standard deviation of 1.
What is the relationship between probabilities for X and probabilities for Z?
P(X < x) = P(Z < z)
In Excel, what does the NORM.DIST function calculate?
The cumulative probability for a given value in a normal distribution.
What is the primary limitation of the Excel NORM.DIST function?
It only calculates the area to the left of a given value.
How do you calculate the probability of X being greater than a value using Excel?
1 - NORM.DIST(x, μ, σ, TRUE)
How do you calculate the probability of X falling between two values in Excel?
Calculate the cumulative probability of the upper bound minus the cumulative probability of the lower bound.
What does the NORM.INV function in Excel return?
The value (x) corresponding to a specific cumulative probability.
How do you find the value corresponding to the 90th percentile using Excel?
Use NORM.INV(0.9, μ, σ)
How do you find the two values that contain the middle 90% of a distribution?
Use NORM.INV(0.05, μ, σ) for the lower bound and NORM.INV(0.95, μ, σ) for the upper bound.
What does a z-score of 0 represent?
A value exactly equal to the mean.
If a z-score is negative, where does the data point lie relative to the mean?
Below the mean.
What does the notation X ~ N(μ, σ) signify?
A random variable X that follows a Normal distribution with mean μ and standard deviation σ.
What is the definition of a percentile?
A measure indicating the value below which a given percentage of observations in a group of observations fall.
What is the difference between variance and standard deviation?
Variance is the square of the standard deviation.
If you are looking for the value shorter than 65% of all data, what probability do you input into NORM.INV?
0.65
What does 'cumulative' mean in the context of the NORM.DIST function?
It indicates that the function should return the area under the curve from negative infinity up to the specified x-value.
How do you find the probability of X being less than a value OR greater than another value?
Sum the probability of X being less than the first value and the probability of X being greater than the second value.