Final Exam (chp9 & 11)
1/50
There's no tags or description
Looks like no tags are added yet.
Name | Mastery | Learn | Test | Matching | Spaced | Call with Kai |
|---|
No analytics yet
Send a link to your students to track their progress
51 Terms
Long-term decisions versus short-term decisions
– longer time horizons,
– cost larger sums of money, and
– require a lot more information to be collected as part of their analysis, than short-term decisions.
• Capital budgeting meets all three criteria
Three keys things to remember about capital budgeting decisions include:
1. Typically a go or no-go decision on a product, service, facility, or activity of the firm.
2. Requires sound estimates of the timing and amount of cash flow for the proposal.
3. The capital budgeting model has a predetermined accept or reject criterion.
Payback Period
The length of time in which an investment pays back its original cost.
its main focus is on cost recovery or liquidity.
The method assumes that all cash outflows occur right at the beginning of the project’s life followed by a stream of inflows.
Also assumes that cash inflows occur uniformly over the year.
What does this mean?
Payback period ← the cutoff period → and vice-versa.
if the Payback period is < (less than) cutoff period, accept. if the Payback period is > (greater than) cutoff period, reject.
The payback period method has three major flaws:
1. It ignores all cash flow after the initial cash outflow has been recovered.
2. It ignores the time value of money.
3. It ignores the riskiness of the cash flows.
Discounted Payback Period
Calculates the time it takes to recover the initial investment in current or discounted dollars.
• Incorporates time value of money by adding up the discounted cash inflows at time 0, using the appropriate hurdle or discount rate, and then measuring the payback
period.
• It is still flawed in that cash flows after the payback is ignored.
How to solve for Discounted Payback Period
PV= FV/(1+r)^n (For each cashflow)
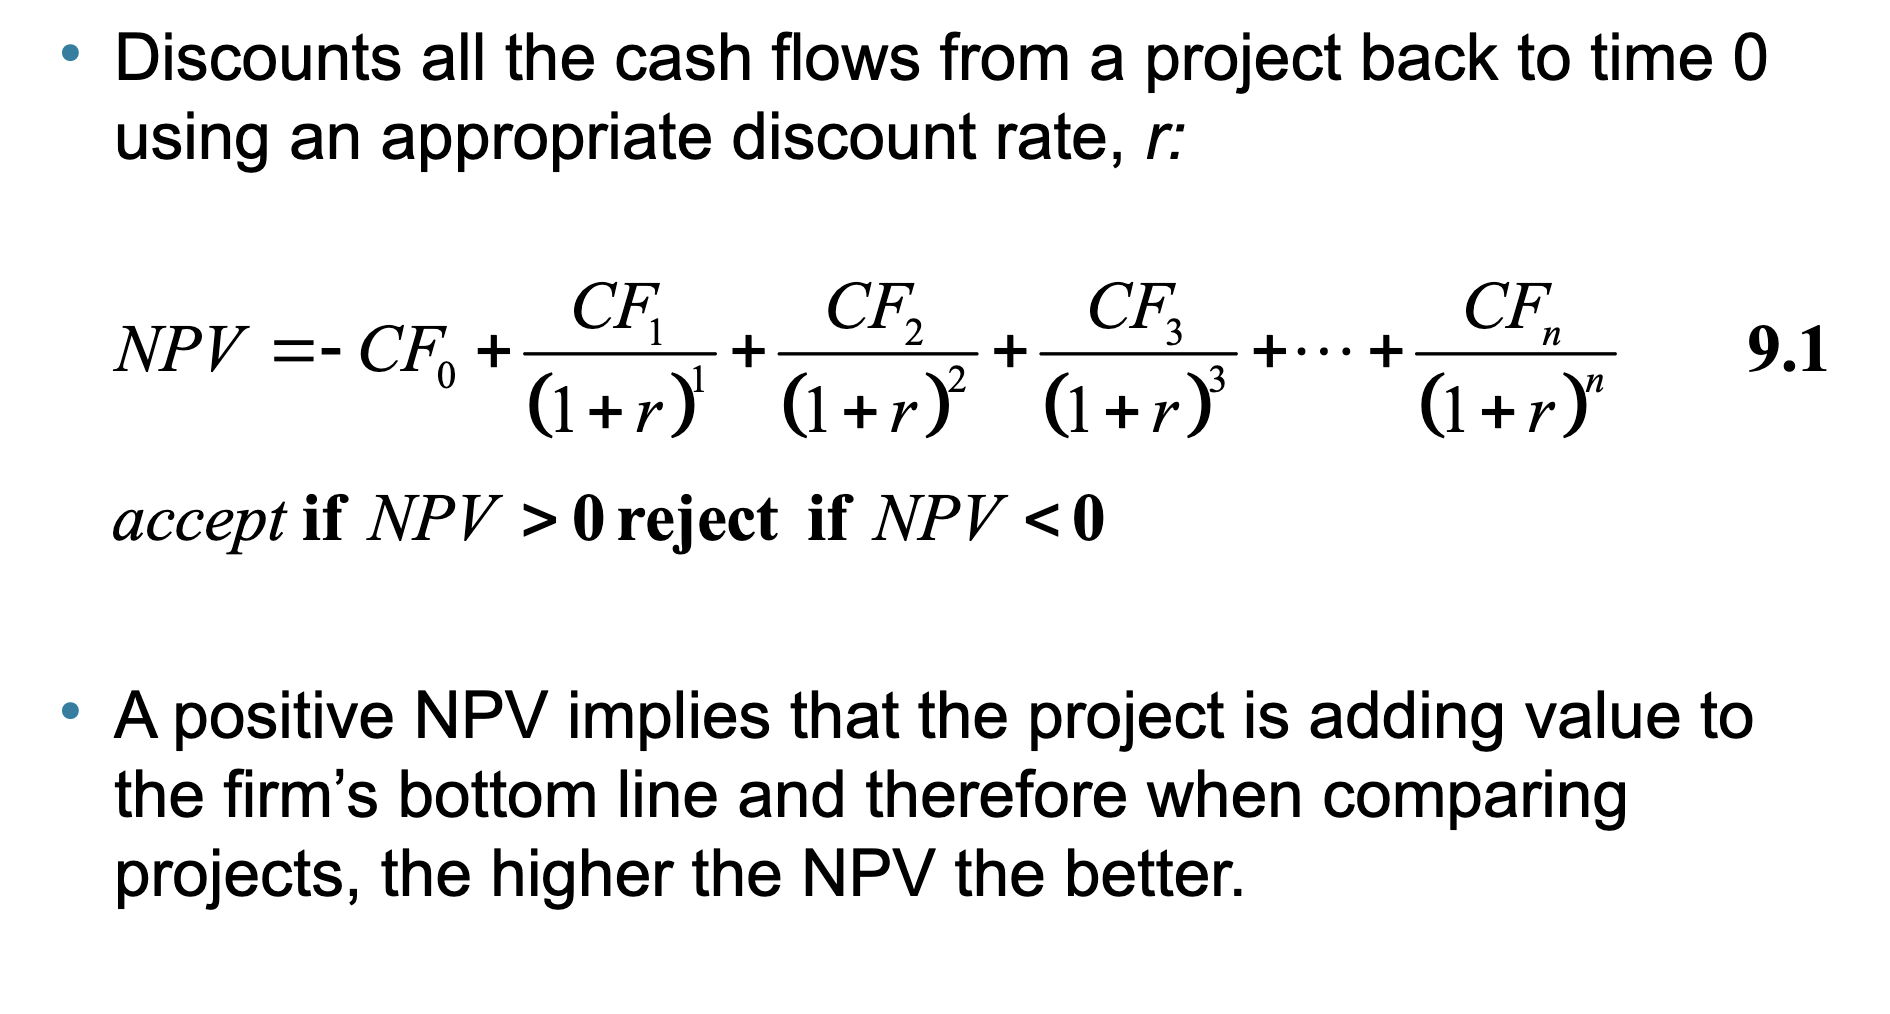
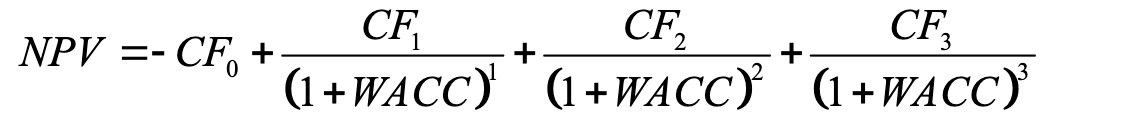
Net Present Value
Considered the best option:
Mutually Exclusive Versus Independent Projects
NPV approach useful for independent as well as mutually exclusive projects.
A choice between mutually exclusive projects arises when:
1. There is a need for only one project, and both projects can fulfill that need.
2. There is a scarce resource that both projects need, and by using it in one project, it is not available for the second.
NPV rule considers whether or not discounted cash inflows outweigh the cash outflows emanating from a project.
Higher positive NPVs would be preferred to lower or negative NPVs.
Decision is clear-cut; One or the other, Both, or None
A Mutually Exclusive project means…
One or the other
A Independent Project means
both can be chosen
Appropriate Discount Rate or Hurdle Rate
• Discount rate or hurdle rate is the minimum acceptable rate of return that should be earned on a project given its riskiness.
• For a firm, it would typically be its weighted average cost of capital (covered in later chapters).
Problems with the Internal Rate of Return
• In most cases, NPV decision = (BLANK) decision
– That is, if a project has a positive NPV, its IRR will exceed its hurdle rate, making it acceptable. Similarly, the highest NPV project will also generally have the highest IRR.
However, there are some cases when the IRR method leads to ambiguous decisions or is problematic. In particular, we can have the following problem with the IRR approach:
1. Multiple IRRs;
IRR
Multiple Internal Rates of Return
How many sign changes are shown in the picture
2
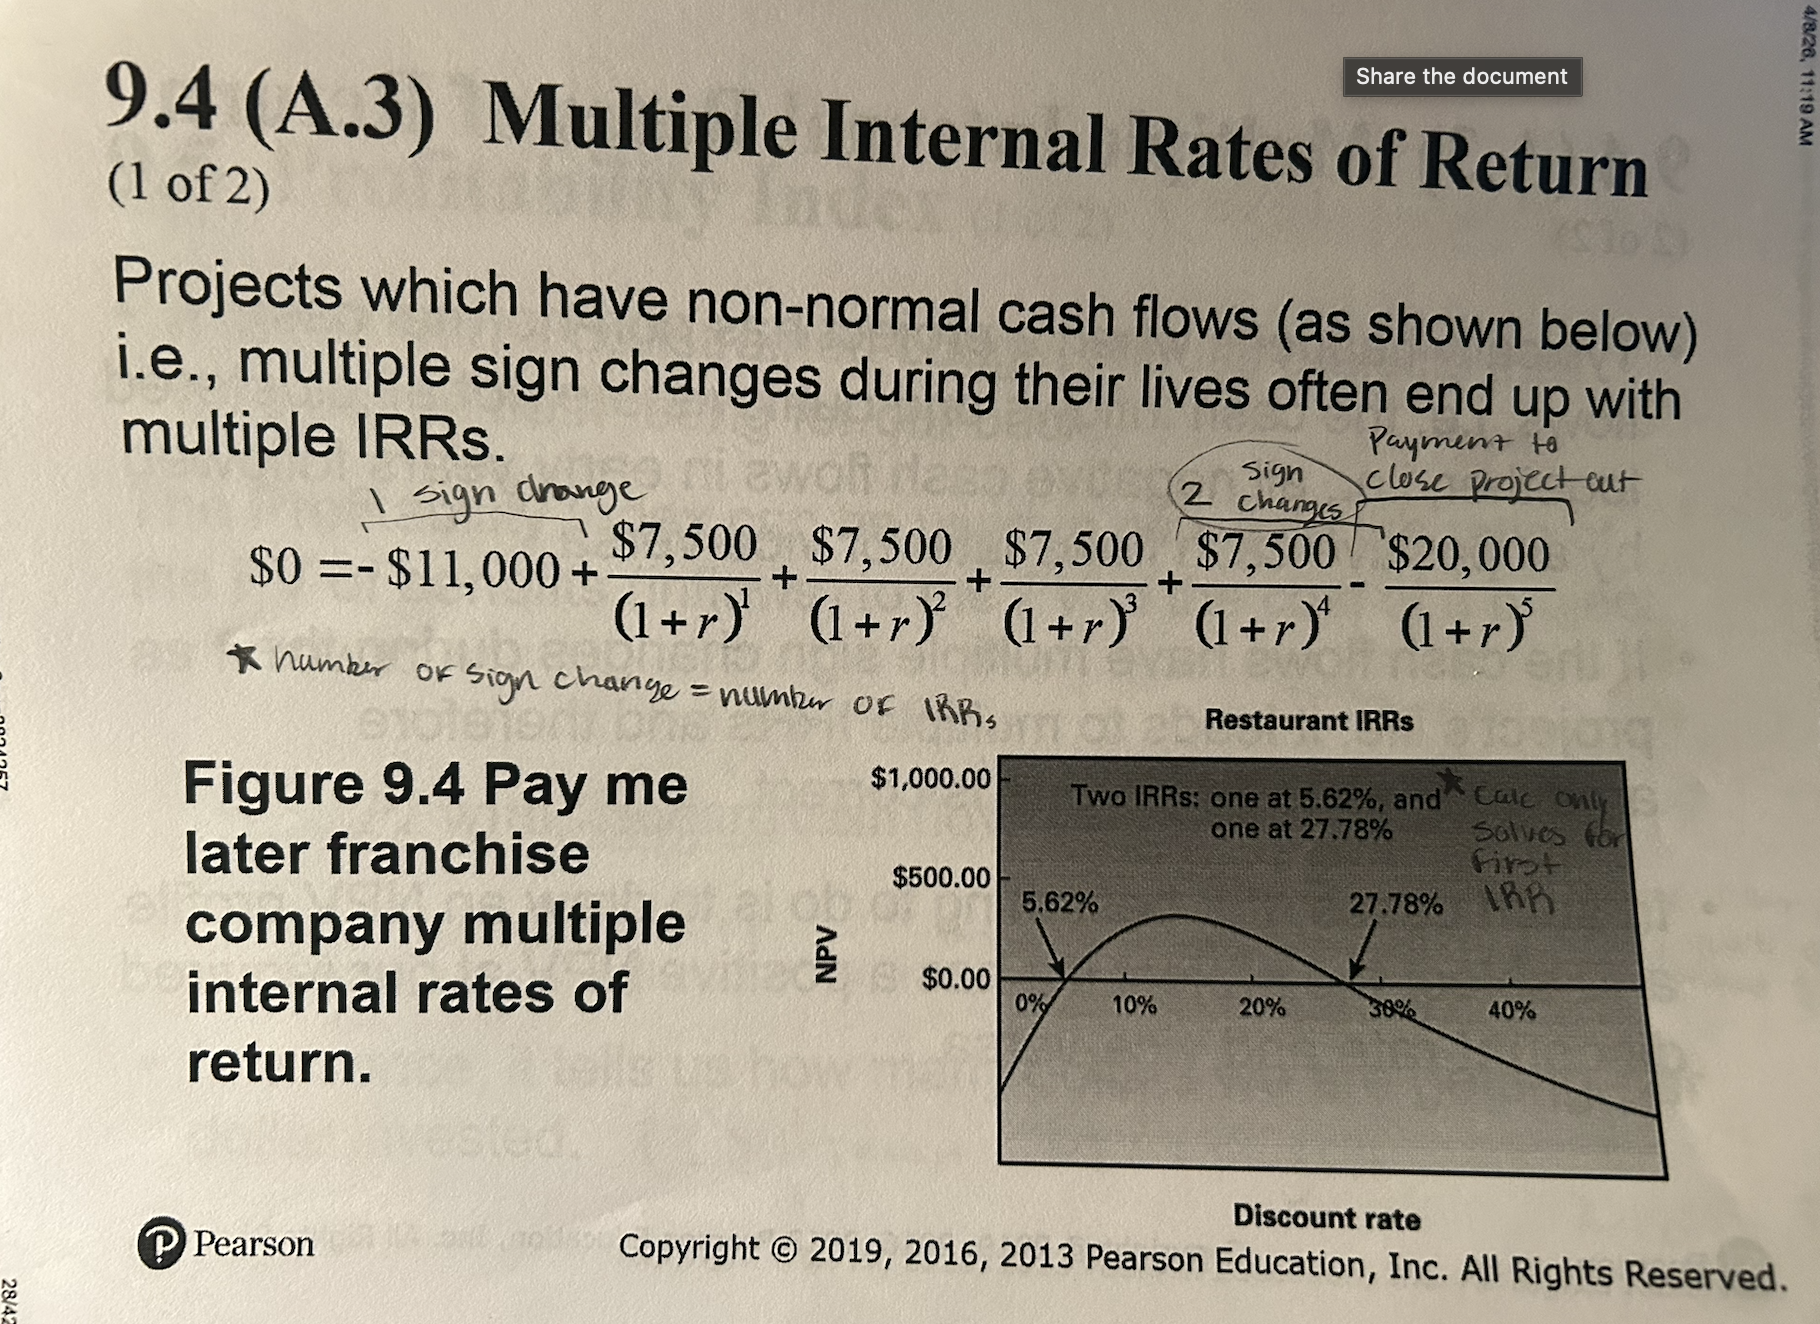
Multiple Internal Rates of Return
• Typically happens when a project has non-normal cash
flows, i.e. the cash inflows and outflows are not all clustered
together, i.e., all negative cash flows in early years followed
by all positive cash flows later or vice-versa.
• If the cash flows have multiple sign changes during the
project’s life, it leads to (BLANK) and therefore
ambiguity as to which one is correct.
• In such cases, the best thing to do is to draw an NPV profile
and select the project if it has a positive NPV at our required
discount rate and vice-versa.
multiple IRRs
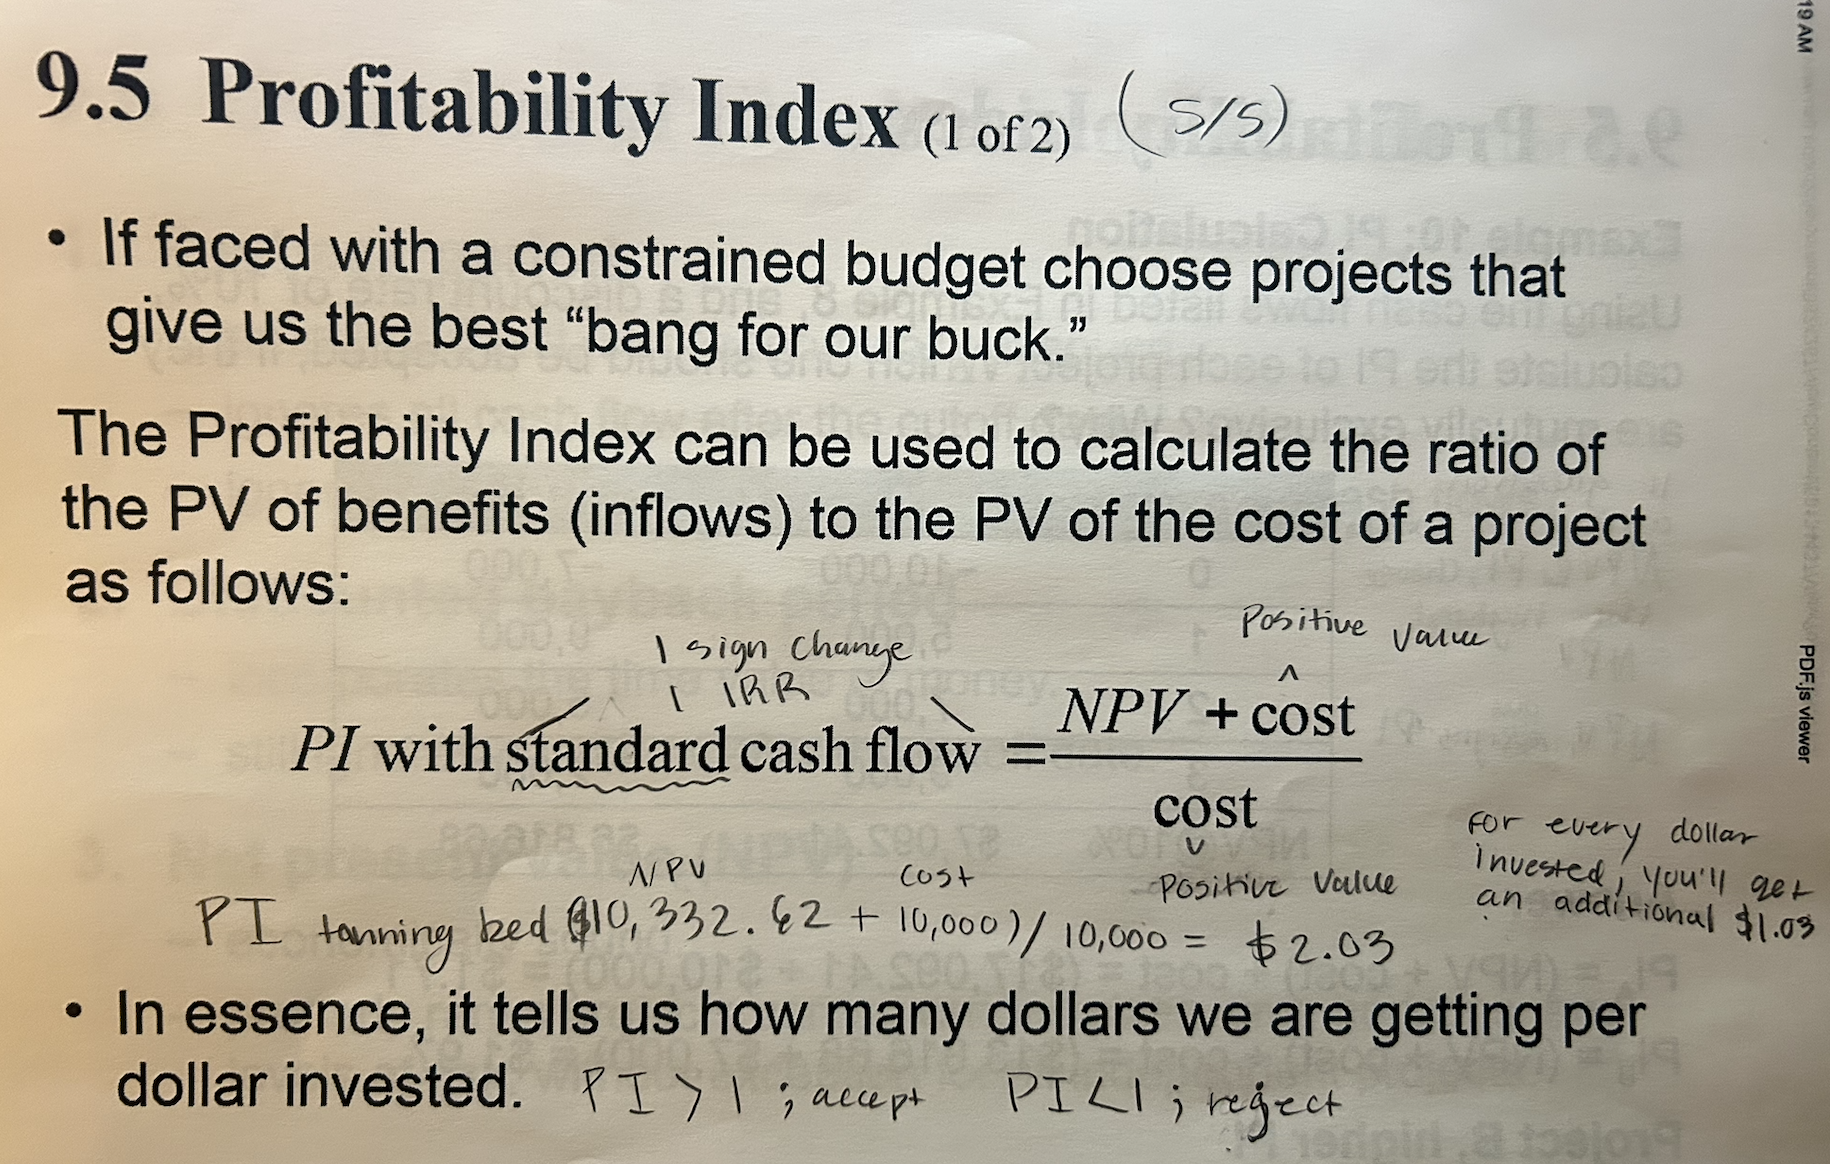
Profitability Index picture
Overview of Five Decision Models
1. Payback period
– simple and fast, but economically unsound.
– ignores all cash flow after the cutoff date.
– ignores the time value of money and riskiness of cash flows.
Overview of Five Decision Models
2. Discounted payback period
– incorporates the time value of money.
– still ignores cash flow after the cutoff date.
Overview of Five Decision Models
3. Net present value (NPV)
– economically sound.
– properly ranks projects across various sizes, time horizons, and
levels of risk, without exception for all independent projects.
Overview of Five Decision Models
4. Internal rate of return (IRR)
– provides a single measure (return).
– has the potential for errors in ranking projects.
– can also lead to an incorrect selection when there are two
mutually exclusive projects or incorrect acceptance or rejection of
a project with more than a single IRR.
Overview of Five Decision Models
5. Profitability index (PI)
– incorporates risk and return.
– but the benefits-to-cost ratio is actually just another way of
expressing the NPV.
The Cost of Capital: A Starting Point
• Three broad sources of financing available or raising capital: (BLANK).
• Each has its own risk and return profile and therefore its own rate of return required by investors to provide funds to the firm.
Bondholders (debt), common stock (equity), and preferred stock (hybrid equity)
Before tax cost of debt:
Debt financing (Rd) = bondholders
Cost of equity:
Equity financing (Re) = common stockholders
Cost of preferred:
Hybrid equity financing (Rps) = preferred stockholders
The Cost of Capital: A Starting Point
The weighted average cost of capital (WACC) is estimated by multiplying each component weight by the component cost and summing up the products.
The WACC is essentially the minimum acceptable rate of return that the firm should earn on its investments of average risk, in order to be profitable.
WACC → discount rate for computing NPV
→ IRR > WACC for acceptance of project.
To determine a firm’s WACC we need to know how to calculate:
1. the relative weights and
2. costs of the debt, preferred stock, and common stock of a firm.
Debt Component
• The cost of debt (Rd) is the rate that firms have to pay when they borrow money from banks, finance companies, and other lenders.
• It is essentially measured by calculating the yield to maturity (YTM) on a firm’s outstanding bonds, as covered in Chapter 6.
• Although best solved for by using a financial calculator or spreadsheet, the YTM can also be figured out as follows:
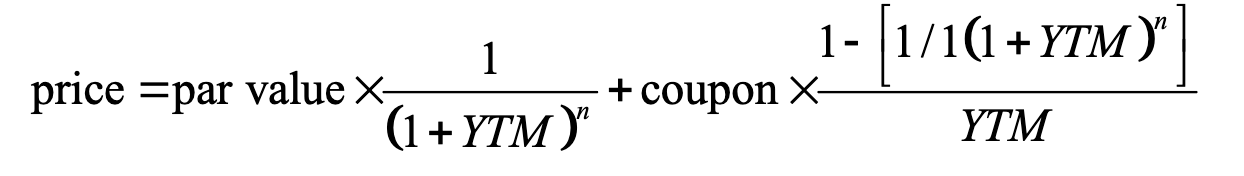
Debt Component
YTM on outstanding bonds indicates what investors require for lending the firm their money in current market conditions.
However, new debt would also require payment of transactions costs to investment bankers reducing the net proceeds to the issuer and raising the cost of debt.
→ We must adjust the market price by the amount of (BLANK) that would have to be paid when issuing new debt, and then calculate the YTM.
commissions (floatation costs)
Preferred Stock Component
Preferred stock holders receive a constant dividend with no maturity point.
The cost of preferred (Rps) can be estimated by dividing the annual dividend by the net proceeds (after floatation cost) per share of preferred stock:
Rps = Dps ÷ net price
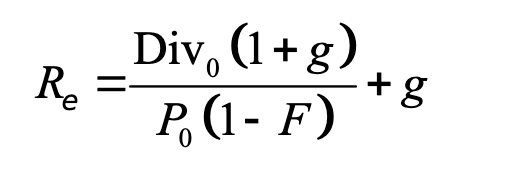
The cost of equity (Re) is essentially the rate of return that investors are demanding or expecting to make on money invested in a company’s common stock.
The cost of equity can be estimated by using either the (BLANK) or (BLANK)
SML approach (covered in Chapter 8)
Dividend Growth Model (covered in Chapter 7)
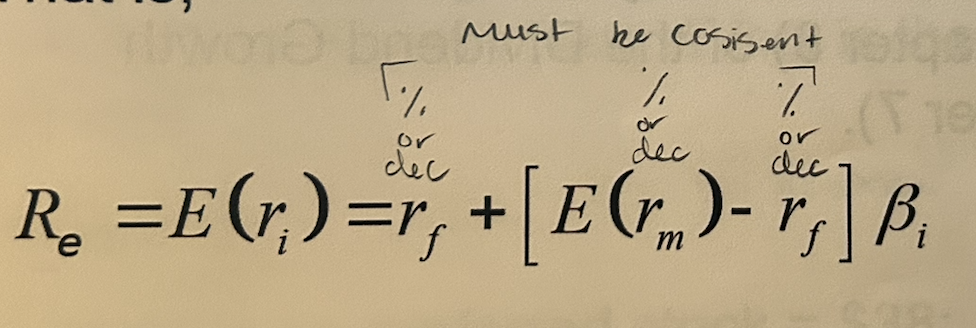
The Security Market Line Approach: calculates the cost of equity as a function of the risk-free rate (rf) the market risk- premium [E(rm) − rf], and beta (βi).
That is,
The dividend growth approach to Re: The Gordon Model, introduced in Chapter 7, is used to calculate the price of a constant growth stock.
However, with some algebraic manipulation it can be transformed into Equation 11.6, which calculates the cost of equity, as shown below:
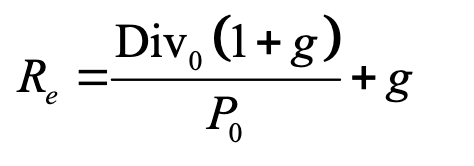
last paid dividend per share;
Div 0
Current market price per share;
P o
constant growth rate of dividend.
g
Div0 (1+g)
Div 1
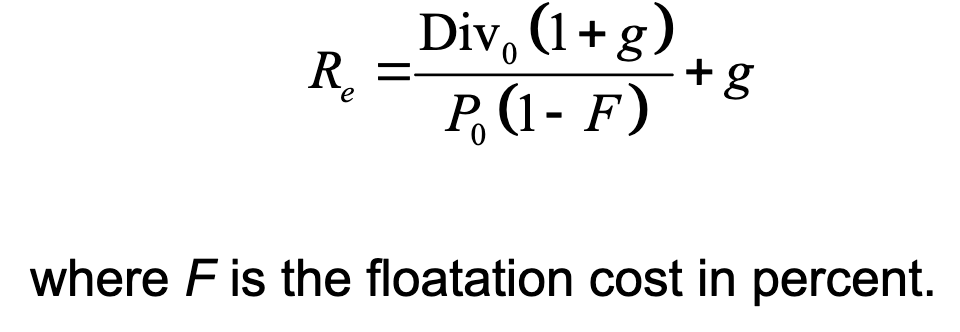
Equity Component
For newly issued common stock, the price must be adjusted for floatation cost (commission paid to investment banker) as shown in Equation 11.7 below:
where f is floatation cost in %
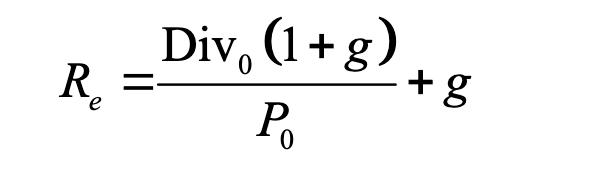
Depending on the availability of data, either of the two models, or both, can be used to estimate Re. (close answers)
Retained earnings does have a cost, i.e. the opportunity cost for the shareholders not being able to invest the money themselves.
The cost of retained earnings can be calculated by using either of the above two approaches, without including floatation cost.
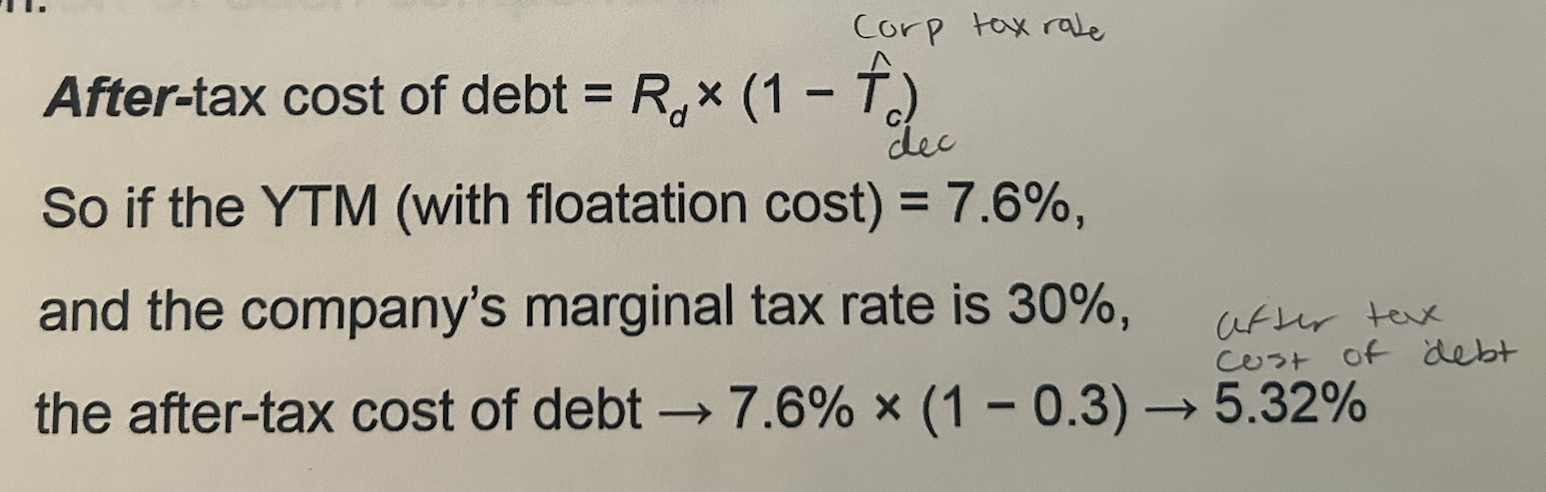
Also, since interest expenses are tax deductible, the cost of debt, must be adjusted for taxes, as shown below, prior to including it in the WACC calculation:
To calculate the WACC of a firm, each component’s cost is multiplied by its proportion in the capital mix and then summed up.
There are two ways to determine the proportion or weights of each capital component, using BLANK
book value or using market values
• Book value weights can be determined by BLANK.
• These weights, however, do not indicate the current proportion of each component.
taking the balance sheet values for debt, preferred stock, and common stock, adding them up, and dividing each by the total
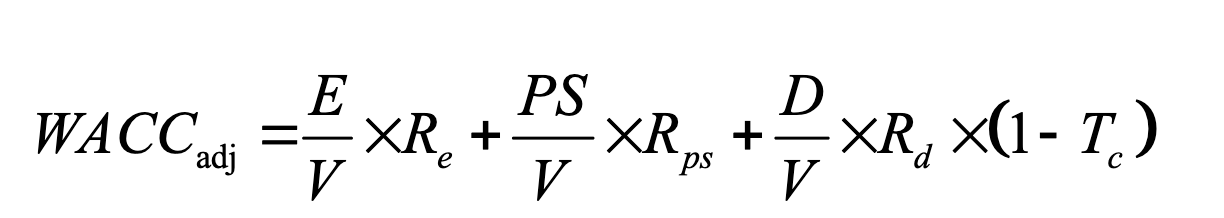
Adjusted Weighted Average Cost of Capital
Equation 11.9 can be used to combine all the weights and component costs into a single average cost which can be used as the firm’s discount or hurdle rate:
(BLANK) weights are determined by taking the current market prices of the firm’s outstanding securities and multiplying them by the number outstanding, to get the total value; and then dividing each by the total market value to get the proportion or weight of each
Market value;
(If possible, market value weights should be used since they are a better representation of a company’s current capital structure, which would be relevant for raising new capital.)
Once a firm’s (BLANK) has been determined, it can be used either as the discount rate to calculate the NPV of the project’s expected cash flow or as the hurdle rate which must be exceeded by the project’s IRR.
WACC
project’s NPV
Using the WACC for evaluating projects assumes that the project is of average risk.
If projects have varying risk levels, using the same discount rate could lead to (BLANK) decisions.
incorrect
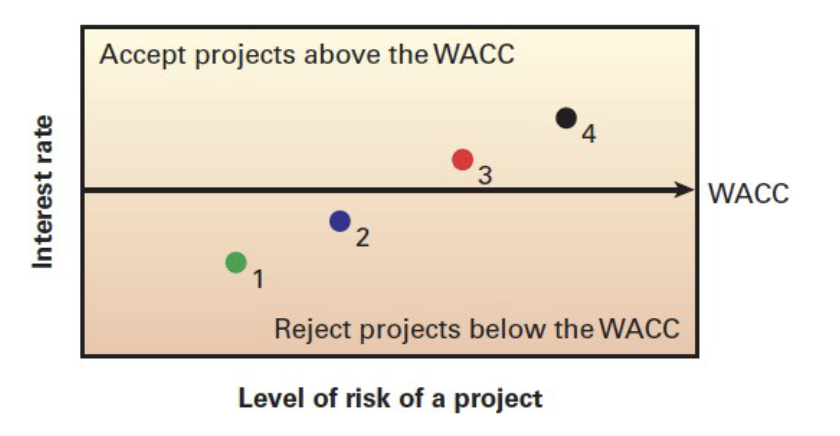
REVIEW:
• Four projects, whose IRRs range from 8% to 11%, but the risk levels also go from low → moderate → high → very high
• With a WACC of 9.5%, only Projects 3 and 4, with IRRs of 10% and 11% respectively would be accepted.
• However, Projects 1 and 2 could have been profitable lower risk projects that are being rejected in favor of higher risk projects, merely because the risk levels have not been adequately adjusted for. So this way is WRONG; SELECT THE CORRECT VERSION
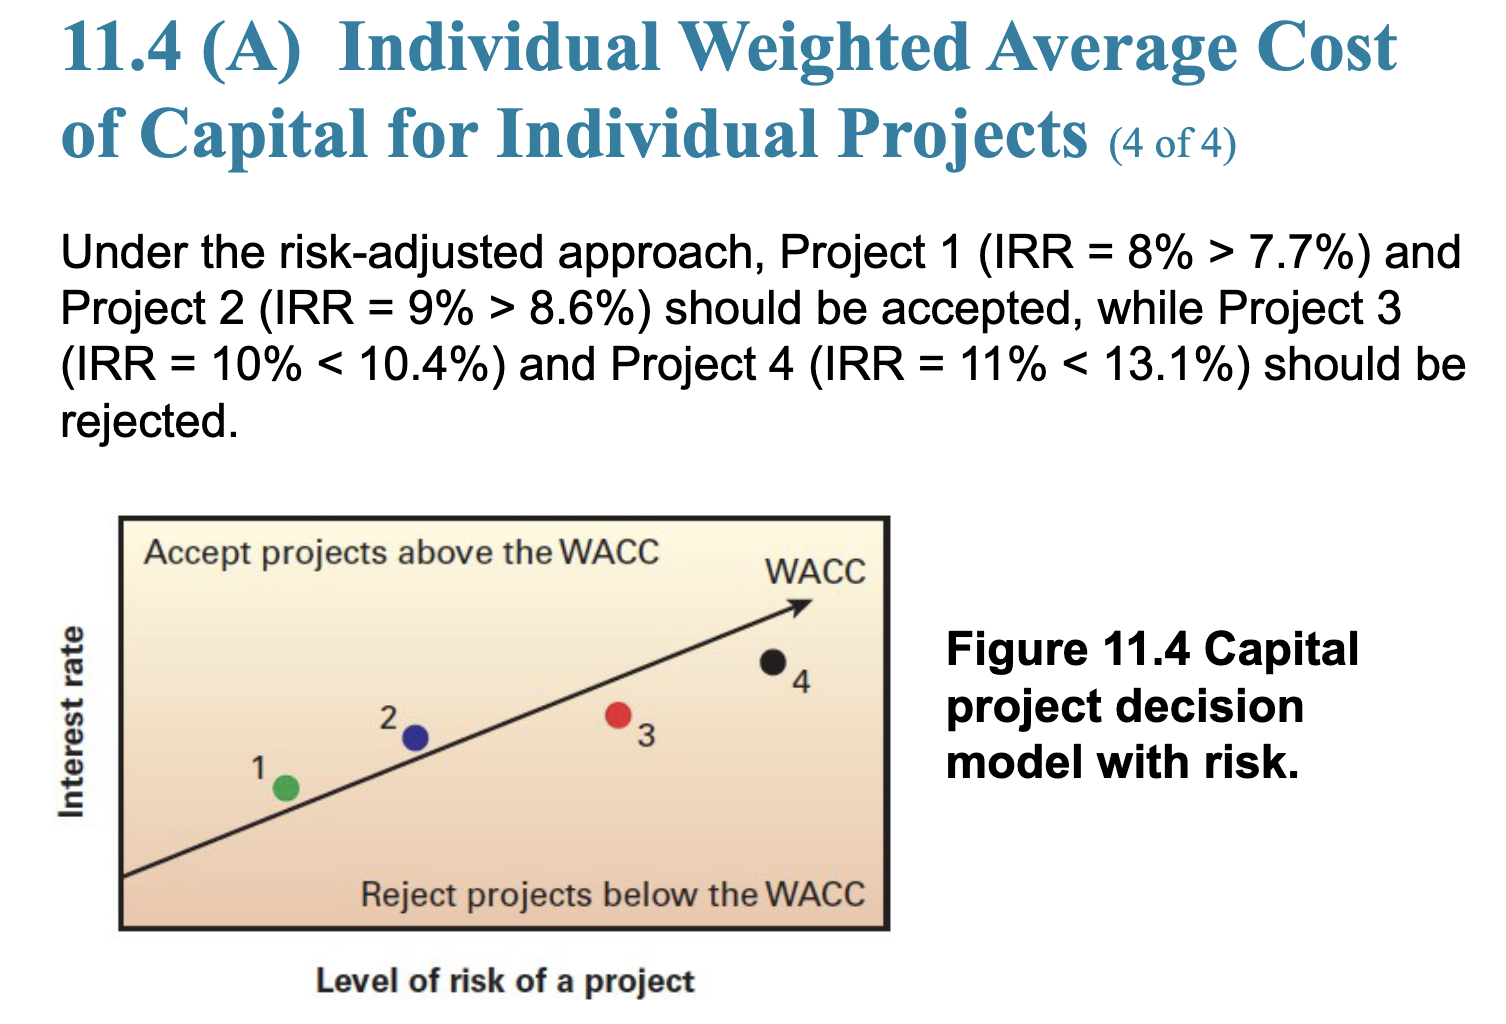
REVIEW Individual Weighted Average Cost of Capital for Individual Projects
REVIEWED Individual Weighted Average Cost of Capital for Individual Projects
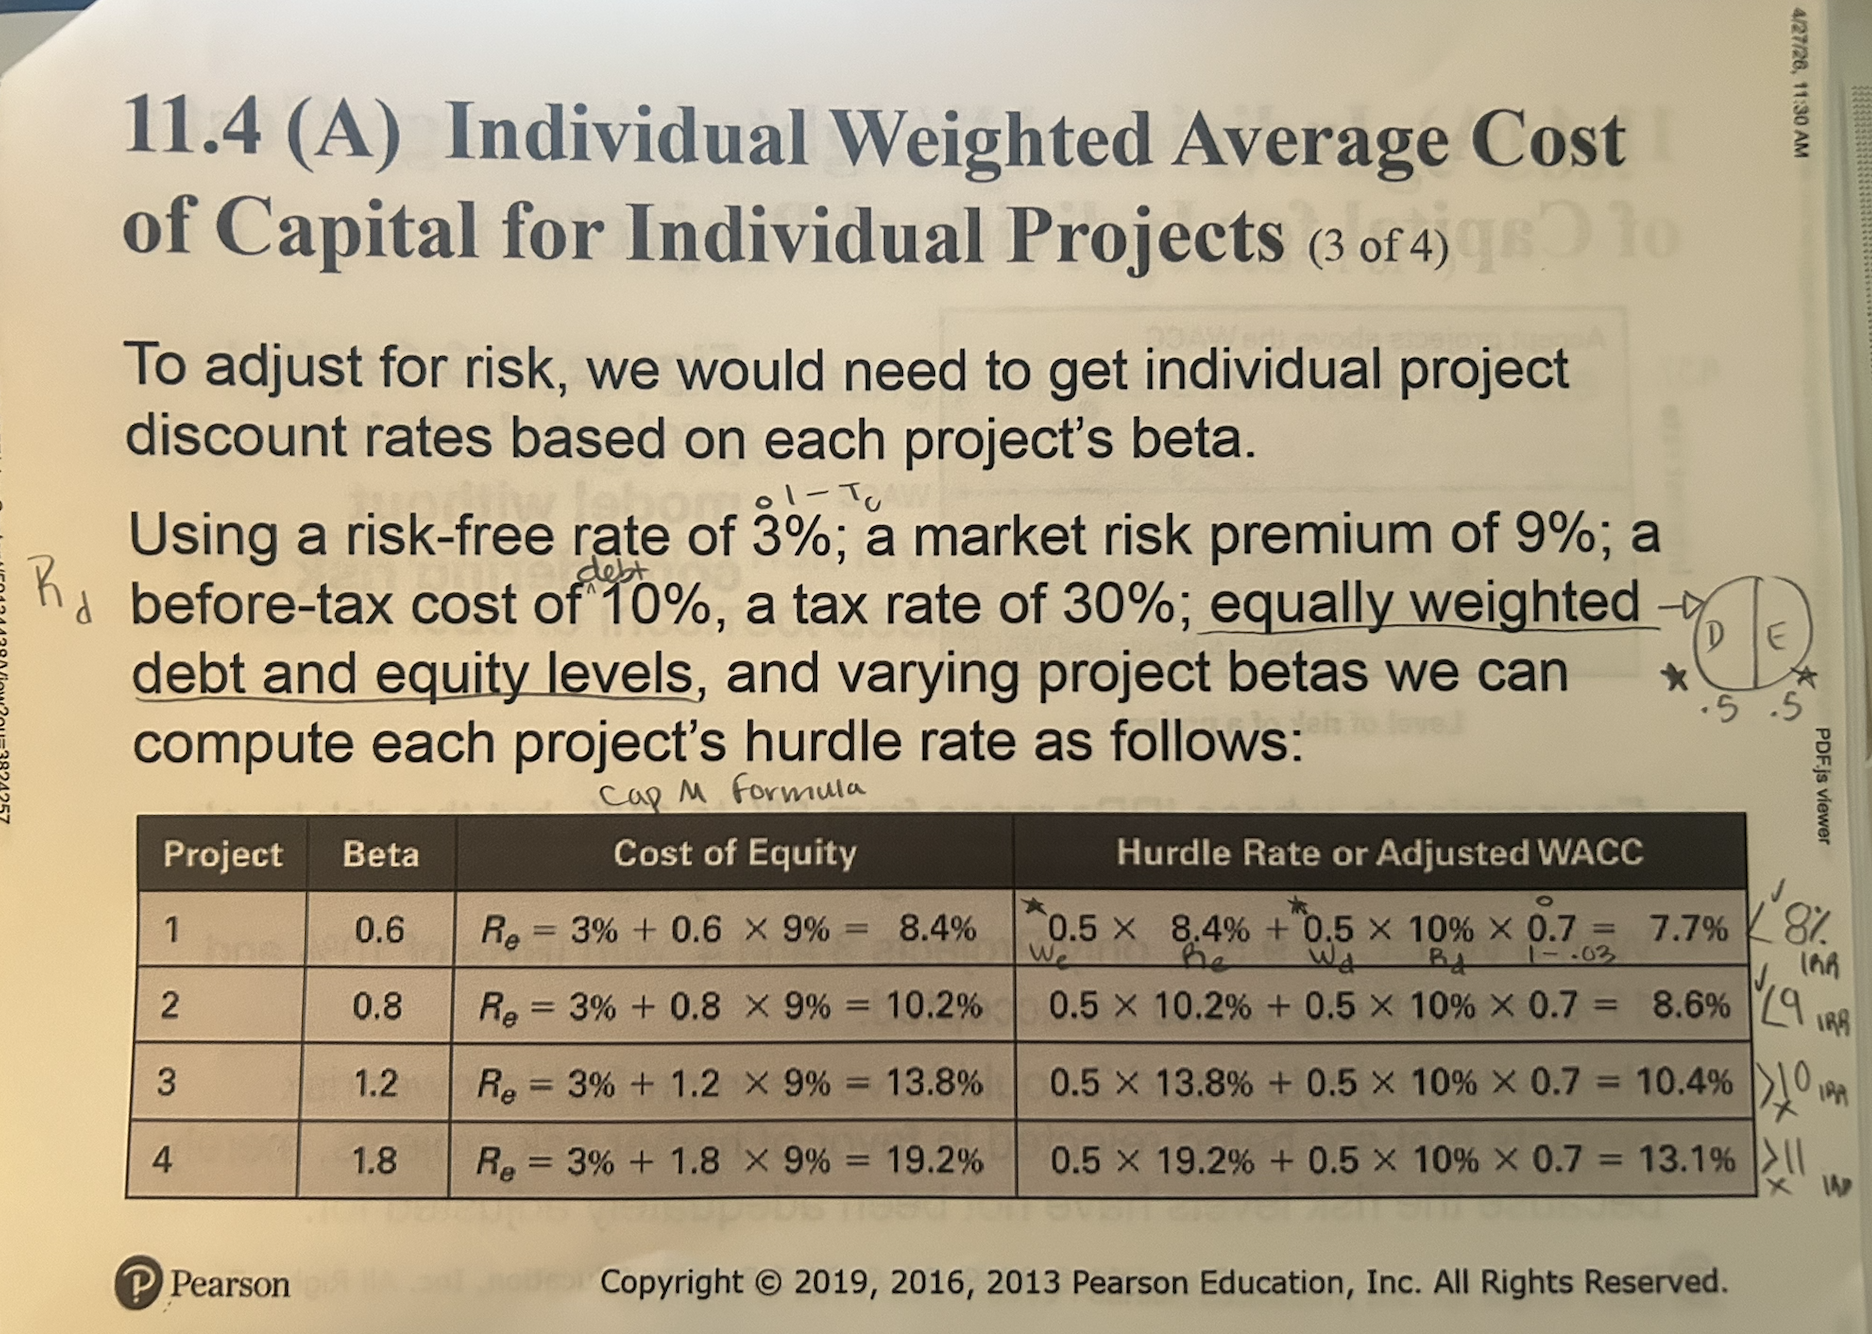
Selecting Appropriate Betas for Projects
It is important to adjust the discount rate used when evaluating projects of varying risk, based on their individual betas.
However, since project betas are not easily available, it is more of an art than a science.
There are two approaches generally used:
1. Pure play betas: i.e. matching the project with a company that has a similar single focus, and using that company’s beta.
2. Subjective modification of the company’s average beta: i.e. adjusting the beta up or down to reflect different levels of risk.
We note that as the price of the bond increases (proceeds from the sale) the lower is the cost of debt. This inverse relationship exists between price and the cost of debt …
because the future cash flows of the bond are fixed at issue, and thus buyers willing to pay more for the fixed stream of cash flows are lending money at a lower rate to the company.