GCSE: Science (Double Award): Biology: CCEA: Investigating osmosis (prescribed practical)
1/12
There's no tags or description
Looks like no tags are added yet.
Name | Mastery | Learn | Test | Matching | Spaced | Call with Kai |
|---|
No analytics yet
Send a link to your students to track their progress
13 Terms
Investigating osmosis (prescribed practical B5) potato in different solutions
Aim: to investigate osmosis by measuring the change in mass of plant tissue in solutions of different concentrations
Method for B5: Potato n different solutions
Method
1. Cut a length of potato using a cork borer
2. Cut 5, 2cm pieces of potato using a scalpel and ruler.
3. Use a measuring cylinder to measure 10ml of distilled water into a test tube. Repeat for 5%, 10%, 15% and 20% sucrose solutions.
4. Record the initial mass of each potato cylinder using a mass balance.
5. Place one potato cylinder in each test tube.
6. Leave for 40 minutes.
7. Remove each potato cylinder, gently dry with a paper towel and record the final mass of each cylinder
8. Calculate the change in mass of the potato for each solution and display the results as a line graph.
Risk assessment
Cork borer- cut skin, solution: cut on a tile
Glassware- broken glass, solution: keep beakers in the centre of the table
Variables
Independent- concentration of sucrose solution
Dependent- mass of potato
Control- size of potato, time left in solution, volume of solution
Conclusion
In conclusion, the concentration of sugar inside the potato was. 8.%. At this point in the
graph there is no movement of water by osmosis.
Above this concentration, water moved out the potato by osmosis and below this
concentration water moved into the potato by osmosis.
In pure water explanation:
Higher concentration of water in the solution
Water moves into the potato
Potato gained mass
Potato cells are turgid
Same concentration as potato explanation:
Equal concentration
No net movement of water
Potato mass is constant
In concentrated salt/ sugar solution explanation:
Higher concentration of water in potato
Water moves out of potato
Potato loses mass
Potato cells are are plasmolysed
Where does the water move?
Water moves to where there is less water: wants to get a balance (No net movement)
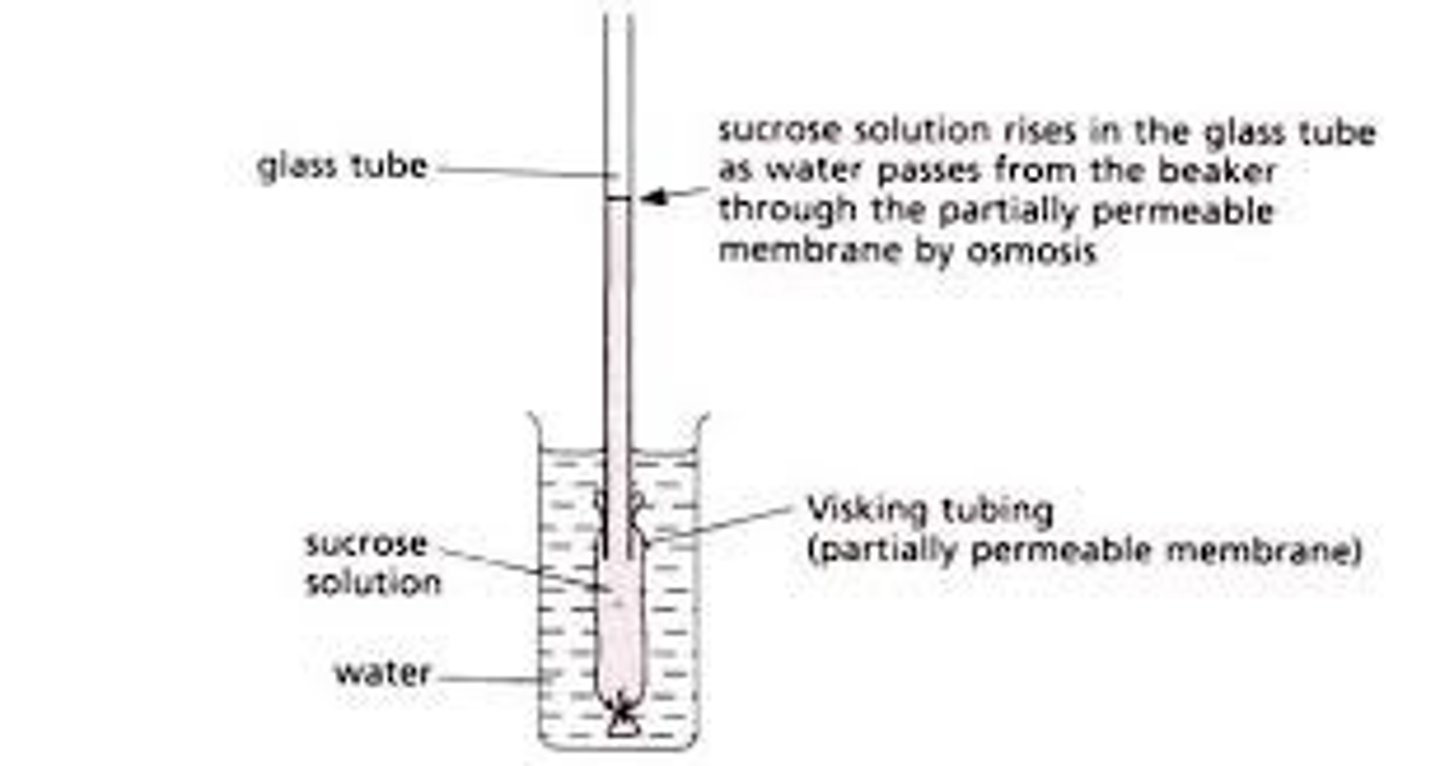
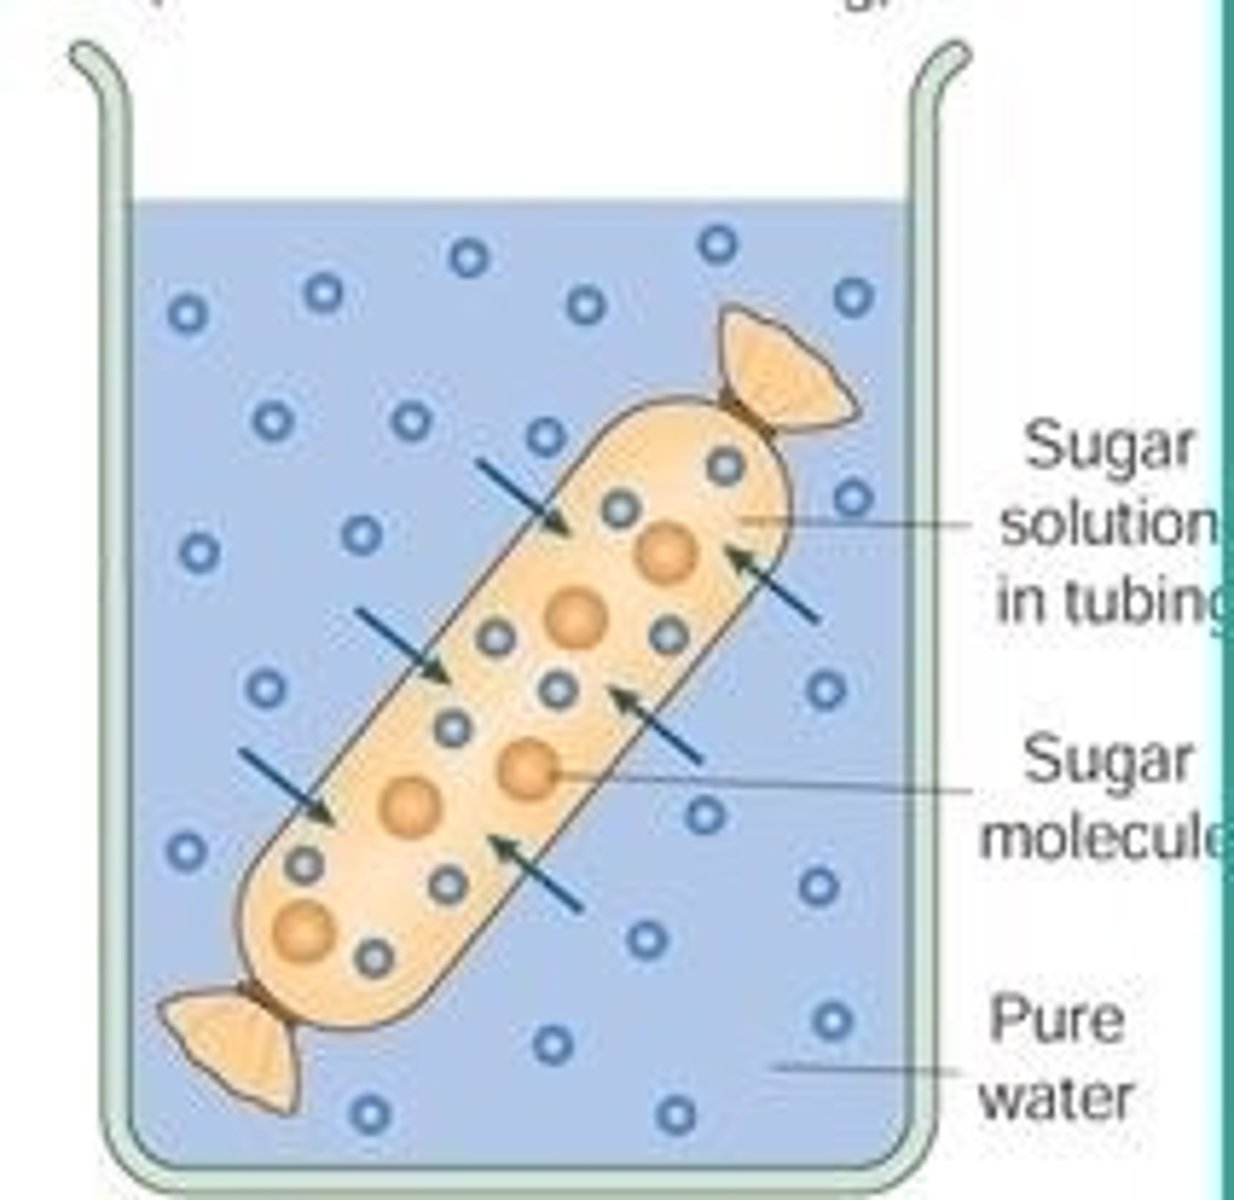
Investigating osmosis using visking tubing (prescribed practical B5)
Visken tubing a selectively permeable similar to a cell membrane. It can therefore be used to model the movement of substances into and out of a cell.
Method (visking tubing)
Method:
1. Measure 100ml of distilled water into a 250ml beaker and label it distilled water.
2. Repeat with each of the 3 known sucrose solutions.
3. Cut 4 x 20cm lengths of Visking tubing. Tightly tie one end of each.
4. Add the unknown sucrose solution (X) to the 4 Visking tubes using a fresh dropper until the filled portion is about 6cm long and securely tie the ends.
5. Cut off any excess visking tubing
6. Use the balance to record the initial mass of each visking tubing then place it into the correct solution for an hour
7. Remove the visking tubing, dry it gently with a paper towel
8. Use the balance to re weigh each of the visking tubes. Record results.
Conclusion for visking tubing experiment
The concentration of the unknown solution inside of the visking tubing was 7.5%. At this point on the graph. The percentage change in mass is zero, there is no movement of water by osmosis.
Visking tubing experiment results
If there is a higher concentration of water in the solution. (Dilute)
Water moves into the visking tubing
Visking tubing gains mass and is turgid
If there is a higher concentration of water in visking tubing (solution is concentrated)
Water moves out of the visking tubing
Visking tubing loses mass and is plasmolysed