4/10 - Functional Diversity: Body Size & Life History Strategies
1/6
There's no tags or description
Looks like no tags are added yet.
Name | Mastery | Learn | Test | Matching | Spaced | Call with Kai |
|---|
No analytics yet
Send a link to your students to track their progress
7 Terms
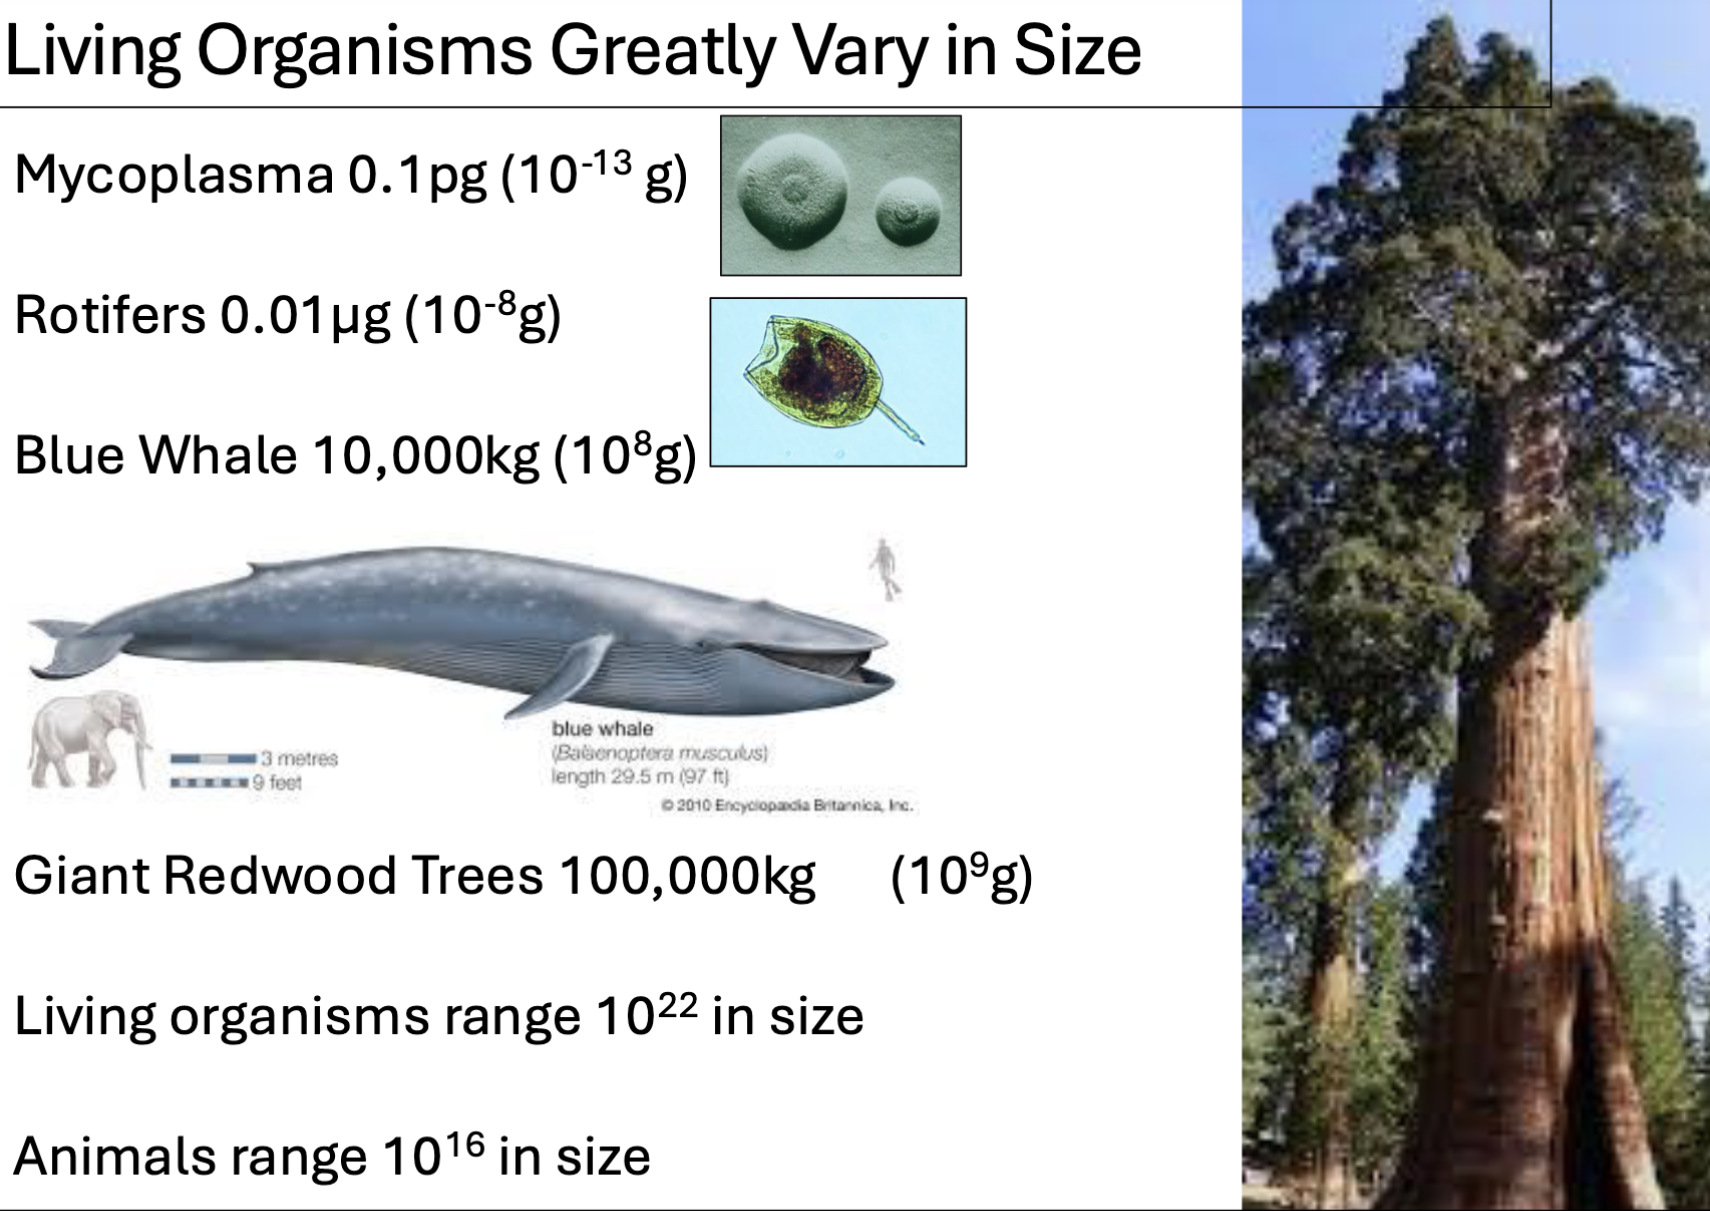
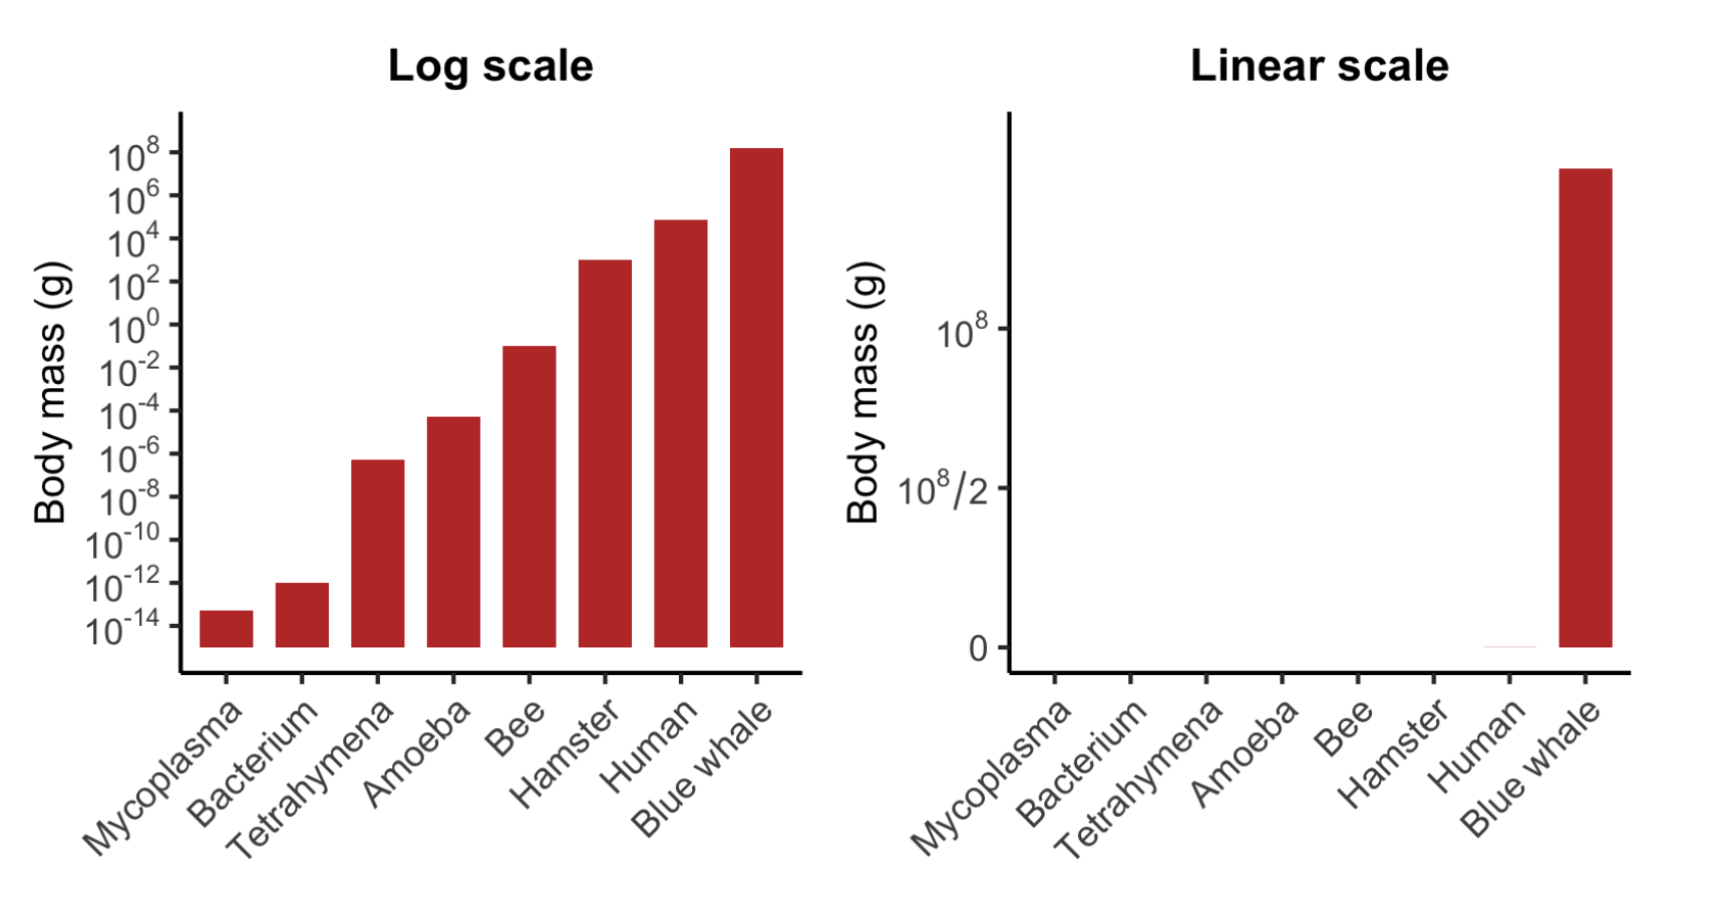
Graphing Large range of Sizes: Logarithmic(Log) Scale
- way of plotting #’s where each step represents a multiplication instead of addition(linear scale)
EX: 1 → 10 → 100 → 1000 (multiplying by 10)
graph across large range of sizes,
exponential growth
compare rates of change
Scaling Relationships
Surface Area (S) = L2
length x width
Volume (V) = L3
length x width x height
Mass (M) = L3
proportional to V (assuming constant Density)
Key Concepts
- as an organism get bigger…
V or M increases faster than SA
L3 grows faster than L2
smaller SA:V
greater V:SA
Small organisms
greater SA:V
lose heat/water quickly
Large organisms
smaller SA:V
retain heat better
Counter Availing Forces (Air Resistance): Gravity & Friction
- because M increases faster than SA, larger animals experience less air resistance relative to their weight, fall faster, & suffer greater impact, while small animals are slowed by drag & survive falls
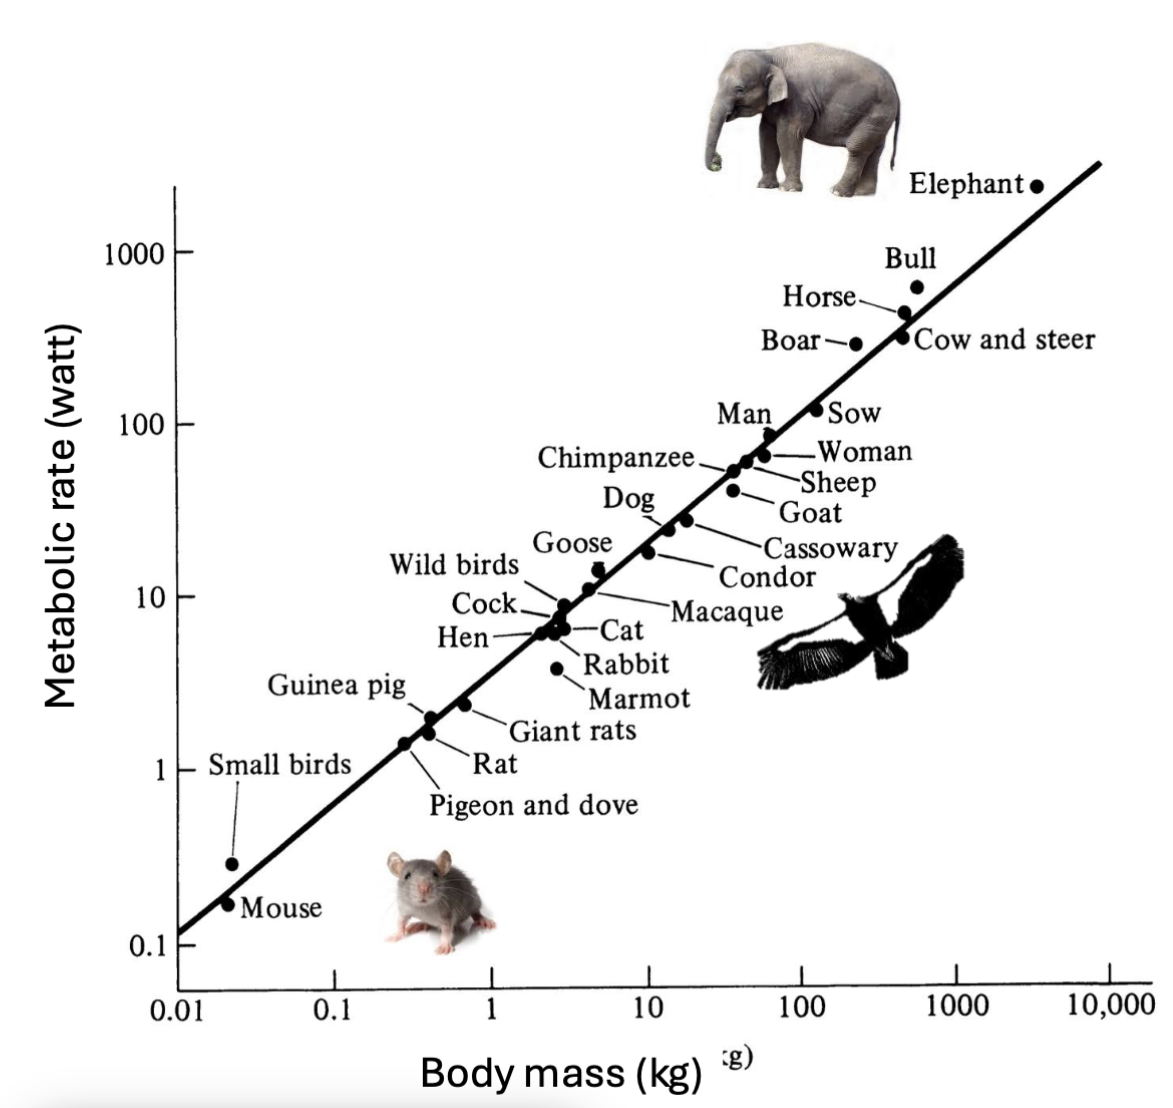
Mouse to Elephant Curve
- describes how biological traits scale w/ body size
smaller animals
high metabolism
fast heart rate
short lifespan
larger animals
slower metabolism
slow heart rate
long lifespan
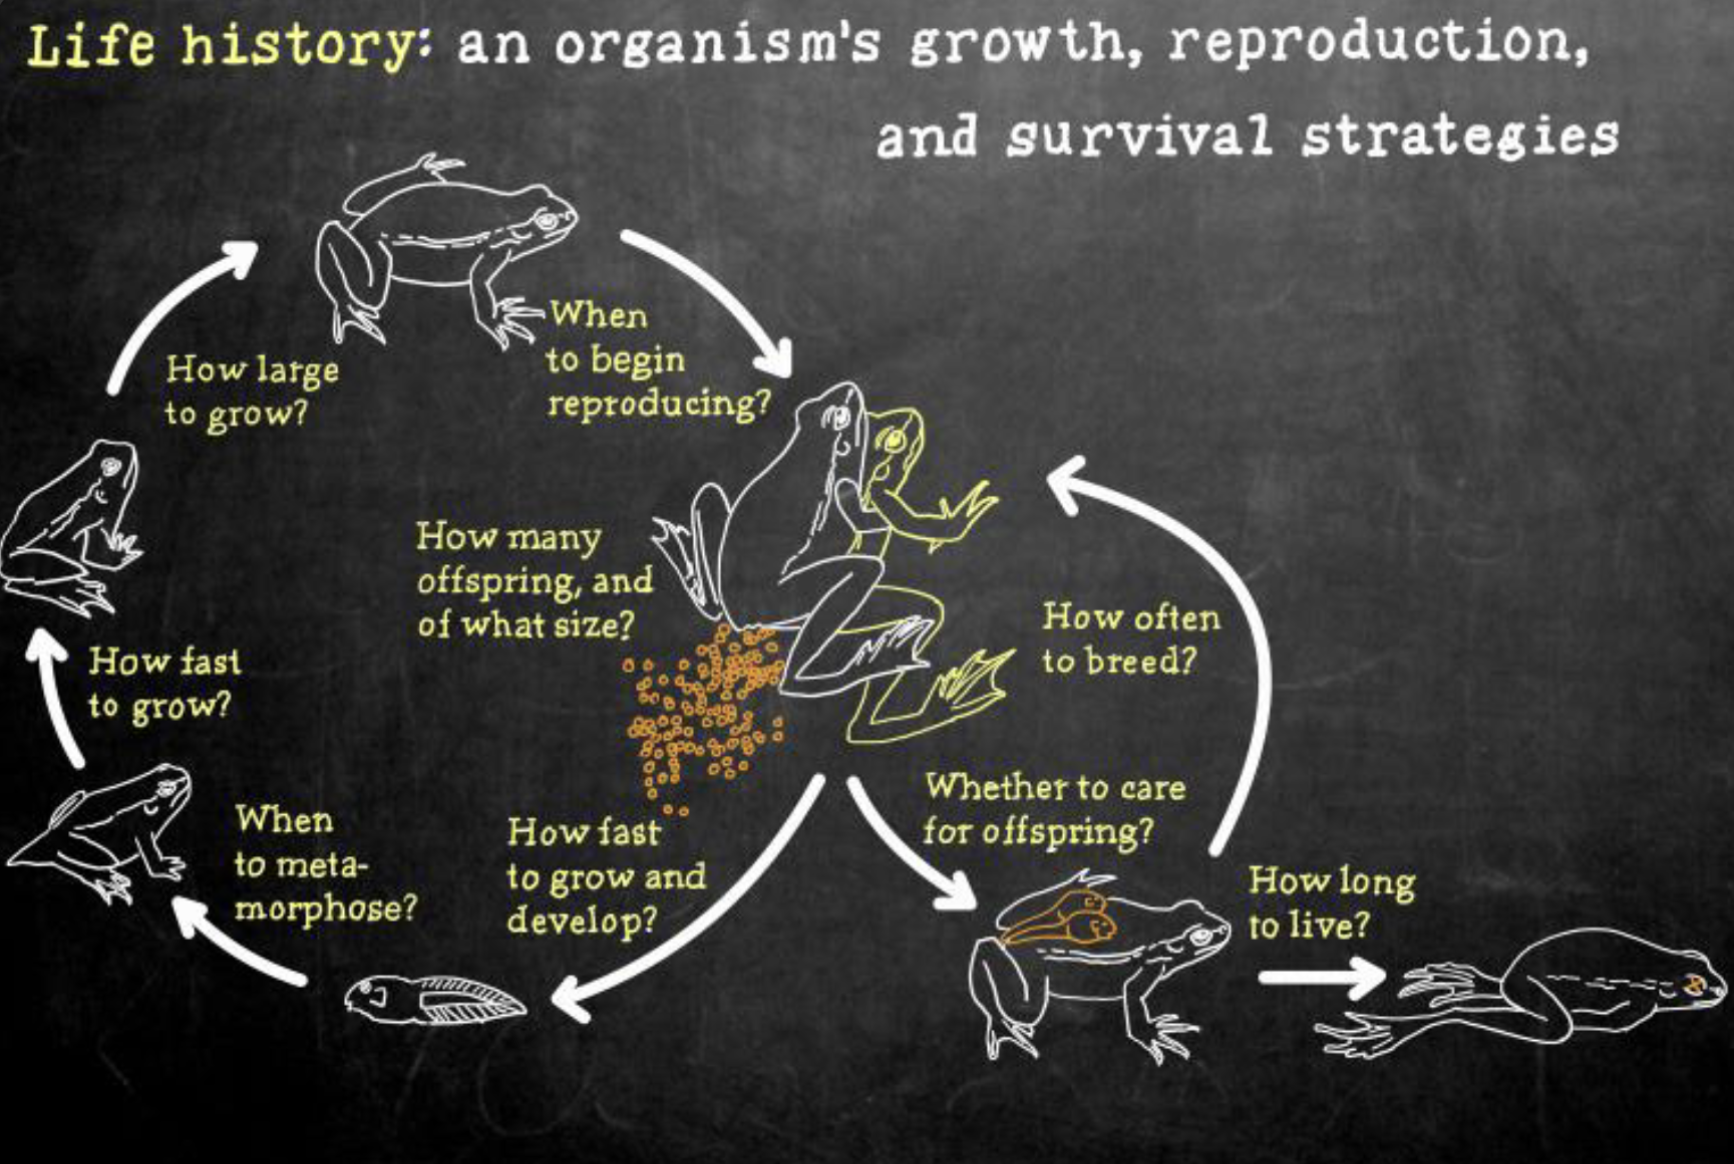
Life History
- an organism’s growth, reproduction, & survival strategies
Life History: How often to Breed?: Semelparity
- reproducing once in a lifetime & then dying
many offspring at once
little to no parental care
shorter lifespan
tradeoff: use all resources to reproduce NOW; leave nothing for survival (favored when survival after reproduction is unlikely, unpredictable environment)
Life History: How often to Breed?: Iteroparity
- reproducing multiple times in a lifetime
fewer offspring at a time
more parental care
longer life span
EX: humans, elephants, birds
tradeoff: save resources to survive & reproduce again (environment is stable)