Medical Statistics 1
1/131
There's no tags or description
Looks like no tags are added yet.
Name | Mastery | Learn | Test | Matching | Spaced | Call with Kai |
|---|
No analytics yet
Send a link to your students to track their progress
132 Terms
How can we compare numerical values between 2 groups?
2 sample t-test (assumes normality) or Wilcoxon rank-sum test (non-parametric)
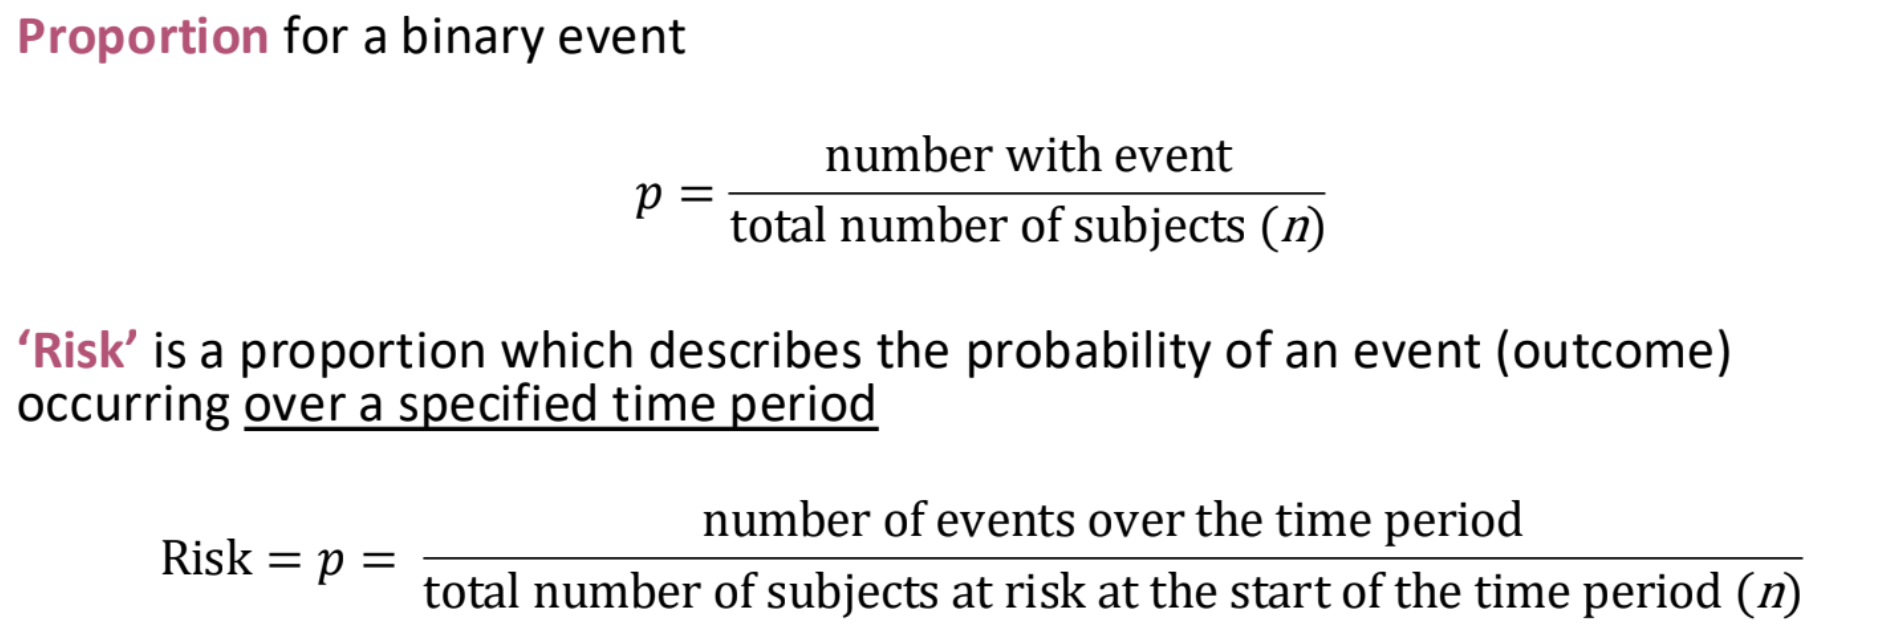
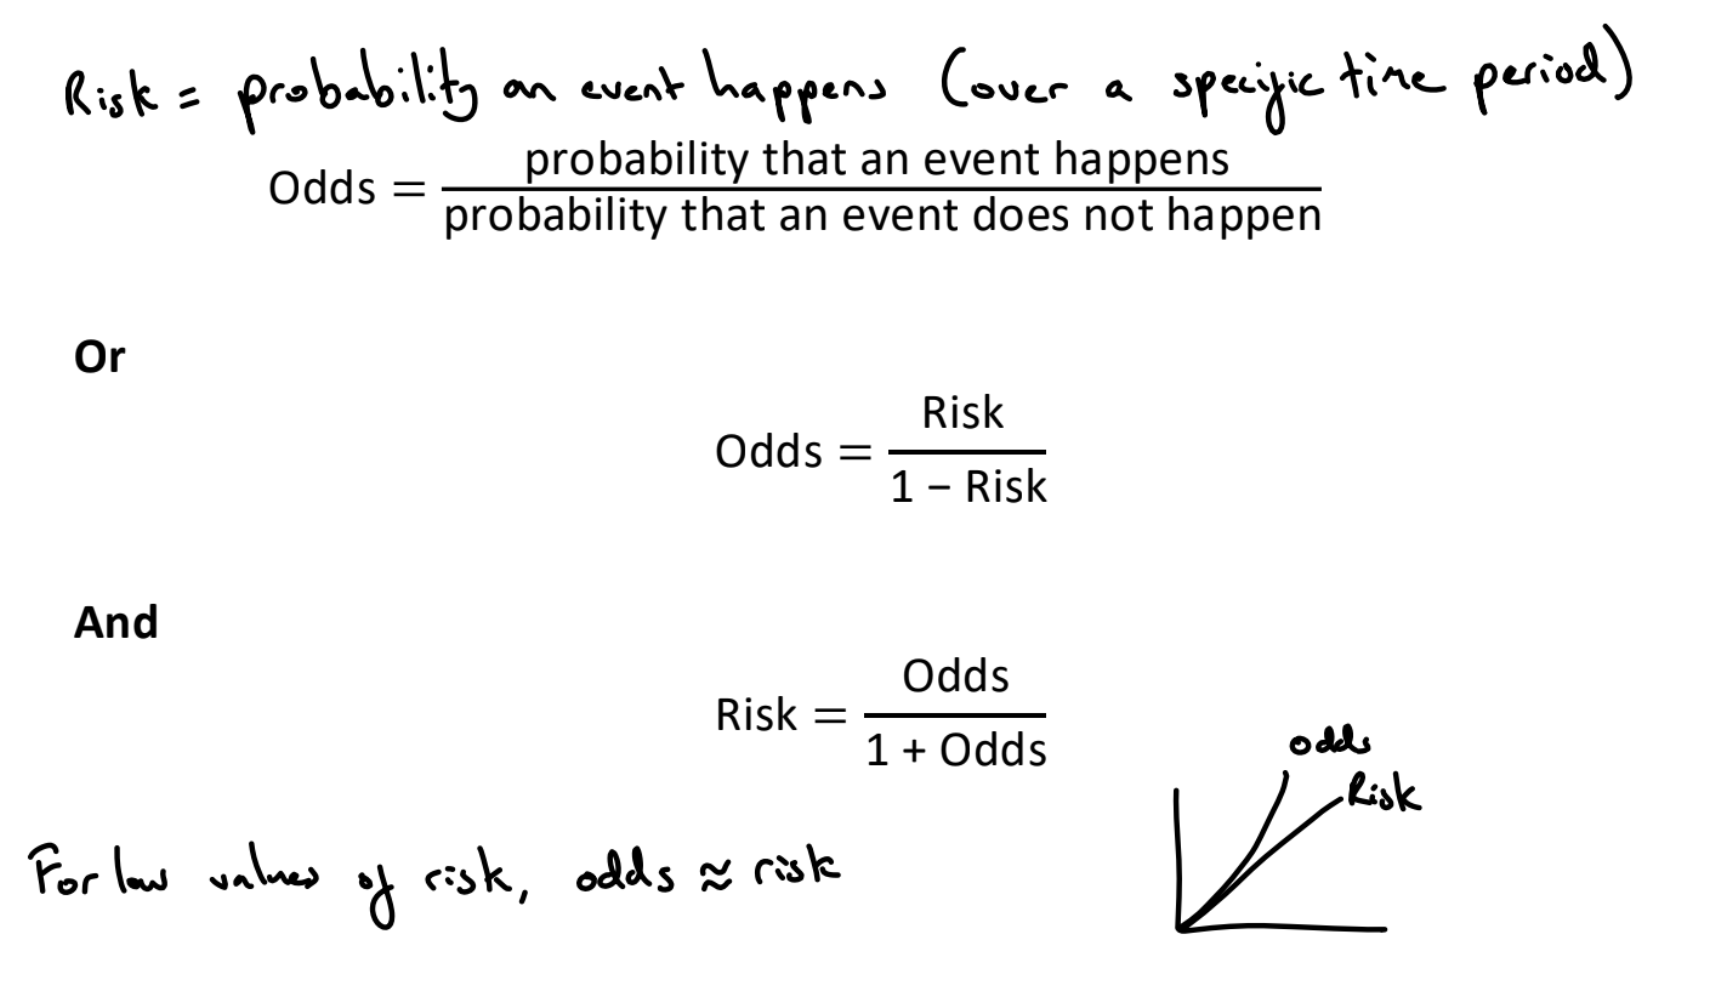
What is risk?
Probability of an event (over a specific time period)
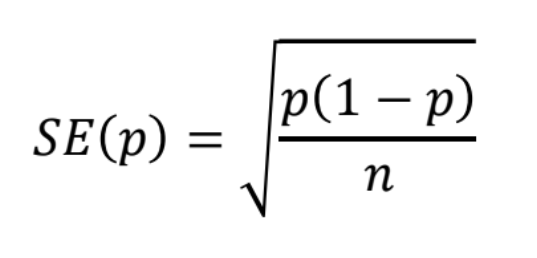
What is the standard deviation of risk?
What is prevalence?
The proportion of subjects with a particular outcome in a population at a specific point in time. Contrast to cumulative incidence / risk which is the proportion of a population who newly experience the outcome within a specified time period.
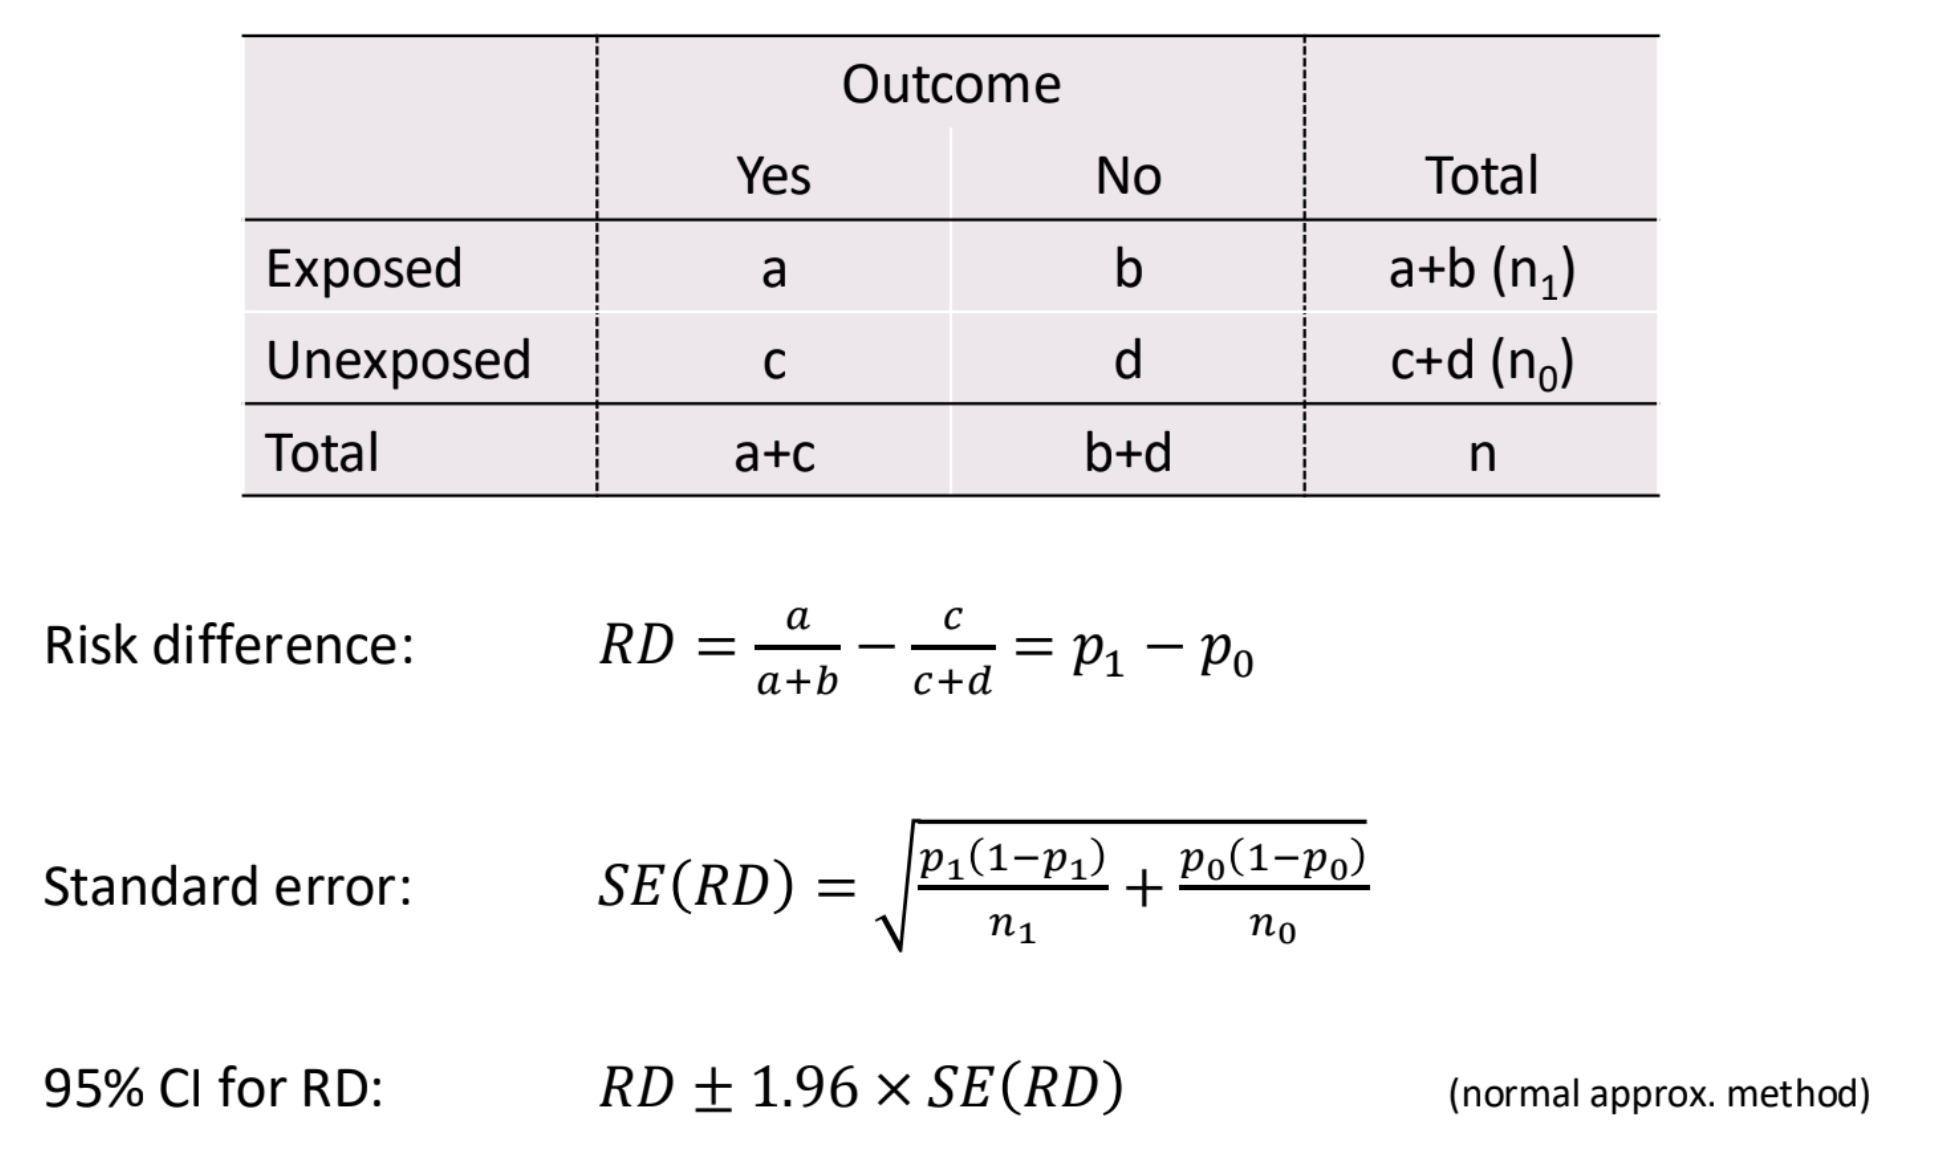
What is the risk difference?
(Absolute) risk difference = Risk in exposed - risk in unexposed
Significant if CI excludes 0
E.g. risk difference = 0.0241, risk of stroke in smokers is 2.4 percentage points more than risk in non smokers
What are the formulas for risk difference?
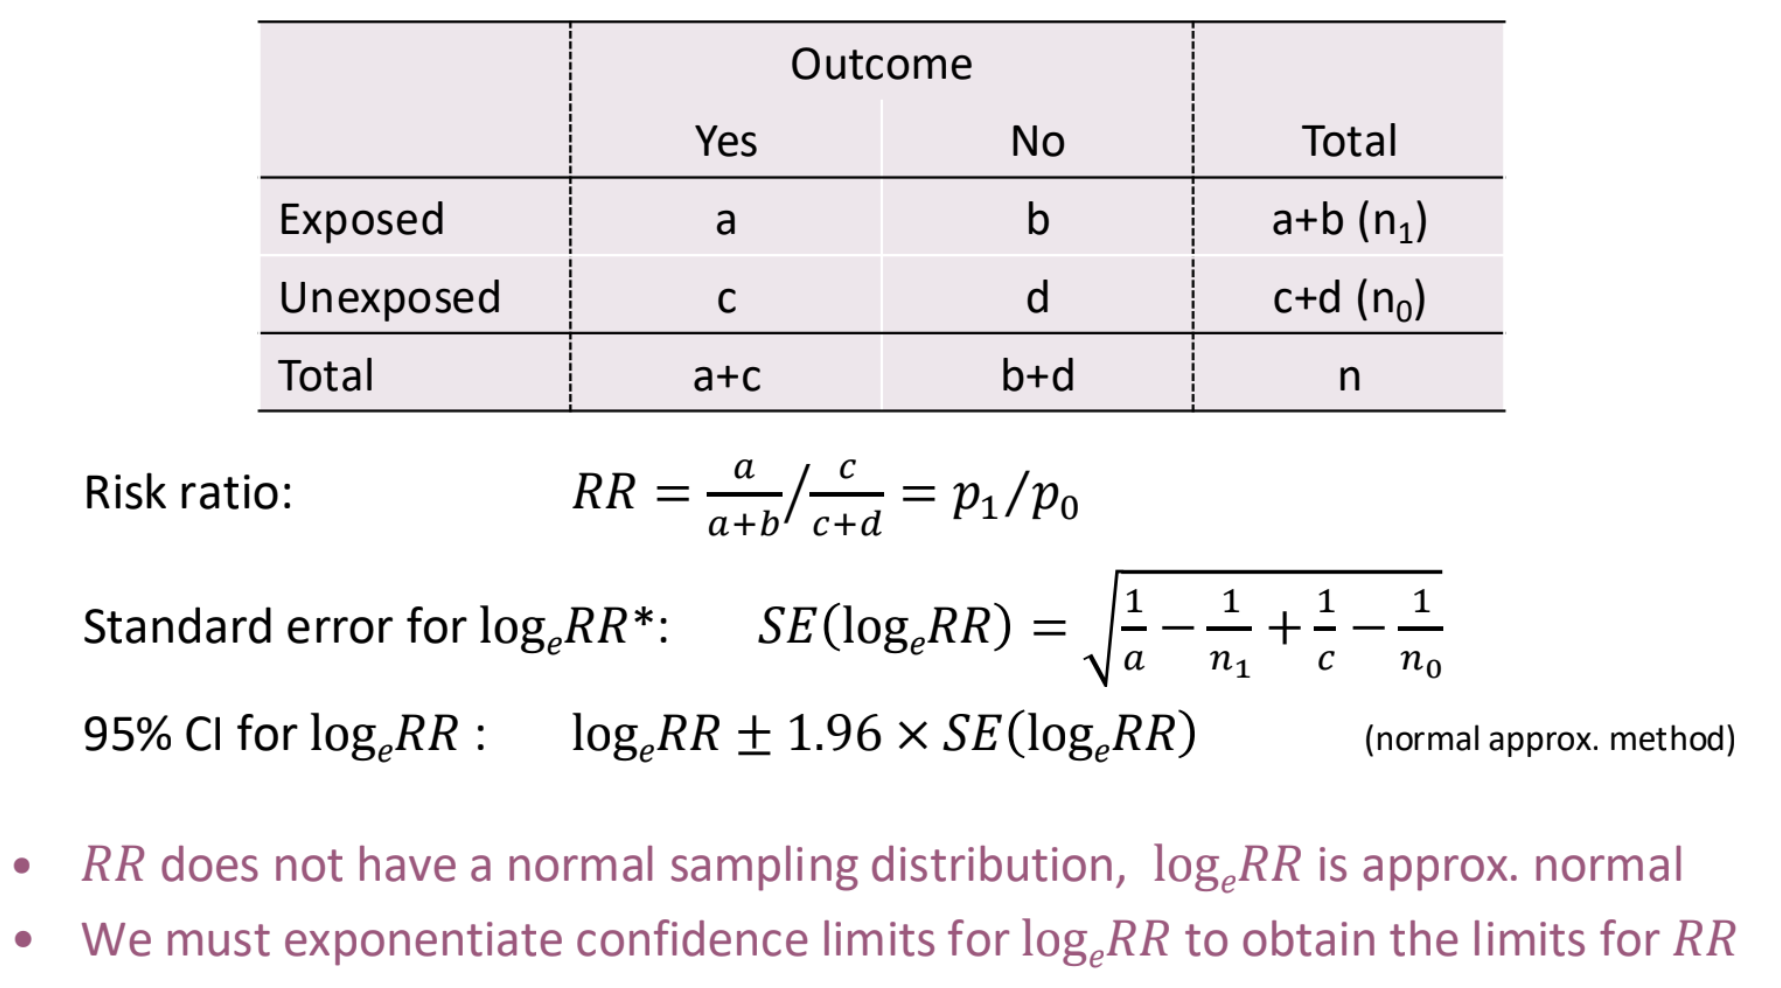
What is the risk ratio?
Risk ratio (or relative risk) = RR = risk in exposed / risk in unexposed
E.g. RR = 1.938, risk of stroke in smokers is 1.94 times the risk in non-smokers
Significant if CI excludes 1
The same relative risk ratio can represent many different risk differences. To assess the health impact, we also need to know the risk in one of the groups
What are the formulas for risk ratio?
What are odds?
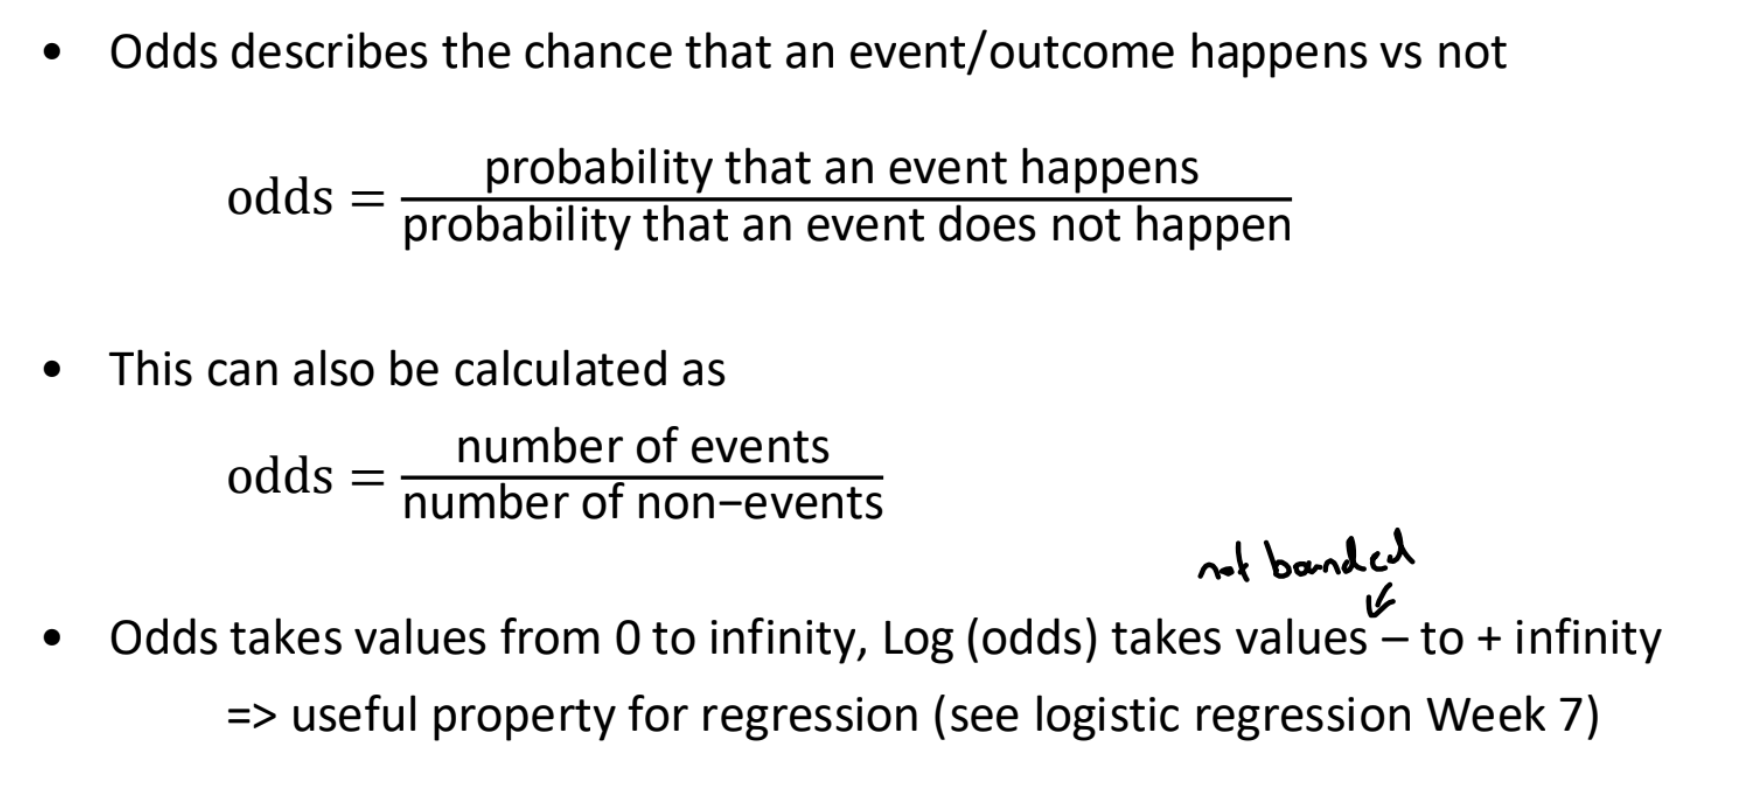
What is the relationship between risk and odds?
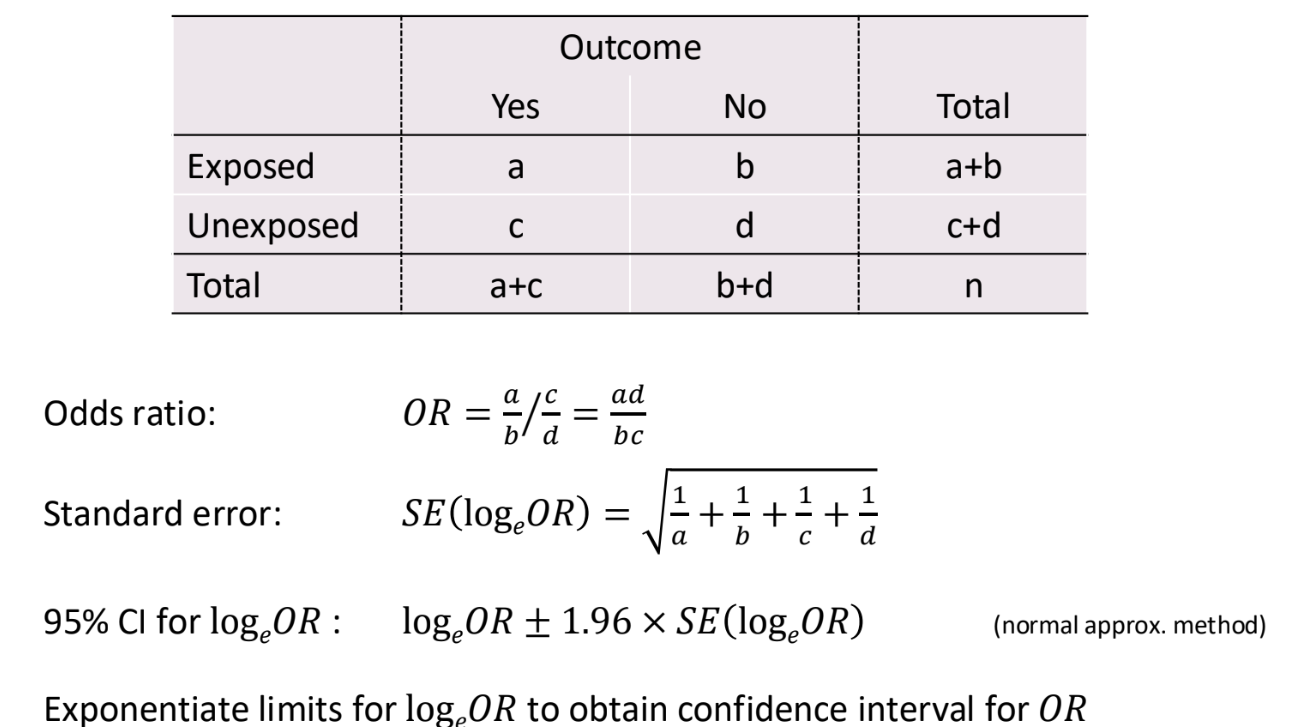
What is the odds ratio?
The ratio of odds in the two groups
OR = odds of exposed group / odds of unexposed group
Significant if CI excludes 1
E.g. odds ratio = 1.99, the odds of stroke for smokers is 1.99 times odds for non-smokers
What are the formulas for the odds ratio?
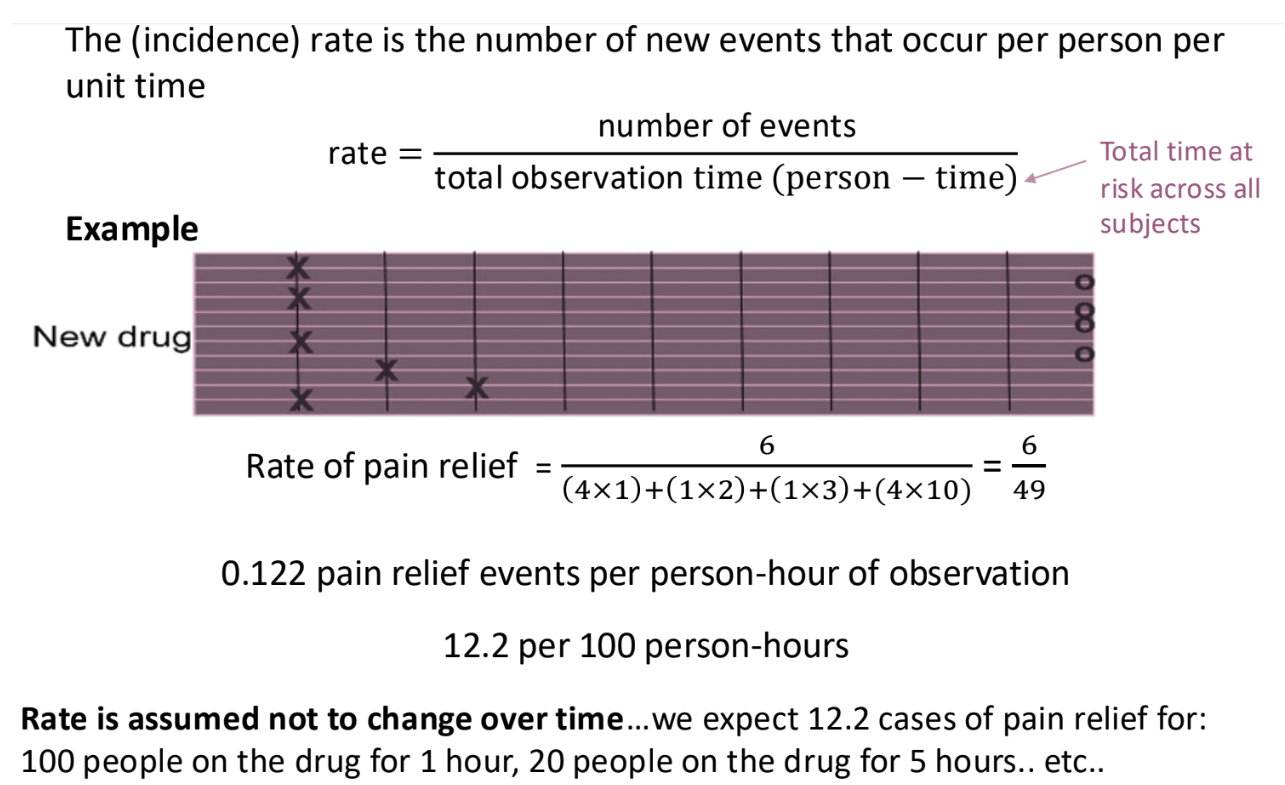
What are rates?
Rates = number of events / total time at risk
Useful for time to event studies
Allow us to analyse studies when participants are lost to follow up, which distorts risks and odds.
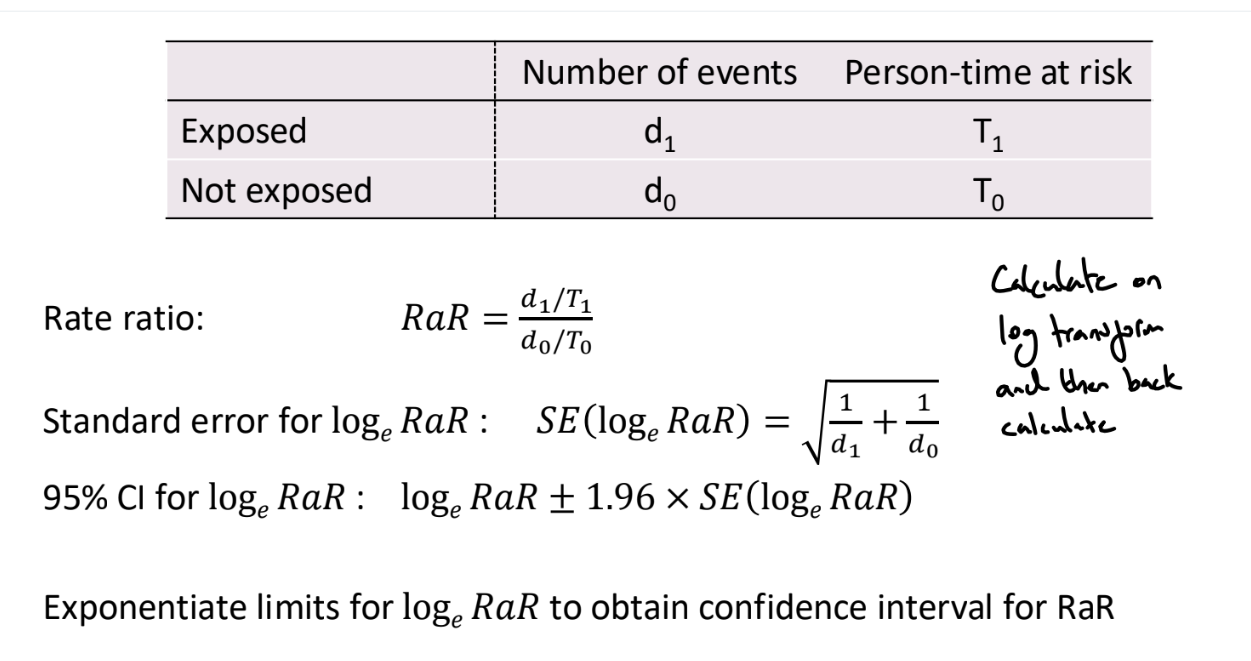
What is the rate ratio?
Rate ratio = RaR = rate of exposed group / rate of unexposed group
Significant if CI excludes 1
e.g. rate ratio = 1.73, the rate of sudden cardiac death is 1.73 times higher in people with a family history of SCD compared to people with no family history of SCD.
What are the formulas for the rate ratio?
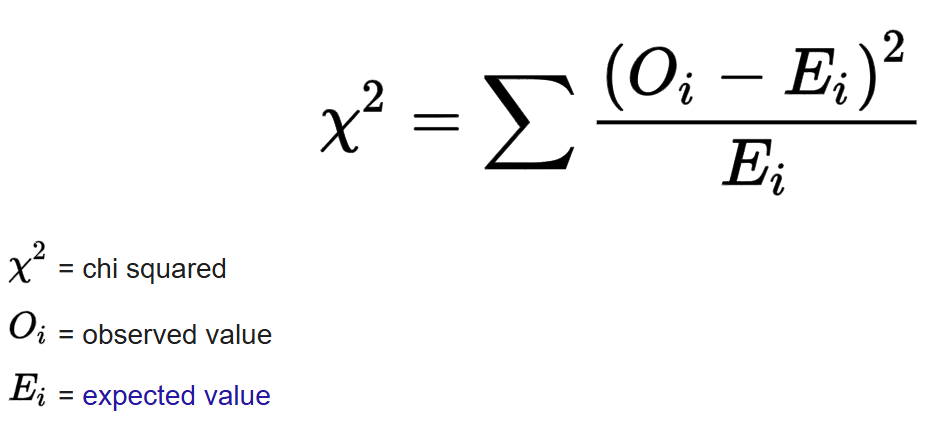
What is a chi-square test of independence?
Tests whether there is a statistically significant association between two categorical variables
If the variables are independent, the chi square statistic should follow a chi-square distribution with df = (rows - 1) * (columns - 1)
What are observational studies?
Studies where the investigator passively observes subjects without manipulation or intervention. The ‘exposure’ has been decided naturally or by other factors. These studies are prone to biases and confounding, making causal inference challenging.
Types of observational studies include cross-sectional, cohort and case-control studies
What are experimental studies?
In an experimental study, the researcher directly intervenes and decides which subjects receive the exposure or treatment.
Subjects are randomly assigned to one of several treatment groups (often Treatment and Control). Subjects are followed up over time and the outcomes of the groups are compared.
Contrary to observational studies, the exposure is controlled. This allows causal inference
What is bias?
Bias refers to errors in study design or analysis that result in an incorrect estimate of a quantity, for example, the association between exposures and outcomes.
Biases can be introduced when
identifying and recruiting subjects (selection bias)
collecting and recording information (information / observer bias)
analysing information (selection bias / confounding)
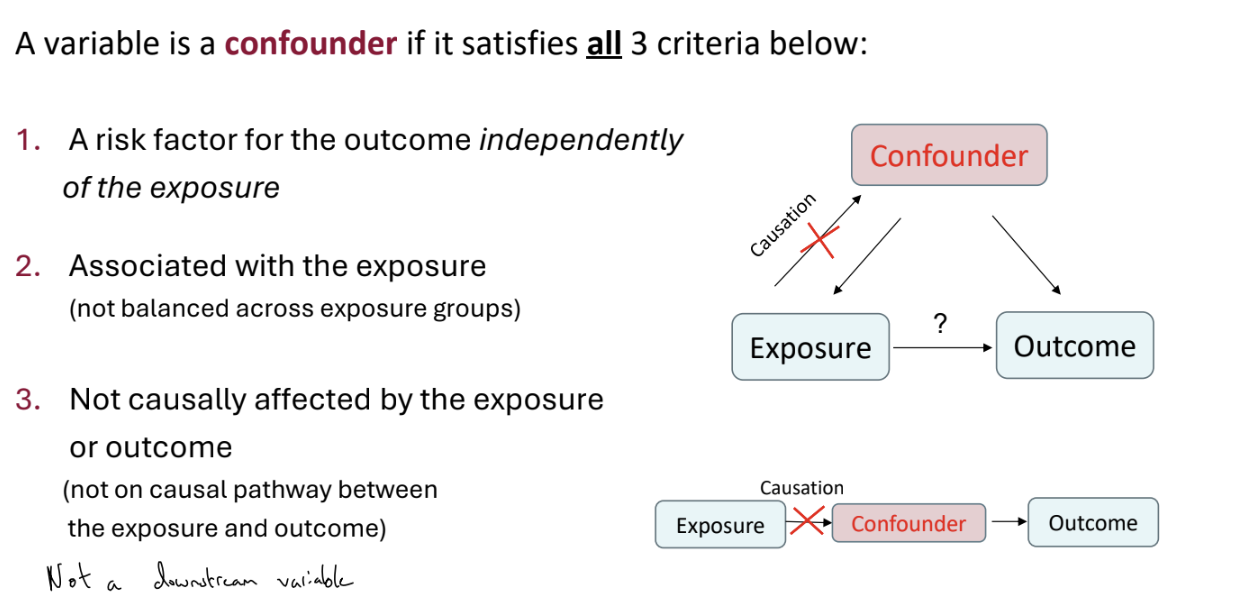
What is confounding?
Simply: a confounding variable is a factor that is related to both the exposure and the outcome of interest.
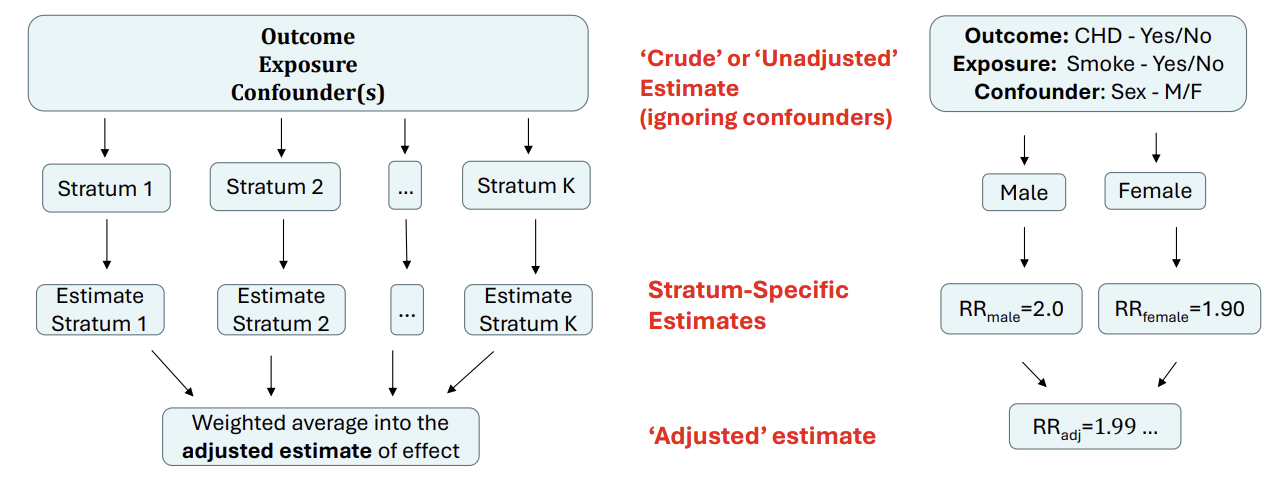
If we don’t control for the confounder (and so only measure the ‘crude’ or ‘unadjusted’ effect), our estimate of the association between exposure and outcome can be biased
How can we address confounding?
Confounding variables can be dealt with at the design or analysis stage of a study
Design
Matching in case-control studies
Randomisation in randomised clinical trials (the best option but not always feasible)
Restriction involves only recruiting individuals with specific levels of a confounding variable, but then cannot generalise findings to other groups
Analysis
Adjust in analysis using regression or stratified analysis. We need to consider confounding variables at the design stage to collect relevant information
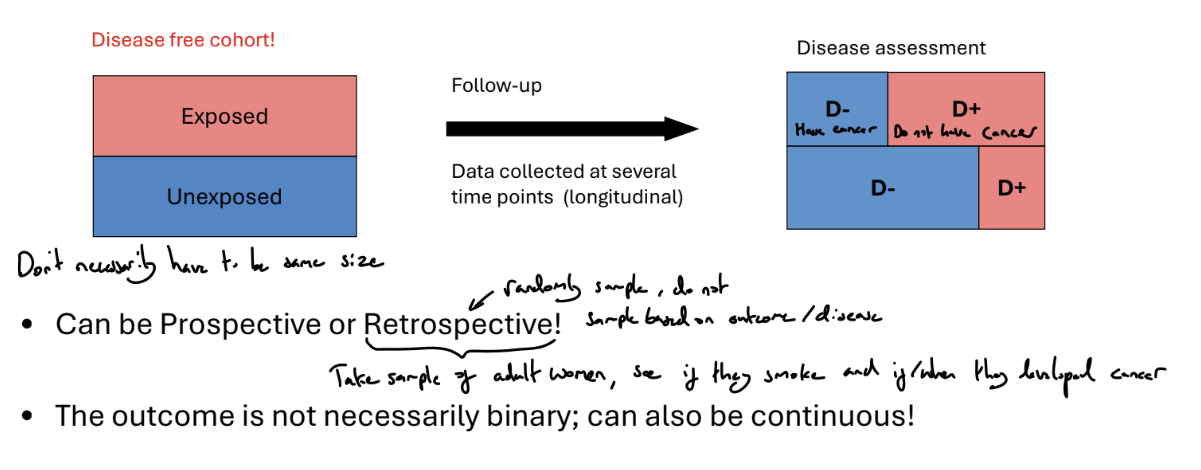
What is a cohort study?
Identify a suitable group of individuals who may share common characteristics. At the start, all patients must be event free
Fix an appropriate follow-up period and follow-up subjects over time.
At the end of the study period, we can compare exposed and unexposed groups, and investigate associations between risk factors and the outcome
What are the advantages of cohort studies?
Advantages
Can measure disease incidence, as we start from a disease-free cohort and follow up
Suitable for studying rare exposures as we can ensure we recruit subjects within uncommon exposures
Suitable for time-varying exposure, with prospective or well documented retrospective study
Multiple outcomes can be handled conveniently
Temporal relationships can be assessed, because the temporal sequence between the exposure and the outcome is clear.
What are the disadvantages of cohort studies?
Disadvantages
Can be time consuming and expensive
Not very suitable for an outcome that is rare or takes a long time to develop
May collect very few positive cases or none
Selection bias
The sample may not be representative of the population (e.g. heavy drinkers tends to refuse to participate)
Loss to follow-up can complicate the analysis
Information bias
Different quality of recorded information for exposed and unexposed groups (observer bias). A reviewer may interpret medical images differently depending on whether they know the subject had the exposure or not
Does not allow convenient analysis of multiple exposures (data are collected conditional on exposure status)
What types of outcome do we study?
Continuous, e.g. average daily blood pressure
Binary, e.g. in-hospital death (Yes/no)
Time to event, e.g. time to death or recovery
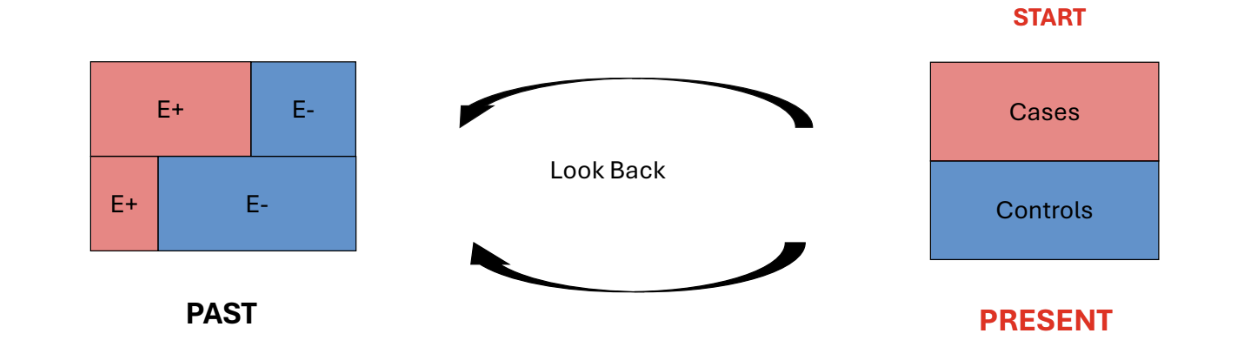
What is a case-control study?
A study used to assess the effect of past exposure / risk factors on current health / disease status - retrospective study design.
Identify a group of subjects with a particular disease / condition. These are called Cases.
Identify a group of subjects without the disease. These are called Controls. Can use matching on predefined characteristics to select controls, to address possible confounding
Look back in time to see which subjects in each group had the exposure(s) of interest
Compare the levels of exposure in Controls and Cases
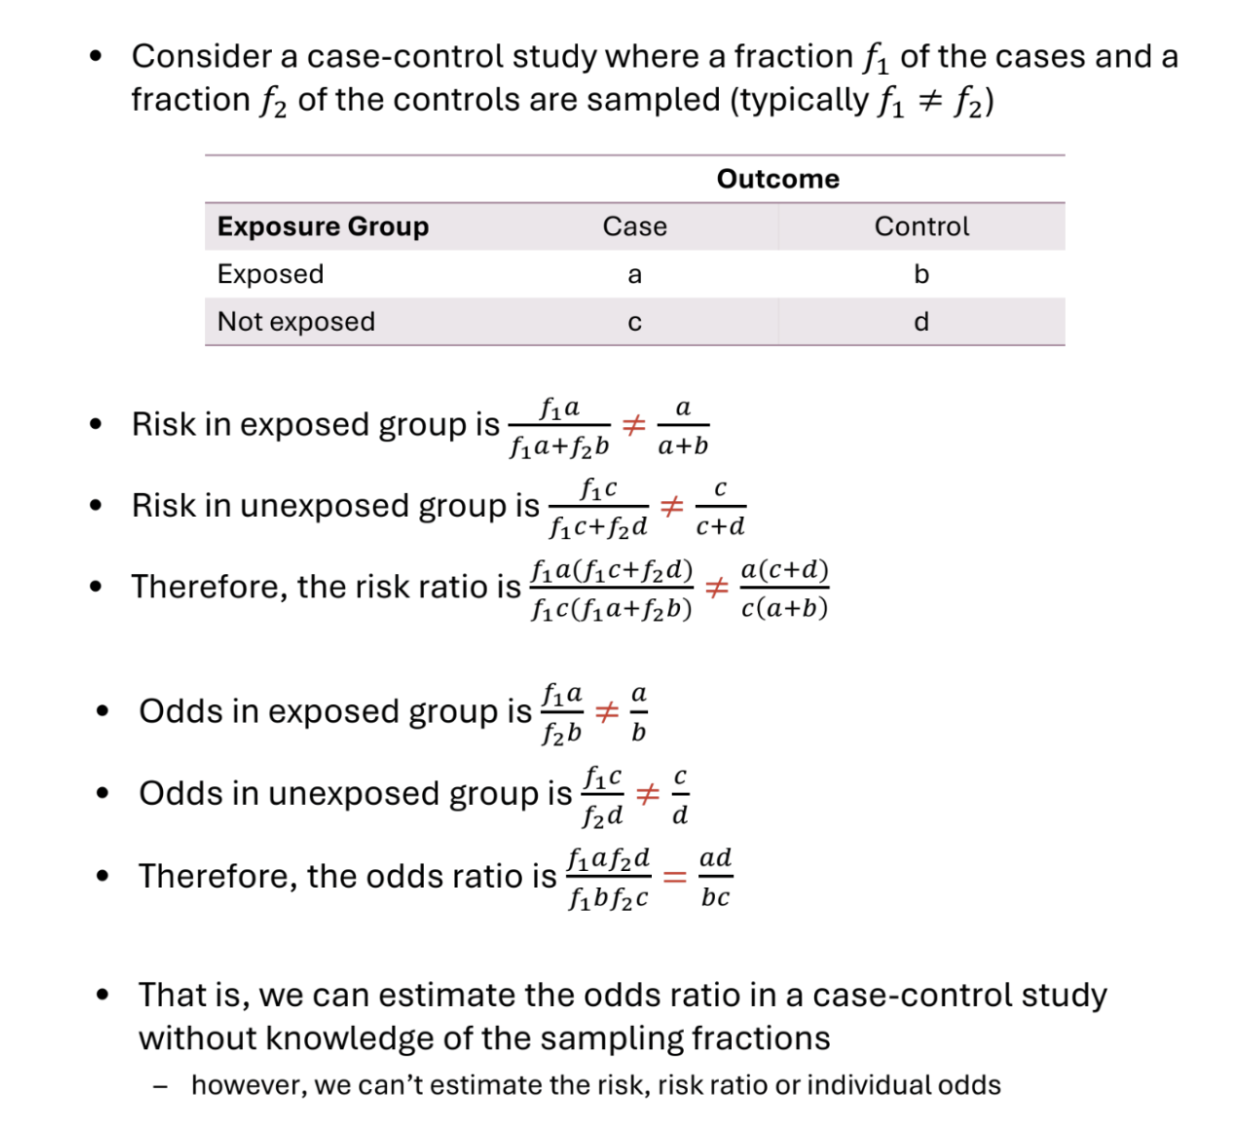
How should we analyse a case-control study?
The appropriate effect measure is the Odds Ratio
The ratio of the odds of the exposure in the diseased and non-diseased groups is the same as the ratio of the odds of the disease in the exposed and unexposed groups
The risk ratio is not appropriate because we elected units based on their outcome
Neither risk or (baseline) odds alone are appropriate
How should we select cases for a case-control study?
Cases
Should be selected based on a definition that is clear and specific but not overly restrictive (otherwise may not obtain enough cases)
Generally prefer newly diagnosed cases because they tend to remember exposures prior to contracting the disease more accurately
Usually select as many cases as we can, especially if the disease / condition is rare (if disease is common, may limit sample size due to cost)
How should we select controls for a case-control study?
Controls
Should be representative of the source population and selected independently of the exposure.
Usually, 1 control is selected per case, but if the disease is rare we select more than one control.
This increases the efficiency of our estimators. However, efficiency gains with more controls is not proportion and selecting more than 4-5 controls does not usually result in additional efficiency gains
Hospital controls vs community controls
Hospital controls are less likely to refuse to participate (reduced selection bias)
Hospital controls are more likely to recall their past exposures (reduced recall bias)
Community controls may not remember their past exposures well (overestimated exposure effect)
Hospital controls (who are in hospital for a related health issue) may share exposures with cases (underestimated exposure effect)
What are the advantages of case-control studies?
Cheap to perform and quick
Cases already exist and no follow-up required
Most efficiency design for rare diseases or diseases with long period between exposure and disease occurrence - can select for diseases in sample after they have occurred
Can examine many exposures/risk factors
Useful when studying dynamic populations where follow-up is difficult (e.g. homeless population)
What are the disadvantages of case-control studies?
Prone to selection bias
Controls should be representative of the population ‘at risk’ of becoming cases and be sampled independently of the exposure of interest
E.g. want similar controls to cases, but very similar cases (e.g. other hospital patients) can share exposures
Prone to information bias
Recall bias: recall of past events differs between controls and cases, e.g. cases more likely to have spent time thinking about past exposures
Observer bias: assessment of the exposure status of subbject affected by knowledge of whether that subject is a case or control
E.g. investigations may be more thorough into a case’s background, even reading of scans and diagnoses may differ due to unconscious bias
Can be inefficient when the exposure is rare. Large sample size required
Not suitable for multiple outcomes (because data are collected conditional on outcome status)
Does not allow for calculation of absolute risk of disease due to sampling by cases.
Causal inference complicated by lack of clear time ordering
What are cross-sectional studies?
Descriptive studies where subjects are observed only once, creating a snapshot of data at one particular time point.
There is no follow-up or retrospective.
Exposures and outcomes are measured simultaneously
Used to describe characteristics of a group or explore associations between exposures and outcomes.
Can analyse through difference in means, or odds ratio and risk ratio (sometimes referred to as prevalence odds ratio and prevalence ratio)
What are the advantages and disadvantages of cross-sectional studies?
Advantages
Easy and reasonably cheap to perform
Useful to inform and guide larger / more sophisticated future studies
Disadvantages
Need to ensure that a sample is representative of the study population (selection bias)
Response rates, particularly in surveys, tend to be low. Missing data can lead to selection bias
Cause-effect relationships are difficult to infer because of a lack of time-ordered data
Why perform observational studies rather than experimental studies?
Experimental methods are the ‘gold standard’ for measuring intervention effects
However:
An experiment may be unethical
Certain populations may be prohibited from taking part in a clinical trial
An experiment may be infeasible or impractical to carry out
An experiment may be too expensive
What is selection bias?
A bias arising from when the sample does not represent the population of interest
May occur in the recruitment stage of subjects or through dropouts
Examples include
Inappropriate selection of subjects (cohort studies). E.g. heavy drinkers may decline to participate in a study on alcohol consumption and cardiovascular disease
Inappropriate selection of controls
Large dropout or missing observations that make the sample unrepresentative of the population
How can selection bias be addressed?
• Select an appropriate study sample
– Representative of the population
• Have in place mechanisms to reduce loss to follow up
– Record causes of loss to follow-up, e.g. Death
• Carefully deal with missing data at the analysis stage
– Pre-plan to ensure that variables that can be predictors of missingness have been recorded.
What is information bias?
Occurs when measurements are made.
Information bias arises when subjects are incorrectly categorised with respect to their exposure or outcome status
Types of information bias include
Recall bias
Systematic differences in the way subjects remember or report exposures (e.g. patients with the disease may remember past exposures more accurately)
Response bias
Patient knowledge of the treatment / outcome / study objective can affect their reports of subjective measures such as pain relief or level of exposure
Observer bias
Knowledge of the treatment / outcome of a patient can affect the ability of observers to collect or analyse the data in an unbiased manner
How can we avoid information bias?
Data collection methods may include questionnaires, interviews, physical examinations, laboratory or imaging data, or medical records review
We can reduce information bias if we
Use standardised processes (e.g. tests and questionnaires)
Blind assessors
What are causation and association?
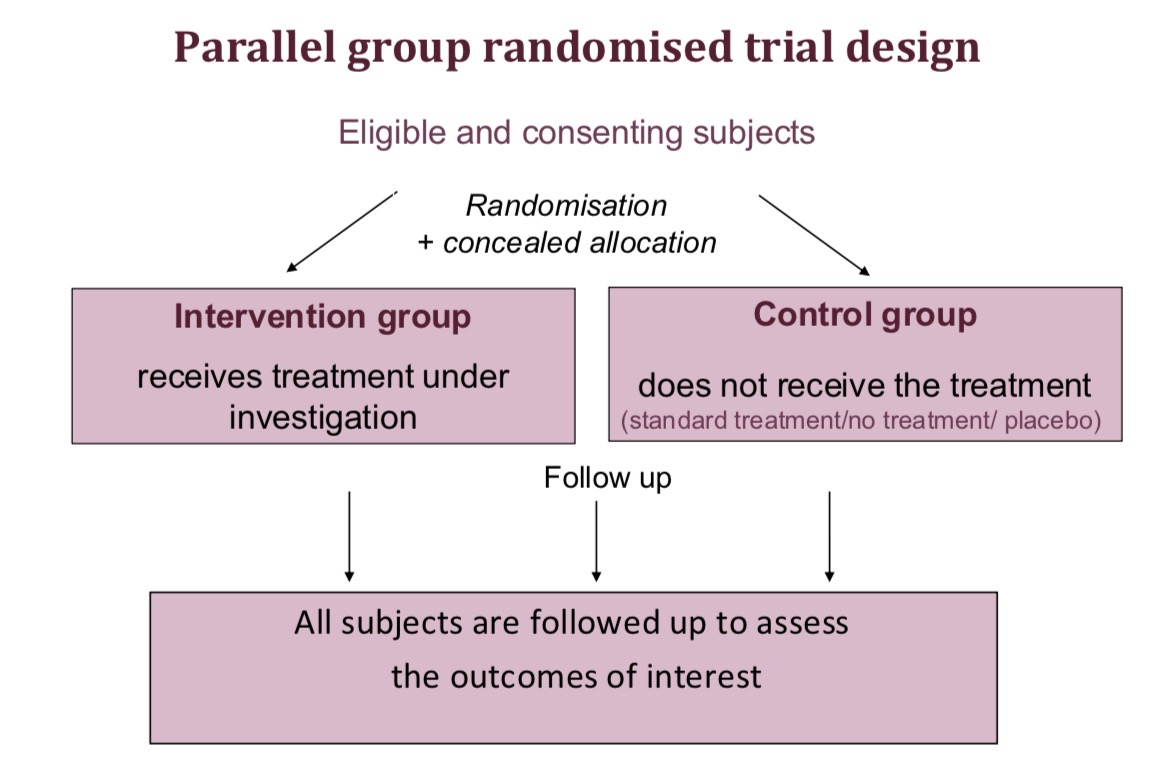
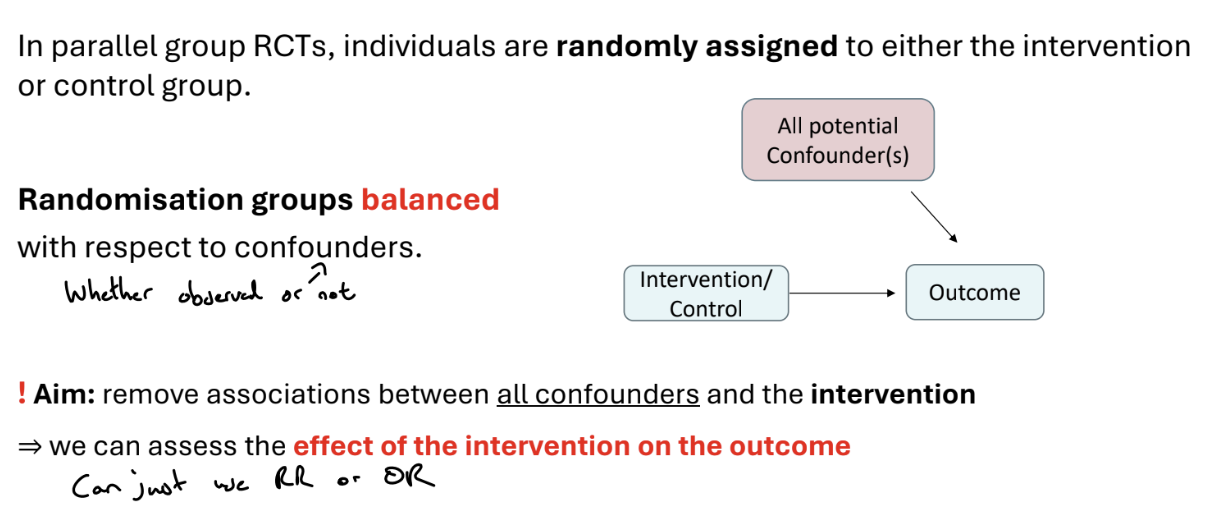
What is parallel group design?
Predefined inclusion-exclusion criteria are used for find eligible patients, and their consent for the trial is obtained. These eligible and consenting subjects are divided into an intervention group, who receive the treatment under investigation, and the control group, who do not receive the treatment (e.g. they may receive the current standard treatment, no treatment or a placebo). Randomisation and concealed allocation should be used to create balanced treatment groups.
Both groups are followed up to assess the outcomes of interest
What is the aim of randomised trials?
Randomised trials aim to compare groups of subjects who are similar in all aspects, except in terms of the intervention they receive. Therefore, any difference in outcome can be attributed to the intervention.
Trials must be carefully designed at all stages (design, implementation, analysis and interpretation) to ensure the comparison groups are balanced for known and unknown factors, e.g. the characteristics of subjects and processes used in the trial should be similar
What are the strategies used in randomised trials?
Randomisation (simple, blocked / restricted, or stratified randomisation, or minimisation) used in the allocation of subjects to groups
Concealed allocation - it is ensured that the recruiter does not know what the next allocation is, e.g. by central randomisation
Masking (Blinding) - preventing those involved in the trial from knowing whether a subject is receiving intervention/control
Strategies to minimise non-compliance, withdrawals and losses and surrounding issues - e.g. designing trial to minimise non-compliance and drop outs, collecting data on reason for withdrawal, using ITT or instrumental methods to address non-compliance
What is the problem with deciding treatment groups based on a pattern?
We could decide treatment groups based on patterns, e.g. alternating (first person to treatment, second to control…), day of enrolment, hospital record number, etc.
However, if these rules are predictable, the person recruiting to the study may know these rules and therefore be able to determine allocation, e.g. not recruiting a patient because they know whether they will be treated or not
What are the methods of randomisation?
Allocations can be produced via computerised randomisation
There are several methods of randomisation
Simple
Blocked
Stratified
Minimisation
What is simple randomisation?
The treatment group for each patient is randomly selected. Each assignment is independent and the chances of being assigned to each group are the same for all patients
With small studies this method can by chance produce groups of different sizes (solved via blocked randomisation) or which are imbalanced for some characteristics (solved via stratified randomisation or minimisation)
If the sample is sufficiently large, simple randomisation should lead to a balance in group size and characteristics, due to the law of large numbers.
Guideline: simple randomisation is only appropriate for studies recruiting a minimum of 200 subjects.
What is blocked / restricted randomisation?
Blocked randomisation is useful for small samples. This method controls the balance of numbers allocated to each group.
The randomisation list is composed of small blocks within which the numbers allocated to each group are controlled.
For each block, there is a list of block patterns with the desired balance of allocation. The randomisation list is built by randomly picking from these block patterns.
E.g. for equal (1:1) allocation, blocks have equal allocations to I and C. For a block size of 6, we may obtainthe list ICICCI CICICI ICCICI CCCIII
What is stratified randomisation?
Stratified randomisation reduces the chance of differences in important characteristics between groups
The procedure is
Identify key subject characteristics that are strongly related to the outcome
Represent each characteristic as categories (strata)
Produce separate blocked randomisation lists for each stratum
A limitation of stratified randomisation is that the number of strata is limited by the sample size
Guideline: maximum n / (B*4) strata, where n = no. patients and B = block size
What is minimisation?
An alternative to stratification that allows balancing on more factors
There is no pre-defined allocation list from order to treatment
This is a dynamic process, implemented using a computer algorithm
The first subject is allocated to the group at random. When allocating subsequent subjects, their characteristics and those of subjects already randomised are considered. Allocation is weighted towards the group that will minimise the overall imbalance in characteristics between the groups (but allocation is still random)
What is the issue with pre-defined lists of allocation for recruitment?
Randomisation methods that produce pre-defined lists (e.g. simple, blocked and stratified randomisation) have potential for bias at the point of recruitment. The recruiter can predict in advance which treatment subjects will receive.
Knowledge of the next allocation could result in recruiters deliberately or subconsciously allocating particular types of people to particular groups. (Selection bias).
This is not an issue for minimisation, where there is no pre-defined list from order to treatment, and subjects are allocated based on their characteristics to balance the groups.
1 solution is concealed allocation, such that the recruiter doesn’t know the allocation of patients (e.g. via central randomisation), ensuring that the the recruiter does not know the upcoming treatment assignments.
Another solution is to prevent guessing by using random block sizes
What is masking / blinding in randomised trials?
Knowledge of which intervention is given could change the behaviour of subjects and clinicians and therefore systematically affect the outcomes recorded, leading to bias.
Therefore, we want to prevent those involved in the trial from knowing whether a subject is receiving intervention / control.
Ideally, we want to mask subjects and investigators treating and assessing the subjects.
However, it’s only possible to mask some of those involved (e.g. the subject will know if they had a bed-net vs. an antimalarial drug)
Sometimes masking of subjects & investigators is not possible (‘open label’ trials), e.g. surgery vs. no surgery
What is a placebo?
What problems does withdrawal / loss to follow up cause in trials?
Subjects who withdraw / are lost to follow up do not complete the trial. They often have different prognoses / characteristics from those retained. They will have missing outcome data and may be excluded from analysis.
If there are more losses in one group than the other, there may be bias in the assessment of the intervention.
E.g. non-treatment may lead to greater illness and drop-out, so least healthy controls are omitted → bias
Solutions involve designing the trial to minimise withdrawal and collecting as much data as possible about these subjects, including reasons for withdrawal.
At analysis stage, investigate any biases that may be caused by missing data (through imputation)
What problems does non-compliance cause in trials?
Non-compliant subjects are those who did not receive or comply with their assigned treatment. Non-compliant subjects will usually have outcome data.
Analyses that move people from their randomised group or drop them from analysis will likely result in a biased assessment of the intervention
Design solution: design trial to minimise non compliance (e.g. randomise just before treatment, not enough time to become too ill for treatment), collect info about the reason for non compliance
Analysis solution: use Intention to Treat analysis, comparing subjects in the group as randomised regardless of compliance
What is a crossover trial?
Each subject is its own control, receiving 2 or more treatments at different times during the trial. The order is determined by random allocation.
‘Within subject’ comparison means a smaller sampler size is usually required than a parallel group design.
However, crossover trials are only useful for chronic stable diseases and palliative treatments without long term effects.
What are cluster randomised trials?
A parallel design, where groups (clusters) of subjects rather than individuals are randomised. All subjects in a cluster receive the same intervention and outcomes are measured at a subject level.
What are Survival data?
Survival data are the times recorded for individuals from a well-defined time origin until the occurrence of a specific event.
E.g. time until death following cancer diagnosis, time until recurrence of cancer following treatment, time until return to work following an operation
Also known as ‘Time to event’ or ‘Failure’ data
What are the two key features of survival data?
Skewness
All times are > 0, so unlikely to follow a normal distribution
Survival times are typically positively skewed
Censoring
Often, some individuals do not experience the event by the end of a period of follow up. So, their actual time-to-event is unknown
All we know is that the event of interest did not occur before a certain time (right censoring)
What is censoring?
In survival analysis, it is common that some individuals do not experience the event by the end of a period of follow up. So, their actual time-to-event is unknown
All we know is that the event of interest did not occur before a certain time. This itself is informative.
Let T be the actual time at which the event of interest takes place for an individual
Let c denote the observed time
A subject’s time is defined as censored if c does not correspond to the time at which the event of interest takes place. c ≠ T
If T > c, there is right censoring. Other types of censoring (left censoring, where the event has happened before the observation period begins, or interval censoring, where it is only known that the event occurred between two times) are not covered in this course.
Censoring is a fundamental feature of survival data that renders standard statistical methods (such as linear regression) unsuitable. We must account for censoring to avoid bias,.
What are possible reasons for censoring?
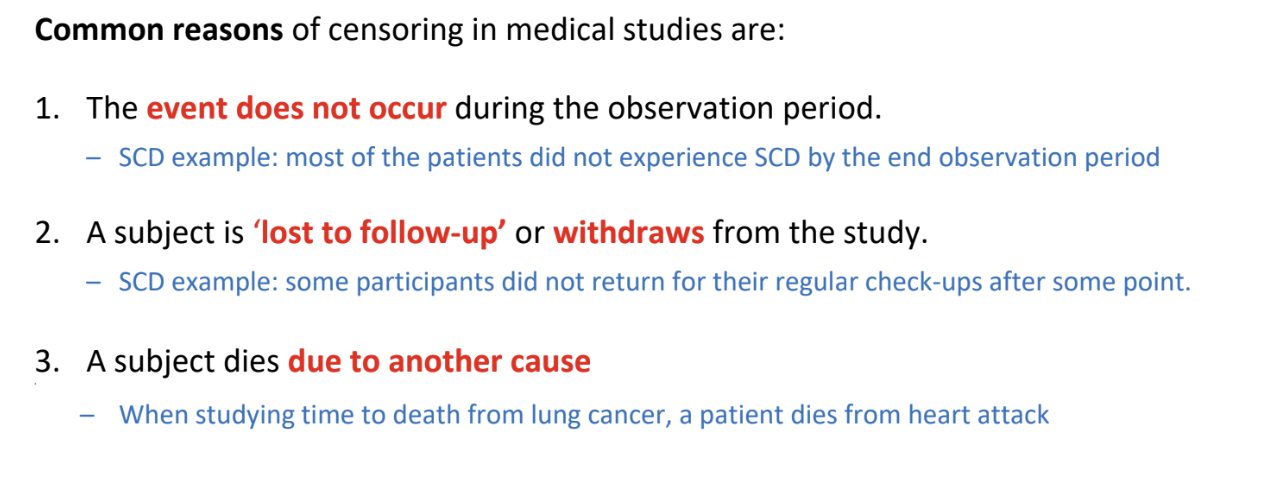
What is non-informative censoring?
Censoring is non-informative if the unobserved survival time T is independent of the mechanism that causes the observation to become censored at some time c < T
A subject who is censored at time c should be representative of all other subjects who have yet to experience the event at time c
Most survival analysis methods assume that censoring is non-informative, otherwise we require special methods.
e.g. a patient withdraws from a study because they had to move to another neighbour and so are unable to attend site visits
What is informative censoring?
Informative censoring occurs when individuals are censored, e.g. lost to follow up, for reasons that may relate to their (unknown) time to event T - there is a relationship between the censoring mechanism and the event of interest.
e.g. a patient withdraws from a study due to a deterioration in their health (and as such likely has a shorter survival time)
What is the notation for survival data?
We model T, the time to the event of interest.
However, T might not be known for all subjects, for example, due to loss to follow up or the study period ending before the individual experienced the event. We only have the time observed c.
Survival data are typically defined using a pair of variables (ti, δi) where ti is the time of event or censoring and δi is the indicator of the event, equal to 1 if the individual is observed to have the event, and 0 if the individual is censored.
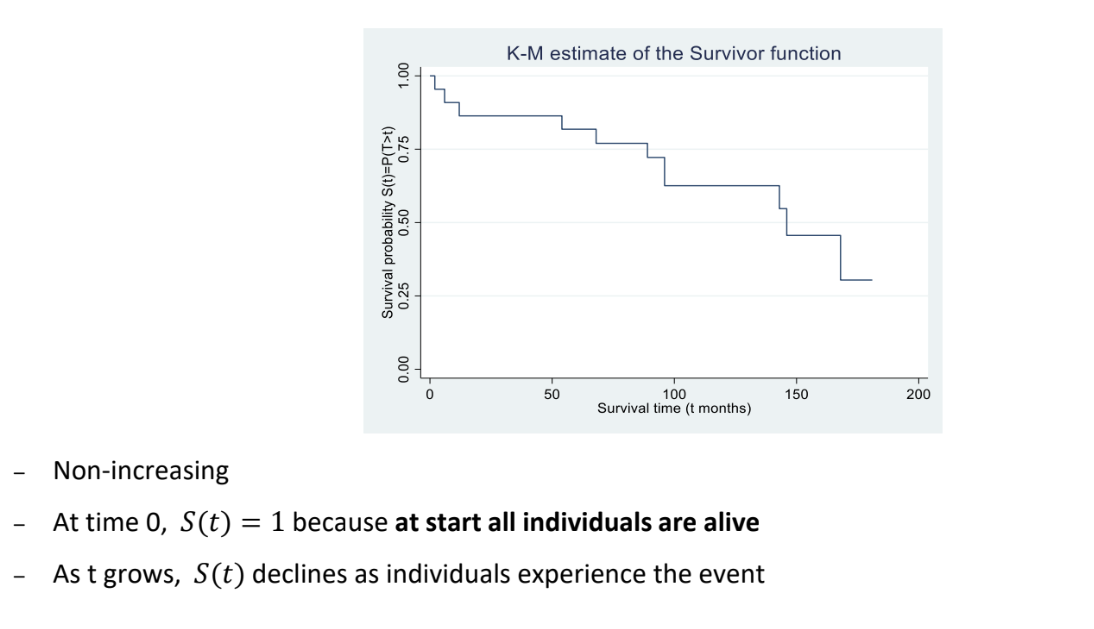
What is the survivor function?
The survivor function can be used to summarise survival data
Let T denote the survival time as a random variable with probability density function f(t) and cumulative distribution function F(t). The survivor function, S(t), is defined as
S(t) = P(T > t) = 1 - F(t)
And measures the probability that an individual survives (or remains event-free) beyond time t
S(0) = 1 because at the start, all individuals are alive. As t grows, S(t) declines
In the absence of censorings, we estimate the survivor function with the empirical survivor function.
In the presence of censoring, we use the Kaplan-Meier estimator of the survivor function, which is a non parametric estimator, i.e. does not make any assumptions about the shape of the survivor function
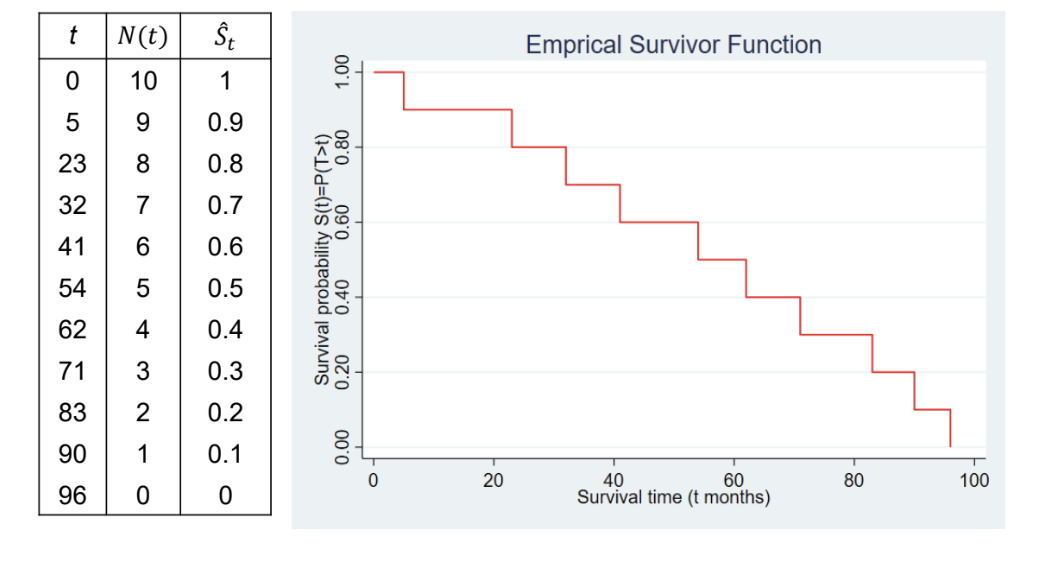
What is the empirical survivor function?
In the absence of censoring, (i.e. the event of interest is observed for all subjects), then we use a simple empirical estimate of the survivor function.
Ŝt = Number of subjects with survival times >= t / Total number of subjects in the dataset = N(t)/N(0)
Note: we assume that Ŝt is constant between event times.
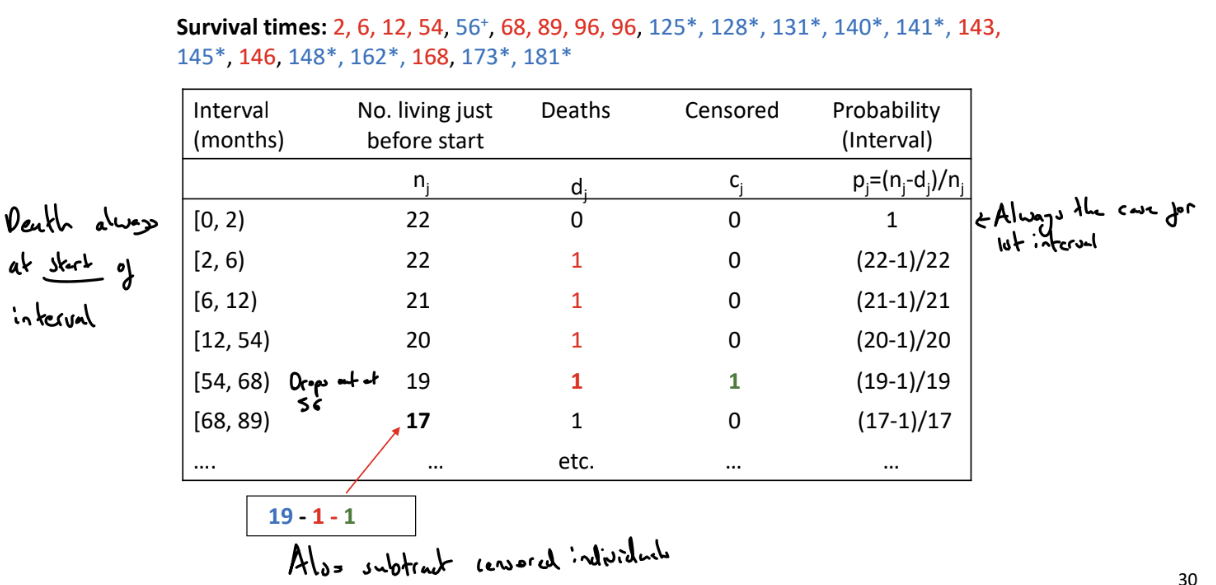
What is the Kaplan-Meier (K-M) estimator of the survivor function?
Used to estimate the survivor function in the presence of censoring. The K-M estimator uses the censored individuals in the calculation of the survival probability up to the last time they were known to be alive
We order the event-times from smallest to largest
We split the time period into series of time intervals based on the ordered event times. Each interval starts with an event time (or the time origin for the first interval) and ends ‘just before’ the next ordered failure time.
For each interval, count the
nj: the number of individuals alive and uncensored just before the start of the interval
dj: the number of events that occur in the interval
cj: the number of individuals censored during the interval
Calculate the probability of surviving in the jth interval as pj = (nj - dj) / nj
The probability of survival beyond time t (which belongs to the jth interval) is \hat{S}\left(t\right)=P\left(T>t\right)=p_1\cdot p_2\cdot\ldots\cdot pj (add as final column)
To find the probability of living beyond t, find the relevant interval.
We can then plot the K-M estimate of the survivor function
What is the median survival time?
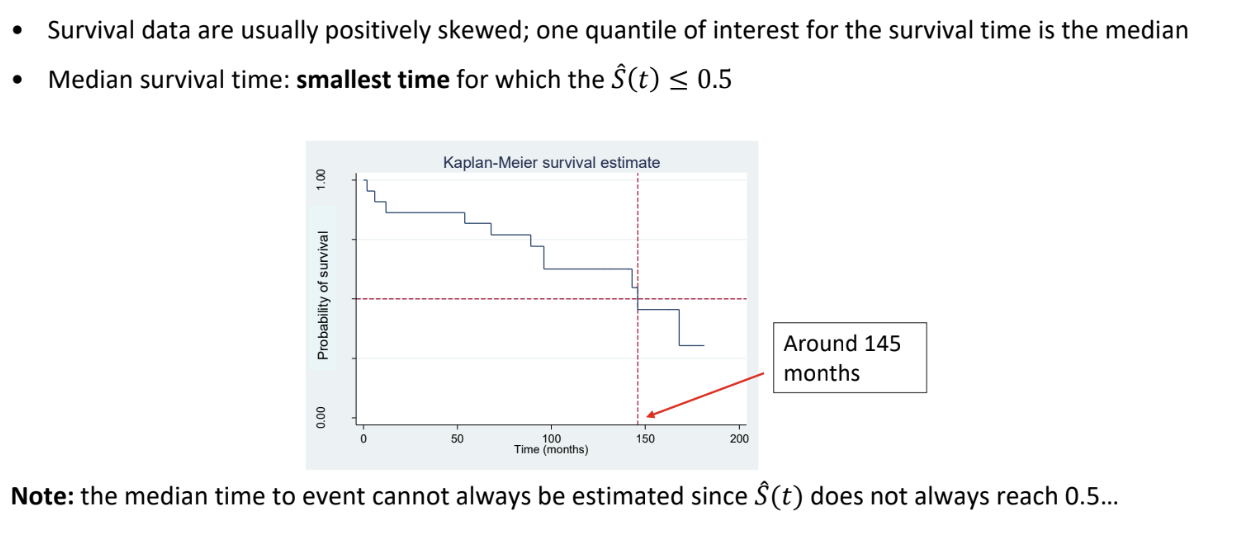
How can we compare survivor functions between groups?
As a first step, we can visually examine Kaplan-Meier estimates of the survivor function for the two groups and see if one group’s estimated survivor function decreases more rapidly
More formally, we can use the log-rank test.
How can we use the log-rank test to compare survivor functions between groups?
This is a non-parametric test to compare the survival time distribution of two or more groups
H0: The survival distribution is the same for the two groups
H1: the survival distribution is not the same for the two groups
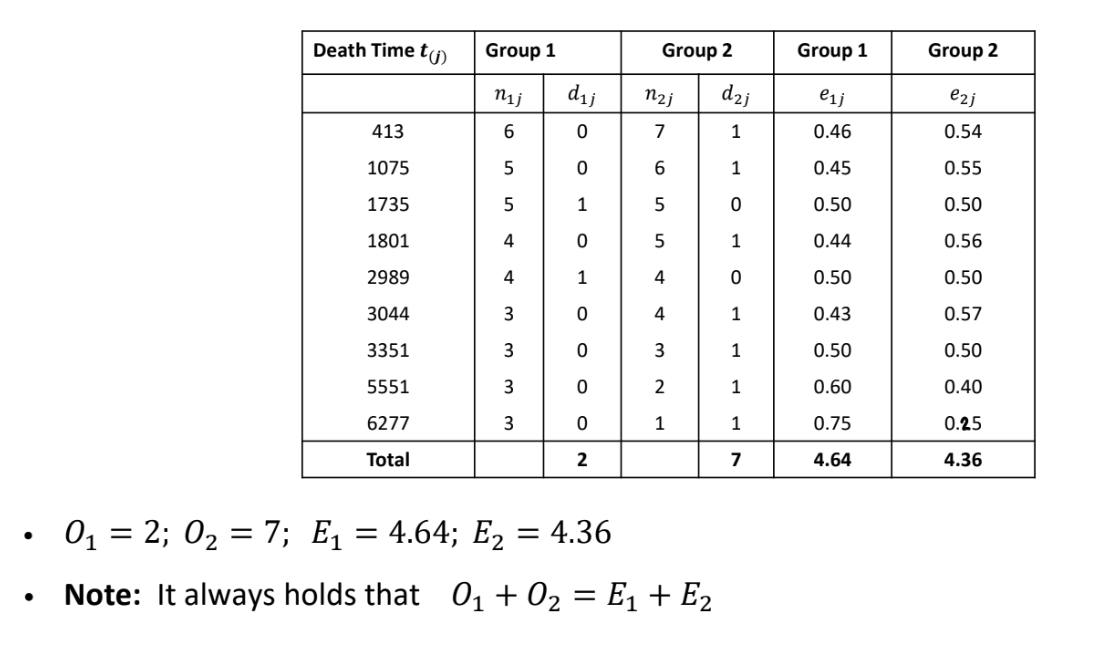
For K groups, the test statistic is X2=∑i=1KEi(Oi−Ei)2
where Oi = observed number of deaths in the ith group and Ei = expected number of deaths in the ith group under H0
Under the null hypothesis, X² ~ χ²k-1
To calculate Ei, we
Order the event times from smallest to largest across all groups
At each ordered event time j we count in each group
The number of subjects alive and uncensored immediately prior to that time: nij
The number of events at that time: dij
The expected number of deaths in the ith group at the jth time eij=njnijdj
If there are r ordered event times, then the overall expected number of events in group i is Ei=∑j=1reij
In general, the test is valid only if the KM plots of the survivor function for the groups do not intersect, i.e. the proportional hazards assumption is satisfied
What types of studies can survival analysis methods be applied to?
Survival analysis methods can be applicable to:
Randomised trials: randomise patients to different groups and observe ‘time-to-event’ outcomes
Observational cohort studies (prospective or retrospective): follow a particular group of subjects over time and collect data on time until the event of interest
Survival analysis methods are not applicable to:
Case-control studies: selecting for the events
Cross-sectional studies: no follow up
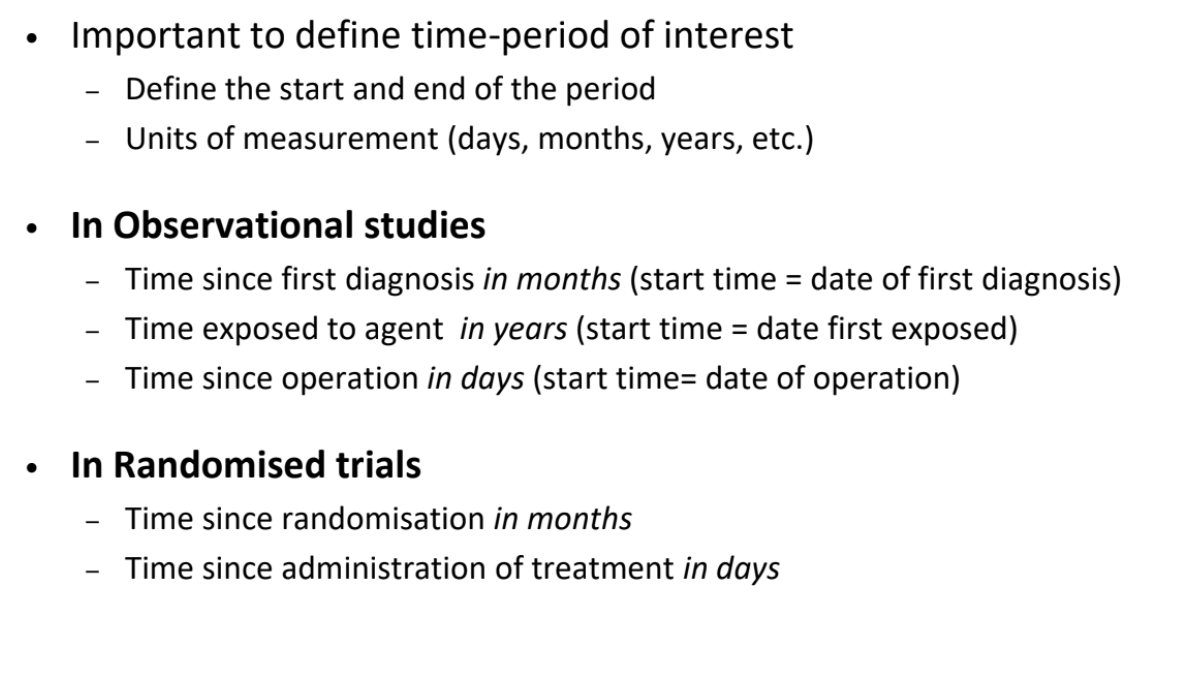
What are the different ways to define the time-period of interest in survival analysis?
Need to define the time-origin
What is a parallel group randomised trial design?
What is a consort diagram?
Used to describe the flow of subjects though the study
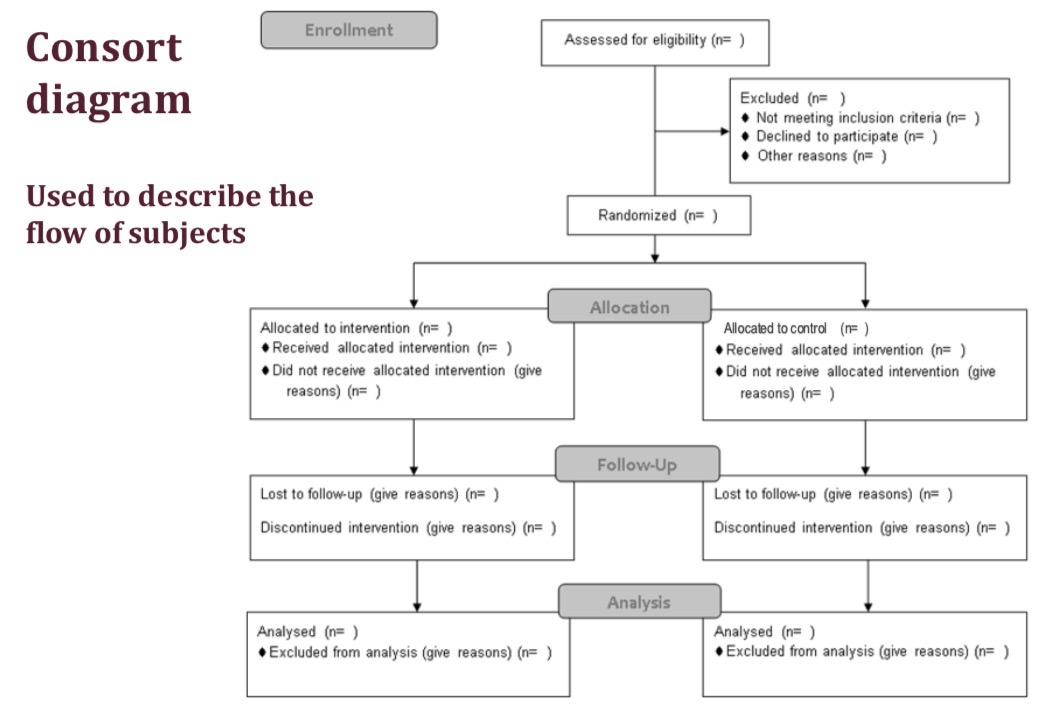
How can we provide a descriptive look at a parallel group trial?
We can create a consort diagram, which describes the flow of participants through the study
We can create a table of baseline characteristics
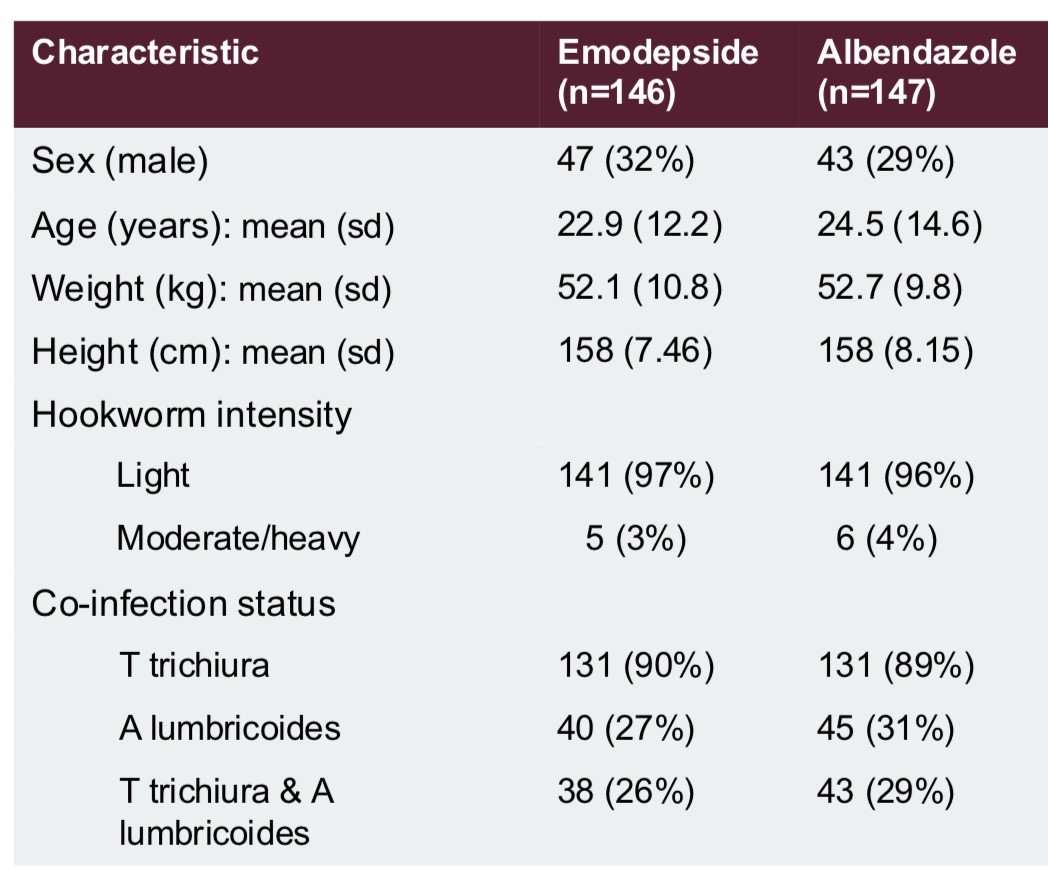
How can we create a table of baseline characteristics in a parallel group trial?
Collect data at the enrolment stage of the trial before any treatment is given
Typically this includes information on patients’ demographic and clinical characteristics, especially factors thought to affect the outcome
They are used to describe the sample and assess the success of randomisation.
(We can also use baseline data for adjusted and subgroup analysis)
We should not perform tests comparing baseline characteristics because if treatment is allocated randomly, we know that the population means should be the same. Only visually compare values
How can we analyse parallel group trial outcomes?
Since we design trials to remove bias, by example through randomisation and concealed allocation, the main analysis often a simple comparison of outcomes between the intervention and control groups.
We summarise the outcome data in the 2 groups, e.g. with means (sd) or frequency (%)
We carry out a hypothesis test, e.g. t-test, chi squared test, log rank test
We estimate the treatment effect, with a confidence interval, e.g. differences in means, risk difference, hazard ratio
e.g. for a continuous outcome, we would display the means for the 2 groups, find the difference in means (and 95% CI), and carry out a 2 sample t-test
For a binary outcome, we can display the counts and percentages for each group, report absolute and relative measures, e.g. risk difference and risk ratio / odds ratio, and their 95% CIs, and carry out a χ2 test
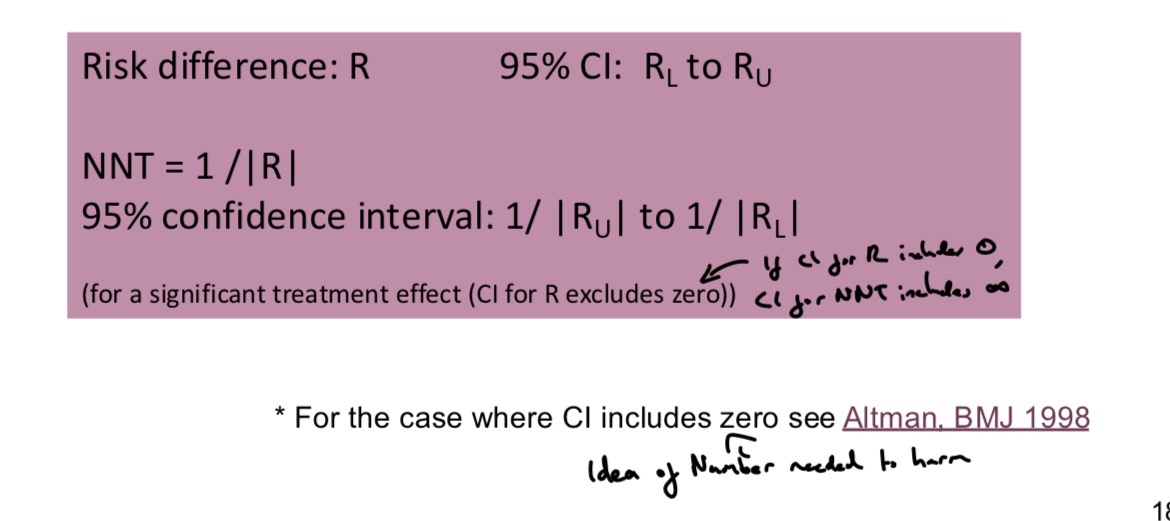
What is the Number Needed to Treat?
Metric for trials with binary outcomes.
The number of subjects who need to be treated with the new treatment for one additional subject to benefit compared with the control
A very small NNT (that approaches 1) implies favourable outcomes occur in nearly every subject receiving treatment, e.g. no controls recover but all of the treated do
The size of the NNT can be weighed up against safety and cost of treatment
What is non-compliance?
Non-compliant subjects are those who do not receive or comply with their allocated treatment.
How should we address non-compliance?
We should use an Intention to Treat analysis or a Complier Average Causal Effect analysis
What is intention to treat analysis?
We compare outcome data between groups as randomised, analysing non-compliers in their original group of randomisation
This avoids selection bias that would arise if we excluded data for non-compliant subjects or compared groups of subjects according to the treatment actually received
Consider the efficacy of a treatment, the impact of the treatment when actually taken, and the effectiveness of a treatment, the impact of offering the treatment to the patient.
With no non-compliance, ITT analysis will estimate treatment efficiency, but with lots of non-compliance ITT analysis will instead estimate the effectiveness of offering the treatment - which is usually a diluted estimate of treatment efficacy
What is the efficacy and effectiveness of a treatment?
The efficacy of a treatment is the impact of the treatment when actually taken. Does the drug work in specified ideal conditions?
The effectiveness of a treatment is the impact of offering the treatment / giving the treatment to the patient to take. Does the drug work in real life conditions?
Typically expect effectiveness < efficacy
What are per-protocol and as treated analyses?
Strategies for addressing non-compliance
Per-protocol analysis (PP) compares randomised groups excluding data for all subjects who were non-compliant
As treated analysis (AT) compares groups of subjects according to the treatment actually received
However, this leads to selection bias if compliers differ from non-compliers.
Excluding data leads to reduced sample size
We need to interpret these analyses very carefully and adjust for baseline imbalances
Such analyses are non-randomised, observational comparisons
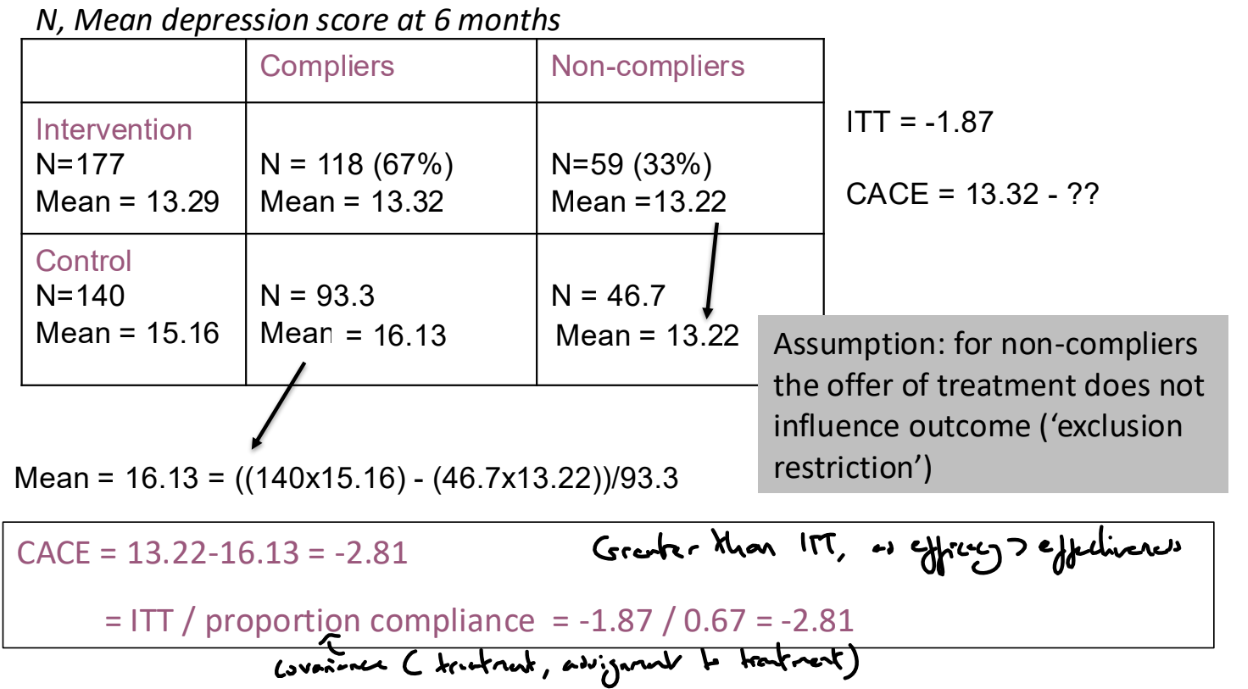
What is Complier Average Causal Effect (CACE) analysis?
Aims to estimate the efficacy of the intervention within the subgroup of subjects who would comply with the intervention if they were offered it
Assume that there are compliers who will take the intervention if offered it and non-compliers who will never take the intervention. We cannot identify the compliers in the control group and so need to make more assumptions.
We can assume that on average, the proportion of compliers is the same in the two arms of the trial and that for non-compliers, the offer of treatment does not influence outcome (exclusion restriction)
Therefore, CACE = ITT / proportion compliance
CACE can be estimated with a confidence interval using an instrumental variables / 2 stage least squares approach
How do we address missing outcome data?
We can do ‘complete case’ / ‘available case’ analysis where we exclude those with missing outcome data and use available data to compare intervention and control groups
This analysis is not biased if those with missing values are a random subset of the trial sample, but this will result in reduced sample size and power.
If those with missing values are not a random subset and instead have particular characteristics, this can affect the generalisability of the trial results (does not apply to subset of population that would drop out) and result in a biased treatment effect estimate if the occurrence of missing outcome data is different between the groups.
We should report descriptions of the missing data, including reasons why the data are missing and differences in proportion of missing data between treatment groups, and we should examine the baseline characteristics of those with / without missing data
We can use ‘sensitivity analyses’ to investigate the impact of missing data on conclusions. We can impute average / worst case / extreme scenarios, or impute values based on reason for missingness or patient characteristics
What can cause missing outcome data?
Subjects withdraw or are lost to follow up due to medical reasons (e.g. side effects, or the subject feeling better) or non-medical reasons (e.g. moved or cannot attend appointments)
Data can be missing for other reasons - it may be lost or implausible or not available.
How can we use randomisation to address confounding?
How can we use matching to address confounding?
Typically used in matched case-control studies
We select cases, and for each case, we select controls with similar characteristics in terms of potential confounders, i.e. variables associated independently with the exposure of interest and the outcome and which are not caused by either the exposure or the outcome. In the resulting dataset, the potential confounders we match on will be balanced across the case and control groups.
Does not control for confounders we do not match on
Matching alone does not remove confounding in case-control studies. The matched data must be analysed with the appropriate method: matched OR or conditional logistic regression, which can also control for other factors we have not matched on
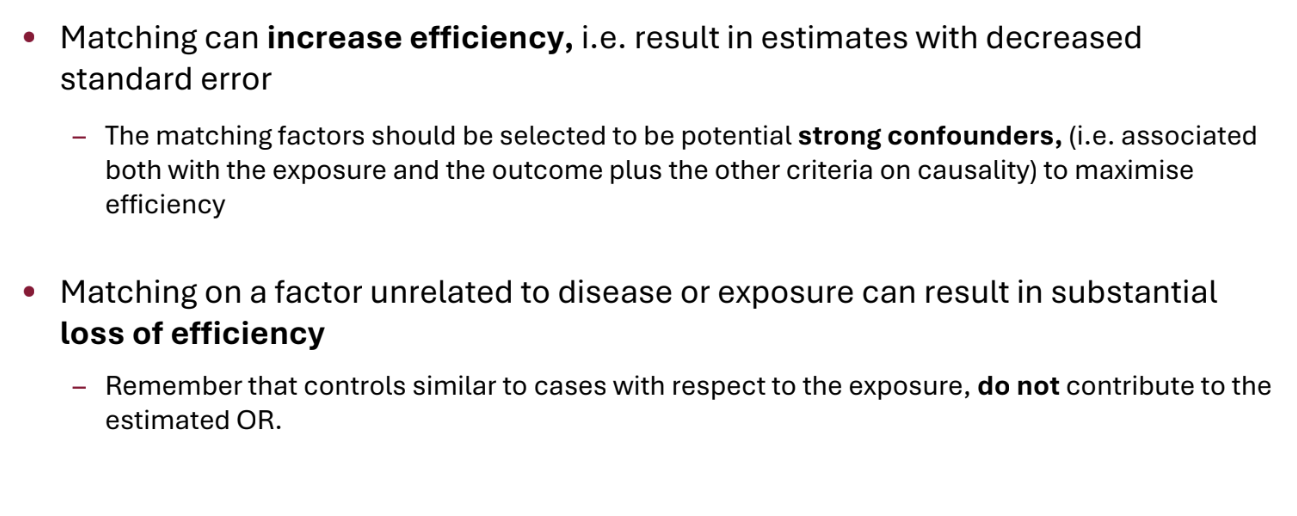
The effects of factors we matched on cannot be estimated, so matching should only be performed with respect to factors whose effect we are not interested in measuring
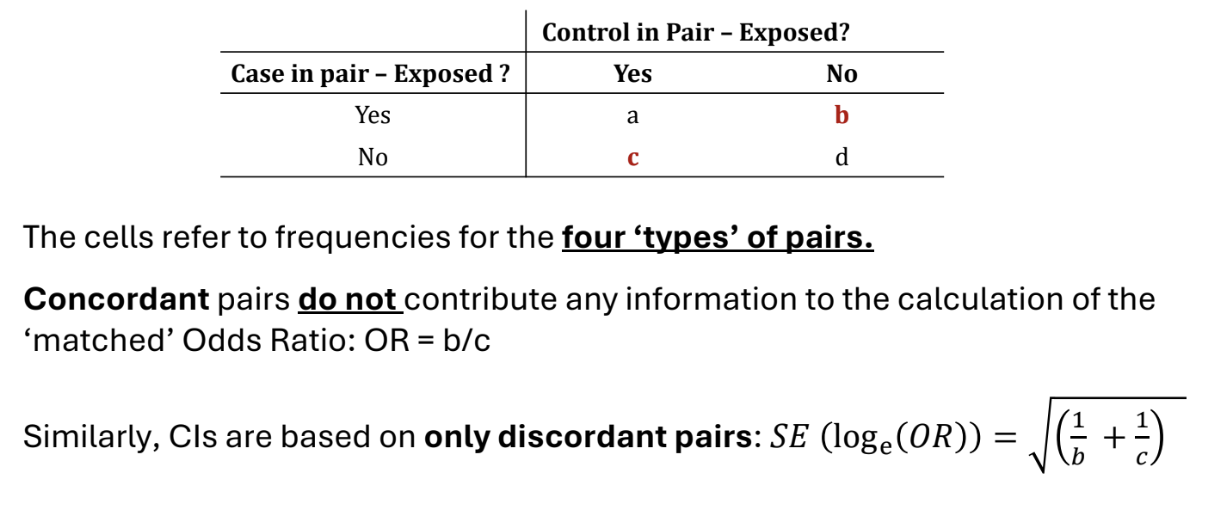
How do we carry out an individually matched case-control study?
In individual matching, we individually match each control with a case with the same values of potential confounders. E.g. select a control of the same age as the case. In the resulting dataset, the confounders are balanced across the levels of the outcome.
For each matched pair, we record whether the case and controls have had the exposure of interest or not. We can sort these into 4 types of pairs, displayed in the table. Pairs a) and d) are called concordant and pairs b) and c) are called discordant.
The odds ratio is OR = b/c.
This is the matched OR.
We can test the null hypothesis that there is no association between exposure and outcome using McNemar’s test, which is analogous to a χ2 test with matched pairs.
Under H0, X2=(b+c)(b−c)2∼χ12
How can matching affect efficiency?
Matching on unrelated factors may reduce sample size because we do not use concordant pairs - do not use cases that we would have used in ordinary analysis
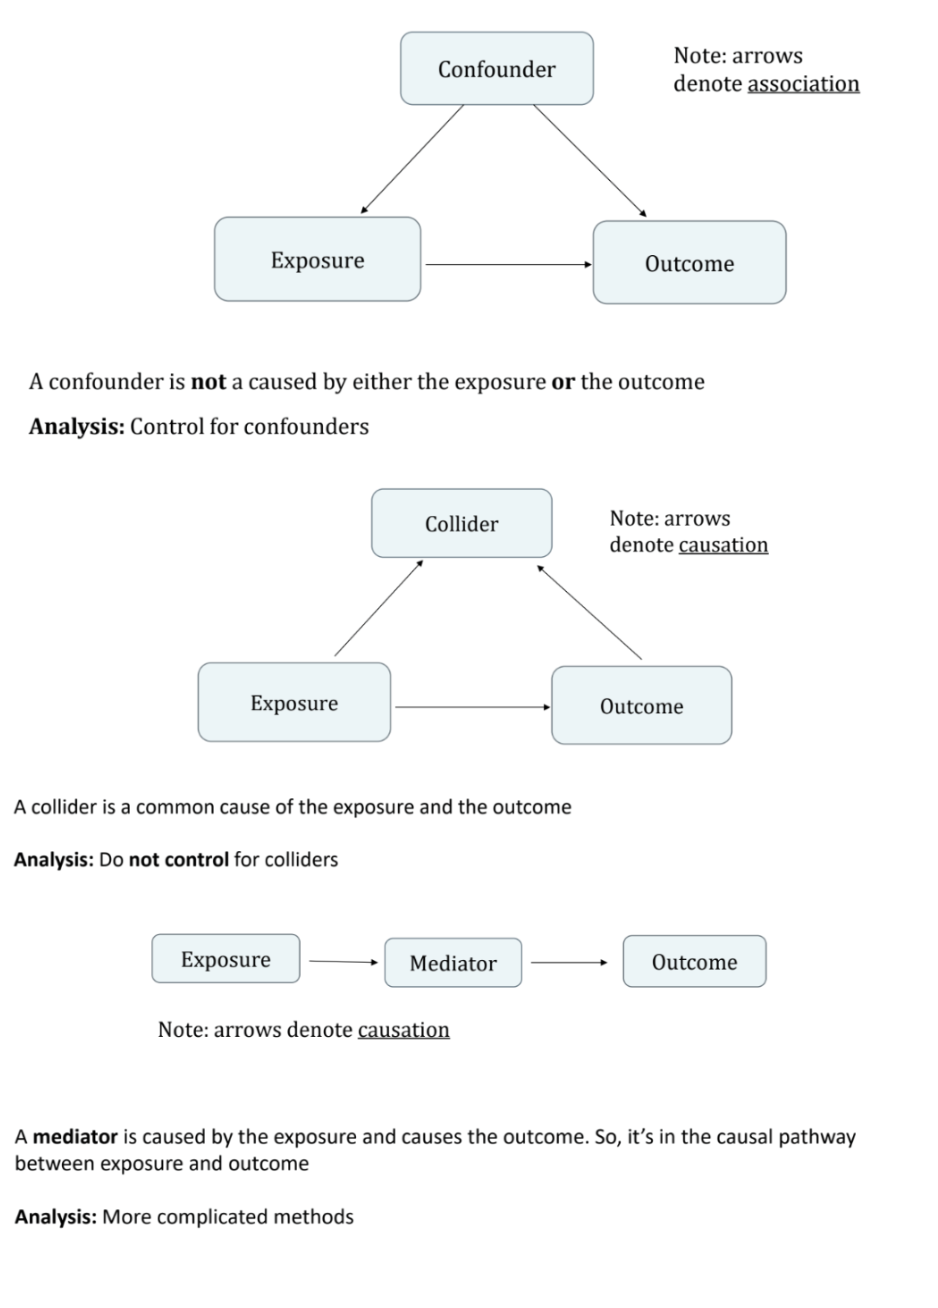
What are confounders, colliders and mediators?
A confounder is not caused by either the exposure or the outcome
A collider is caused by both the exposure and the outcome
A mediator is caused by the exposure and causes the outcome: it is in the causal pathway
How can we use stratification to address confounding?
Obsolete given computational advances, regression is far more common
We produce strata within which the confounders do not vary.(e.g. produce a strata for each combination of binary confounders, categorise continuous confounders into strata)
Within each stratum, assess the level of association between the exposure and the outcome and obtain stratum-specific estimates (e.g. RR for binary outcome, mean difference for continuous)
Combine the stratum-specific association measures to produce a weighted or ‘adjusted’ measure of the association between the exposure and the outcome. Usually, inverse variance weighting is used, where stratum-specific estimates are weighted by the inverse of their stratum-specific variances.
The key assumption is that the effect of the exposure is the same within each stratum of the confounding variable. Any differences in the estimates are assumed to arise due to chance only.
How can we use regression to address confounding?
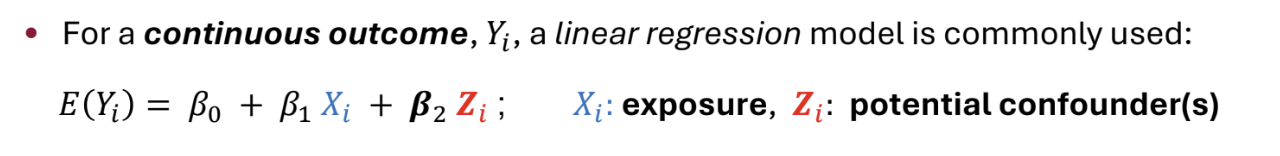
We can adjust for confounders in regression models, including linear, logistic and Cox regression models. We obtain an ‘adjusted effect’
Popular because
Continuous variables can be included without the need for categorisation
Several confounders can be accounted for
Models fitted easily using standard statistical software
How can we detect confounding?
There is no formal way of testing for confounding. Identify potential confounders at the design stage and adjust for them at the design or analysis stage.
We can look at whether a variable is associated with the outcome independently of the exposure, is associated with the exposure, and not causally affected by either the exposure or the outcome.
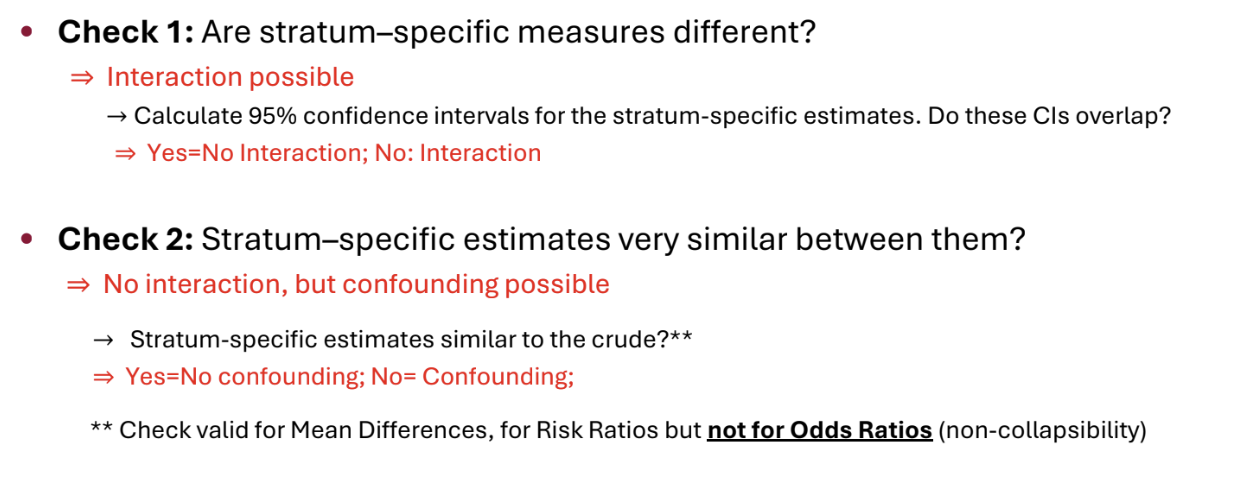
We can also fit the model without the confounders to get the unadjusted effect of the exposure, fit the model with confounders to obtain the adjusted effect, and then compare the adjusted and unadjusted estimate.
WARNING: comparing adjusted and unadjusted effects is meaningful for linear regression but less so for logistic regression due to the issue of non-collapsibility.
We should pre-plan to collect data on all potential confounders, adjust for all potential confounders regardless of their statistical significance and avoid using p-values to select potential confounders for inclusion in a model.
What is an interaction?
Interaction arises when the association between an exposure and an outcome changes, depending on the levels of a third variable (the effect modifier)
We can add an interaction term to a model by multiplying together main effects terms.
To detect an interaction, we can fit a regression model with the exposure, the possible effect modifiers and the relevant interaction terms, and then test the significance of the coefficient for the interaction terms. If significant, we should report the differences in effects between groups / report effects separately by group.
Can also use stratification and report stratum-specific estimates.
Similarly, in trials, we can fit a different regression model for each subgroup and check whether the confidence intervals overlap.
The selection of interaction terms to investigate should be done on the basis of prior interests, not significant results. The sample size should be inflated to allow for planned interaction analyses.
How can we detect interaction / confounding using stratification?
Obtain stratum-specific effect estimates
What are logistic regression models?
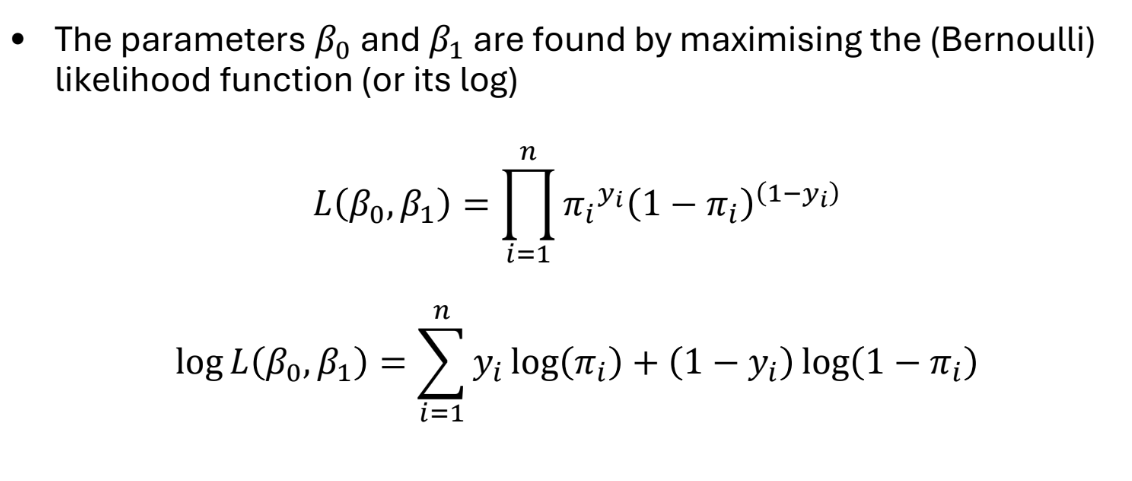
We assume that the binary outcomes Y are Bernoulli distributed, where P(Yi=1∣X=xi)=πi
Logistic regression models the log-odds of the outcome as a function of the predictor
log(1−πiπi)=ηi=β0+β1x1i+…+βqxqi
ηi is the linear predictor, and πi=1+exp(−ηi)1
β0 is the log-odds of the outcome when all xki=0
βk is the difference in the log-odds between when xki=1 and when xki=0
We can include indicator / dummy variables, non-linear terms and interactions. We can test whether interaction terms are significant (e.g. via Wald tests) to see whether the effect of an intervention differs by subgroup
The parameters β are found by maximum likelihood estimation. Confidence intervals for β are calculated under assumption that MLEs are normally distributed.
In practice, results are usually presented in terms of (adjusted) odds ratios exp(βk) rather than coefficients βk. Therefore, we take the exponential of the estimates of the coefficients and their confidence intervals.
exp(β0) or _cons is not an odds ratio, but is instead the baseline odds (the odds for the group with all xki=0
We can also obtain fitted values (predictions) from this model
log(1−πi^πi^)=ηi=β0^+β1^x1i+…+βq^xqi
How can we carry out hypothesis tests for logistic regression models?
We can test for associations between the outcome and each predictor using either Wald or likelihood ratio tests. These tests give similar results for large datasets, but the likelihood ratio test is more reliable for small datasets.
Wald Test
For binary or continuous predictors, we want to test the null hypothesis of no association:
H0:β1=0 which is equivalent to H0:exp(β1)=1
Under the null hypothesis, SE(β1^)β1^∼N(0,1)
For categorical predictors, we want to test the null hypothesis
H0:βj1=βj2=…=0
where βjk are the corresponding indicator variables.
We can also test this hypothesis using a Wald test
Likelihood Ratio Test
Alternatively, we can fit models with and without the variables and compare the corresponding likelihoods L1 and L2
Under the null hypothesis that H0:β1=…=βq=0,
−2(logL2−logL1)∼χq2
What is the Hosmer-Lemeshow test?
A method to investigate the goodness of fit of a logistic model. We group ‘similar’ patients together and calculate a test statistic using the grouped data
Typically, 10 equal-sized ‘risk groups’ are created based on the predicted values from the model
G1: 10% of patients with the lowest predicted risk
G2: 10% of patients with the next lowest predicted risk
…
G10: 10% of patients with highest predicted risk
(This method requires that the model produces a sufficiently large number of unique predicted values, must be sufficiently complex / have numerical predictors)
The test statistic is of the form
HL=j=1∑10ej(nj−ej)nj(oj−ej)2
where nj is the size of group j and
oj=∑i∈Gjyi : Observed events in group j
ej=∑i∈Gjπi^ : Expected events in group j
HL follows a χ82 distribution if the model is correctly specified
2 df are lost because of constraints
In small samples, this test has very little power and rarely rejects H0
In large samples, outliers often lead to a rejection of H0
Better goodness of fit tests exist, but are less intuitive
A plot of observed and expected values is also informative
How can we use logistic regression to analyse case-control studies?
Case-control studies are typically either unmatched or individually matched (matched one-to-one)
We can use logistic regression to analyse unmatched case-control studies. We use the case / control status as our binary outcome. We can interpret the odds ratio for the exposure in the usual way. However, we cannot interpret the intercept (_cons) or make risk predictions, because we have selected for the number of cases and controls.
Standard logistic regression cannot be used for individually matched case-control studies. The many indicators needed for the matched pair variable will cause estimation problems with logistic regression. Instead, we can use conditional logistic regression to estimate the coefficients. This uses a conditional likelihood that excludes the matched group terms. The odd ratios obtained can be interpreted in the usual way
What is the likelihood function of a logistic model?
What is an ANCOVA?
Multiple regression, where we regress the outcome variable on the treatment / exposure and other variables.
We often control for baseline variables in randomised trials or possible confounders in observational studies.
The adjusted treatment effect measures the effect of the treatment, holding other factors constant.