ECO2013 Exams and Quizzes
1/113
Earn XP
Description and Tags
Name | Mastery | Learn | Test | Matching | Spaced | Call with Kai |
|---|
No analytics yet
Send a link to your students to track their progress
114 Terms
Consider a production possibilities frontier. Which points are efficient?
points on or inside the frontier
points on or outside the frontier
points outside the frontier
points on the frontier
D
Consider the market for a good in which there has been an increase in supply and a decrease in demand. With certainty we can say:
equilibrium price has remained the same
equilibrium quantity has remained the same
equilibrium price has risen
equilibrium price has fallen
equilibrium quantity has risen
equilibrium quantity has fallen
Which statement(s) are correct?
4
In the market for a good, you observe the price of the good has risen and at the same time the quantity sold has risen. This is the result of:
a decrease in demand
an increase in supply
a decrease in supply
an increase in demand
D
A country decides to specialize in corn production. They now export corn and import shirts. Which groups of people in this country benefit from trade?
Select all that are correct.
people who buy corn
the owners and workers associated with the production of shirts
the owners and workers associated with the production of corn
people who buy shirts
C, D
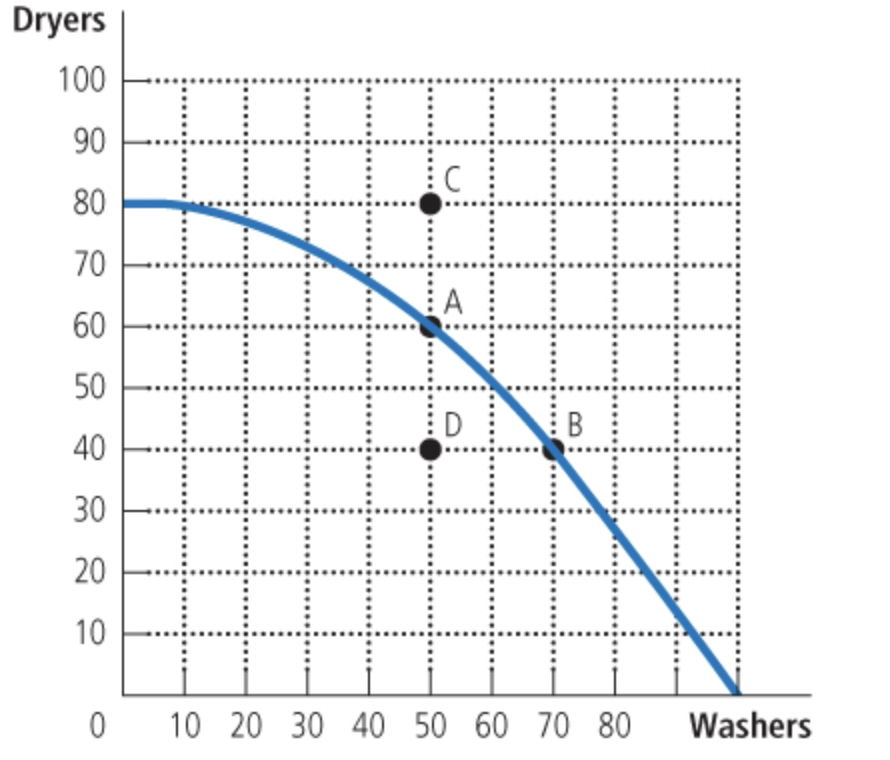
Consider the production possibilities frontier below where dryer production is measured on the vertical axis and washer production is measured on the horizontal axis.
This country is currently producing at point A. If this country wants to consume at point C then they need to:
produce fewer computers
engage in specialization and exchange with another country
produce fewer cars
use their unemployed resources to produce more cars and computers
B
Which of the following is an example of a normative statement?
As the price of cars rises, more people choose to take the bus.
Gasoline prices ought to be lower than they are now.
An increase in the cigarette tax would cause a decrease in the number of smokers.
The discount rate is the interest rate the Federal Reserve charges banks to borrow funds.
B
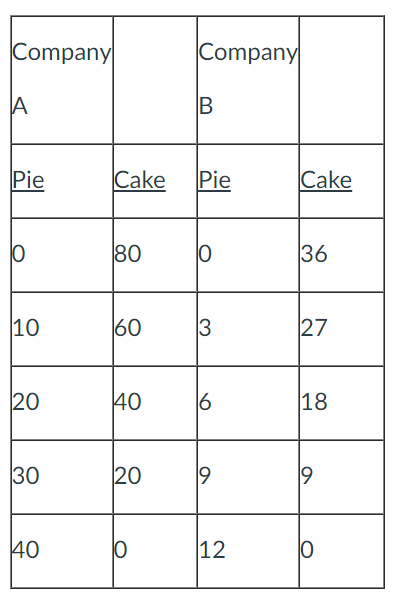
Companies A and B can produce the indicated combinations of pie and cake each day with their existing resources.
Based on the information provided, company (A/B) has the absolute advantage in producing cakes, and company (A/B) has a comparative advantage in producing cakes.
A, B
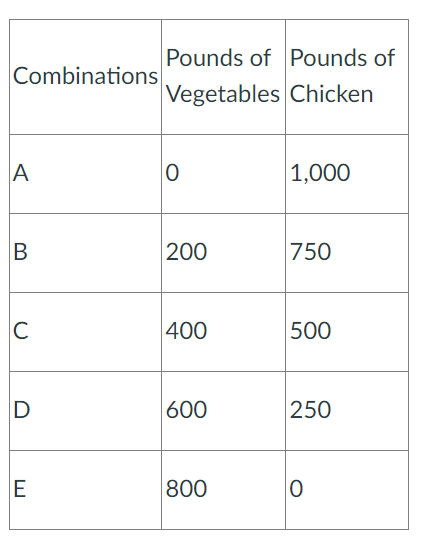
The table illustrates the production possibilities frontier for a small country.
This country has:
constant opportunity cost.
increasing opportunity cost.
decreasing opportunity cost.
A

The figure illustrates the production possibilities frontiers for Ann and Bob. They produce vegetables (vertical axis) and hors d'ouvres (horizontal axis).
Who has an absolute advantage in producing vegetables?
Ann

Who has a comparative advantage in producing vegetables?
Ann
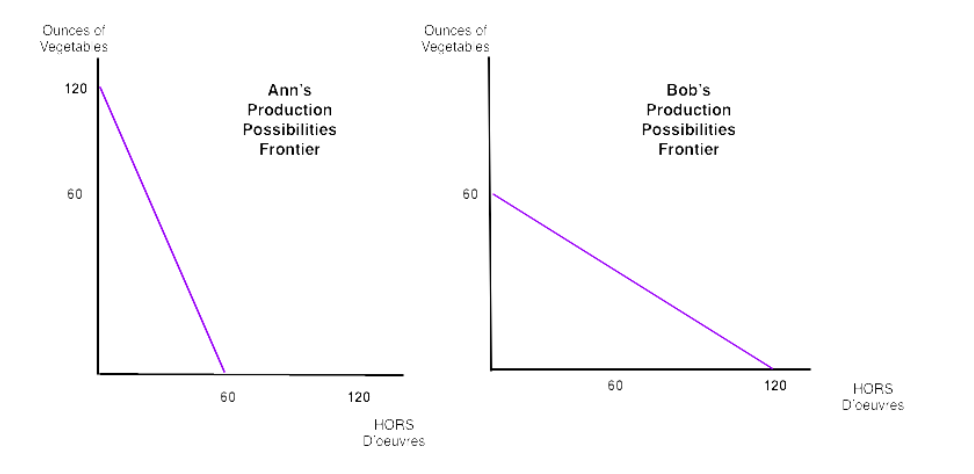
If Ann and Bob were to engage in specialization and exchange then they would both be willing to trade 3 hors d’oeuvres in exchange for 1 ounce of vegetables. (T/F)
False
You observe that when the price of good A falls this causes the demand for good B to fall. You can conclude that goods A and B are:
complements
normal goods
inferior goods
substitutes
D
Joe spends $20,000 during his two semesters in college on rent, food, books, tuition, and entertainment. Joe’s opportunity cost of attending college for the two semesters is $20,000. (T/F)
F
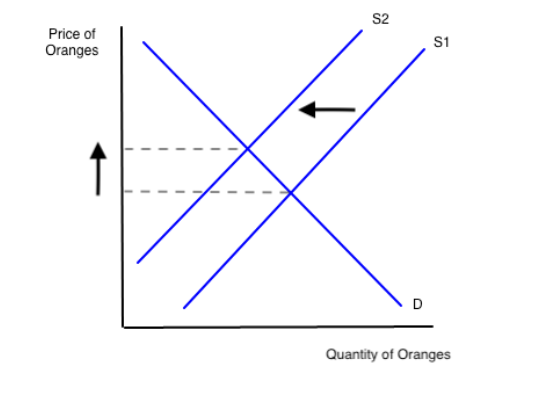
Which of the following would cause the change illustrated above?
A new machine allows the oranges to be harvested twice as fast
Buyers decide to eat bananas instead of oranges
Disease kills 20% of the orange trees
More people prefer to drink orange juice
C
Brenda buys three goods: X, Y, and Z. When her income rises she buys more of good X and less of goods Y and Z. When the price of good X rises she buys more of good Y and less of good Z.
Which goods are inferior?
X and Z
Y and Z
X, Y, and Z
X
B
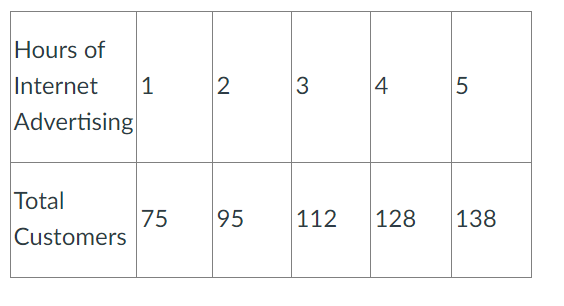
A firm is going to buy five hours of advertising per week. They can choose to advertise on the internet or in the newspaper. Both have the same per hour cost.
If they did not advertise at all they would have a constant 50 customers per week.
For the internet advertising, the firm finds that it has different numbers of total customers per week depending on how many hours they advertise, based on the following table.
Newspaper advertising increases the customers per week by a constant 18 customers per hour advertised.
How should the firm divide its five hours of advertising per week?
The firm should advertise … hours on the internet and … hours in the newspaper
2, 3
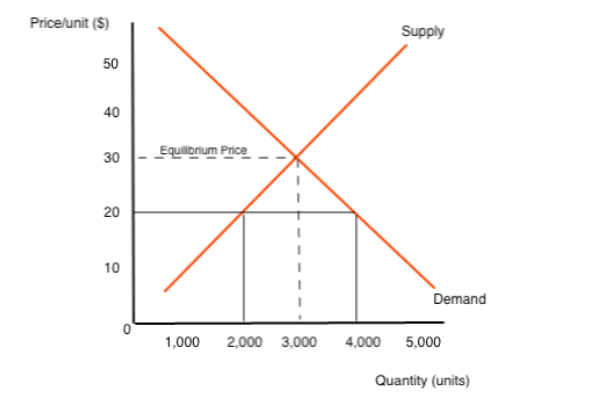
Consider the graph above. At a price of $20:
There is a shortage of 1,000 units
There is a shortage of 2,000 units
There is a surplus of 3,000 units.
The market is in equilibrium.
B
Suppose tickets to a baseball game are currently selling for $60 each, but the equilibrium price of tickets is $50 each. We would expect a _______.
surplus to exist and the market price of tickets to decrease
shortage to exist and the market price of tickets to increase
surplus to exist and the market price of tickets to increase
shortage to exist and the market price of tickets to decrease
A
In the market for pizza, five new restaurants open. You would expect the equilibrium price to _____ and the equilibrium quantity sold to ____.
decrease : decrease
decrease : increase
increase : increase
increase : decrease
B
Consider the market for gasoline. Which of the following shifts the supply curve for gasoline rightward?
An increase in the price of gasoline.
A decrease in the price of a resource used to produce gasoline, such as crude oil.
A situation where the quantity demanded exceeds the quantity supplied.
An increase in the demand for gas-guzzling sport utility vehicles.
B
Two countries produce coffee and blueberries. Nicaragua can produce either 25 thousand pounds of coffee or 100 thousand pounds of blueberries per year. Colombia can produce either 20 thousand pounds of coffee or 40 thousand pounds of blueberries per year.
Initially the two countries do not trade. Nicaragua produces 7 thousand pounds of coffee and 72 thousand pounds of blueberries. Colombia produces 7 thousand pounds of coffee and 26 thousand pounds of blueberries.
Suppose the countries completely specialize and decide to trade 9 thousand pounds of coffee for 27 thousand pounds of blueberries.
Compare pre-trade consumption to post-trade consumption.
Nicaragua can consume:
… thousand more pounds of coffee
… thousand more pounds of bluenerries
After trade, Colombia can consume
… thousand more pounds of coffee
… thousand more pounds of blueberreis
2 , 1 , 4 , 1
A change in which of the following variables does not directly affect how much of a good producers choose to sell?
consumer income
the cost of material inputs
wages paid to workers
the number of sellers
A
Vega and Sentra are two countries that both produce chicken and vegetables.
In Vega each worker in a one-hour period can produce either 8.62 pounds of chicken or 5.96 pounds of vegetables.
In Sentra each worker in a one-hour period can produce either 26.39 pounds of chicken or 8.71 pounds of vegetables.
Suppose both countries have constant opportunity cost of production and decide to specialize and exchange.
The country that specializes in vegetables is willing to sell 24 pounds of vegetables for at least _____ pounds of chicken.
Enter a numerical value, rounded to two decimal places.
…
ABC Photography Co. purchases new computer software that reduces the costs of editing and distributing photos. As a result, the _______.
demand for ABC's photos will increase.
supply of ABC's photos will decrease.
demand for ABC's photos will decrease.
supply of ABC's photos will increase.
D
According to the law of demand:
when the price of the good rises, there is an increase in quantity demanded
income and quantity demanded are positively related
an increase in the cost of production will increase the price of the good
price and quantity demanded are inversely related
D
According to the supply/demand model:
price will rise if there is a surplus.
price will fall if quantity demanded is greater than quantity supplied.
price will fall if there is a shortage.
price will rise if quantity supplied is less than quantity demanded.
D
A production possibilities frontier illustrates
the quantity of a good produced as more labor is employed.
the different quantities of two goods that can be produced at the same cost.
the different quantities of two goods that can be produced with given resources.
the quantity of labor required to produce each additional unit of output.
C
Two countries decide to engage in specialization and exchange with each other. As a result, we can expect:
the production possibilities curve to shift outwards for the exporter and inwards for the importer.
the production possibilities curve for each country to remain unchanged.
the production possibilities curve for each country to shift outwards.
the production possibilities curve for each country to shift inwards.
C
When you stand in line for 20 minutes to buy groceries, the value of that time is:
worthless.
an explicit cost.
an implicit cost.
C
In the market for a good there has been a decrease in supply. Therefore, we can expect equilibrium price to _____ and equilibrium quantity to _______.
decrease : decrease
decrease : increase
increase : increase
increase : decrease
D
Which of the following best describes market equilibrium?
price is at the level set by the government.
sellers charge the lowest price possible.
quantity demanded equals quantity supplied.
buyers pay the highest price possible.
C
John collects aluminum cans and sells them to a recycling firm to earn extra cash. Each can he finds earns him 20 cents.
He also has an open offer to help out his friend who has a landscaping business. Each hour he works for his friend he is paid $9 per hour.
John works 5 hours a day and experience has shown that he finds more cans the more hours he spends searching based on the following schedule:
He finds 200, 350, 460, 510, or 545 cans in total if he works 1, 2, 3, 4, or 5 hours respectively.
Given that John can devote all 5 work hours to either activity, or he can divide the hours between activities, what is the largest amount of income he can earn for all 5 hours?
Enter a whole number with no dollar sign.
63
In the week before Valentine’s Day there is an increase in the supply of flowers in the supermarkets and there is an increase in the demand for flowers. We can expect the price of flowers to (INCREASE, UNCERTAIN, DECREASE) and the quantity of flowers sold to (INCREASE, UNCERTAIN, DECREASE)
increase, increase
Which of the following would cause a leftward shift of the demand curve?
an increase in the price of a complementary good
an increase in the price of a substitute good
an increase in the price of the good
a decrease in the cost of producing the good
A
A new research study claims organic chicken is much healthier than non-organic chicken. If numerous people believe this study then in the short term we can expect there to be
an increase in the supply of organic chicken.
an increase in the demand for organic chicken.
a decrease in the demand for organic chicken.
a decrease in the supply of organic chicken.
B
Which of the following best illustrates the idea of economic growth?
being able to consume on the production possibilities frontier
an outward shift of the production possibilities frontier
an inward shift of the production possibilities frontier
being able to produce on the production possibilities frontier
B
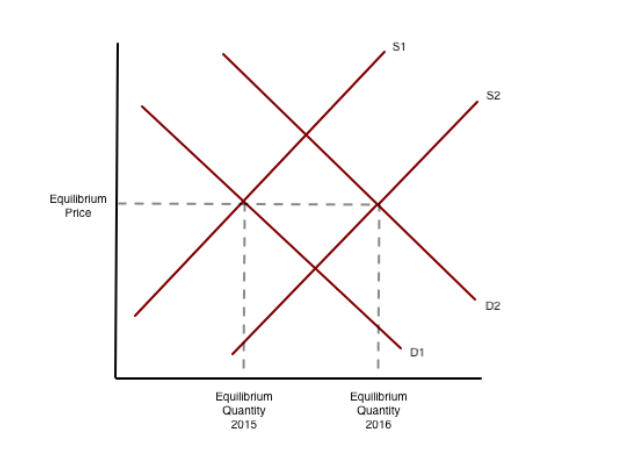
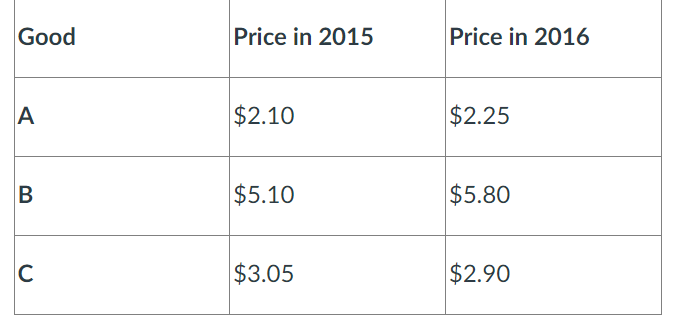
Based on the graph, what is the best explanation for what happened between 2015 and 2016?
The price of a complementary good increased and more firms began to produce the good
Income fell in this market for an inferior good and several firms went out of business
More buyers entered this market and the cost of producing this good increased
The price of a substitute good increased and the cost of producing this good decreased
D
George is trying to decide how to spend his Sunday afternoon. He could go to the library and study or he could go to the gym and work out. This is
not an economic problem because neither activity costs money.
an economic problem only if George has no other time to study.
an economic problem because a choice must be made.
not an economic problem because George could elect to spend half the afternoon at the gym and half the afternoon studying.
C
John works part-time for a moving company and earns a total of $135 each weekend. Next weekend a friend has invited him on a cruise that will cost him a total of $394. If he goes on the trip he will not be able to work.
What is John’s explicit cost of going on the trip?
Enter a whole number with no dollar sign.
394
A country should specialize in producing the goods for which
it can produce a larger quantity than any other country.
it has a comparative advantage.
it has the highest opportunity cost.
it has an absolute advantage.
B
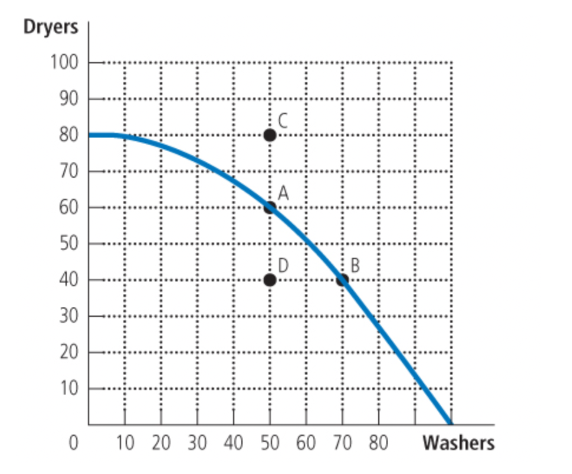
Consider the production possibilities frontier below where dryer production is measured on the vertical axis and washer production is measured on the horizontal axis.
When the country moves from point A to point B what is the opportunity cost of producing one more washer?
Enter a number rounded to the nearest whole number.
1
Assume the GDP deflator falls from 162 to 157. This means that
nominal GDP is decreasing.
real GDP is decreasing.
the average price level is growing more slowly.
the average price level has fallen.
D
Consider a country that has a positive rate of inflation each year. The base year used to calculate real GDP is 2012.
Nominal GDP for 2012 will be … than real GDP in 2012. (greater than, less than, the same as)
Nominal GDP for 2013 will be … than than real GDP in 2013. (greater than, less than, the same as)
the same as, greater than
The investment category of GDP has three components. They are
stocks, bonds, and mutual funds.
purchases of durable goods, purchases of intermediate goods, and inventory investment.
purchases of new capital, residential investment, and inventory investment.
government investment, business investment, and financial investment.
C
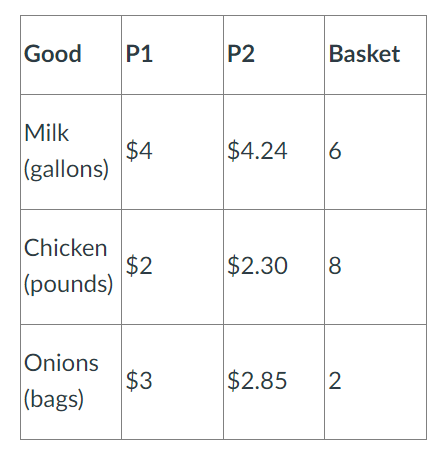
Three goods are consumed in an economy during years 1 and 2. The table shows prices (P1 and P2) for each good, and it shows the market basket that is used to calculate the consumer price index.
The base year is year 1.
Enter numbers in each blank, rounded to two decimal places as necessary. Do not enter commas or percent signs.
The value of the CPI in year 1 is … and the value of CPI in year 2 is …
The overall inflation rate is …%
…
The salary John’s grandfather earned in 1962 is a
real value.
cost of living adjusted value.
purchasing power parity adjusted value.
nominal value.
D
You lend $1,000 to a friend and he agrees to pay you back the $1,000 next year plus he will pay you interest of 8%.
Next year your friend must pay you back a total of $…
If the inflation rate is 3%, then in real terms how much extra money will you have after your friend pays you back? $…
Enter whole numbers with no other characters.
1080, 50
The consumer price index rises from 246 to 268. How much of an increase in pay (measured in percentage terms) should you receive in order to keep your real income fixed?
Enter a number rounded to two decimal places. Do not enter a percent sign.
8.94
John is a farmer who produces milk. In the current year John produces milk valued at $300,000, half of which he sells directly to consumers, and half of which he sells to TastyIce. TastyIce produces ice cream and sells it to consumers for $450,000.
What is the value of GDP in this simple economy?
Enter a whole number with no commas and no dollar sign.
600000
Which of the following can lead to an increase in real output? Check all that apply.
There has been an increase in inflation
The labor force increases
There are more factories producing goods
There has been an increase in average labor productivity
B, C, D
A ton of cloth purchased by the factory to produce t-shirts would be best described as
a final good.
a capital good.
a used good.
an intermediate good.
D
A country has GDP per capita equal to $2,500. If this country’s GDP per capita increases at a rate of 2% per year then about how many years will it take for GDP per capita to equal $20,000?
140
280
105
35
C
70 / 2 = 35
How many times does the economy double from 2500 to 20000? Three times. 3 × 35 = 105
Mary graduated from college and found a job making an annual salary of $44,000. When Mary retired from her job forty years later she was earning an annual salary of $82,000. During her forty-year career, the consumer price index increased from 122.5 to 220.5.
Across the forty-year period, Mary’s nominal salary ______ and Mary’s real salary ______.
increased : increased
decreased : increased
decreased : decreased
increased : decreased
A
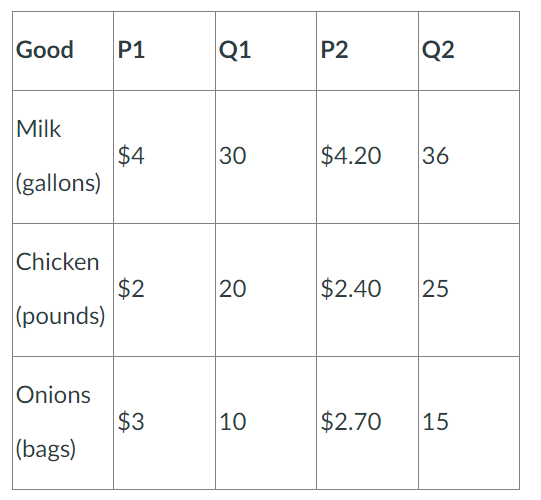
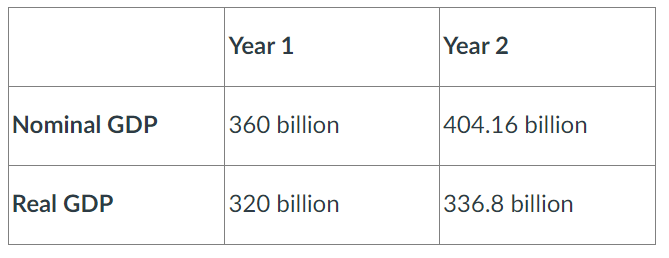
Three goods are produced and consumed in an economy during years 1 and 2. The table shows prices (P1 and P2) for each good and the quantities produced (Q1 and Q2) for each good. The base year is year 1.
Enter numbers in each blank rounded to two decimal places as necessary.
Do not enter commas or percent signs.
Nominal GDP in year 1 is $
Nominal GDP in year 2 is $
Real GDP in year 1 is $
Real GDP in year 2 is $
190, 251.70, 190, 239
The price of gas in 1987 was $1.09 per gallon and in 2006 it was $2.01.
The price index in 1987 was 129 and in 2006 it was 207.
Based on this information, calculate the 1987 real price of gas measured in 2006 dollars.
Enter a number rounded to two decimal places.
1.75
Suppose that in 1960 Joe's grandfather had a starting salary of $20,000 per year. In 2013 Joe graduated from college, got a job, and had a starting salary of $40,000. Which of the following is true?
Joe is worse off because there has been inflation since 1960.
You need to know the CPI value in each of the two years to figure out who is better off.
Joe is better off because his starting salary is higher.
You need to know the inflation rate in each of the two years to figure out who is better off.
B
A price index measures:
the base cost of a fixed quantity of goods divided by the current cost of a fixed quantity of goods.
expenditure in a base year divided by expenditure in the current year.
the current cost of a fixed quantity of goods divided by the base cost of a fixed quantity of goods.
expenditure in the current year divided by expenditure in a base year.
C
Identify the contribution to this year’s GDP by entering a numerical value.
Do not enter dollar signs or commas. Enter whole numbers.
Joe sells the house he has lived in for 10 years for $300,000 and pays his real estate agent a 4% commission: $…
John buys a new car that was built last year at a cost of $10,000, but was never sold. He pays $15,000. $…
Brian sells a textbook to his friend for $150 (he paid $300 for the textbook the previous year). $….
Sue pays $1,000 for a government bond. $….
Company X produces 10 units at a cost of $6 each and sells 8 of them for $6.50 each. $….
0,
A country’s Gross Domestic Product (GDP) is best defined as
the cost of producing all final goods and services sold during a given year.
the market value of all final goods and services sold during a given year.
the market value of all final goods and services produced during a given year.
the cost of producing all final goods and services produced during a given year.
C
If real GDP increases at a rate of 2% per year and the population grows at a rate of 3% per year, what happens to real GDP per capita?
It decreases
It increases
It is impossible to say
It stays the same
A
Bob makes $75,000 per year. The price index increases from 232.0 to 243.6.
The inflation rate is equal to ____ and his employer should give him a raise equal to ____ in order to keep his real wage constant.
11.6% : $8,700
7.56% : $5,670
5% : $3,750
5.8% : $4,350
C
When measuring the inflation rate it is best to calculate:
the percentage change in consumer expenditures from month to month.
the percentage change in nominal GDP from month to month.
the percentage change in the cost of a fixed basket of goods from month to month.
the percentage change in real GDP from month to month.
C
The income approach to computing GDP calculates
revenue minus cost of intermediate goods
wages + interest + rent + profits.
consumption + investment + government purchases + net exports.
wages + interest + cost of intermediate goods + taxes + profit.
B
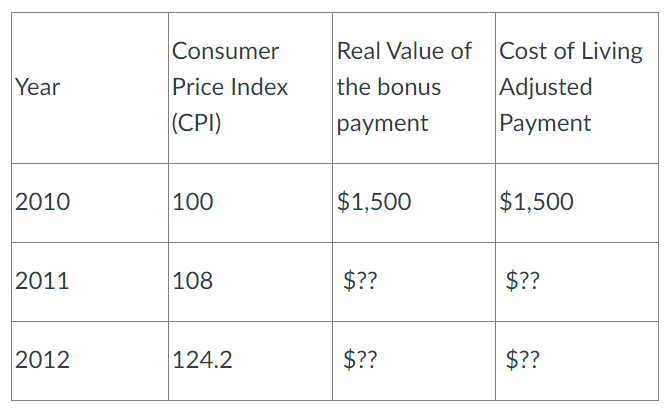
Use the table to answer the following.
An individual is paid a bonus of $1,500 per year for each of three years.
If you were to calculate the real value of the bonus payment in 2011 and 2012 measured in 2010 dollars then you would expect these values to be … than $1,500.
If you were to calculate the cost of living adjusted payment in 2011 and 2012 then you would expect these values to be … than $1,500.
less, greater
In 1988 the value of RGDP was $8,575.01 billion and the population was 257.35 million. What was the value of real GDP per capita?
Round to two decimal places. Do not enter a dollar sign.
33,320.42
If a firm does not sell all of the goods that it produces in a given time period then
they do not count in GDP for that time period.
they count negatively in GDP as inventory investment.
they do not count in GDP.
they count positively in GDP as inventory investment.
D
Joe buys 10 units of good A, 5 units of good B, and 10 units of good C.
Fred buys 10 units of good A, 10 units of good B, and 5 units of good C.
Which of these two people feels like the inflation rate is higher?
C
The farmer produces wheat and sells it to the Flour Factory for $900.
The Flour Factory produces 500 pounds of flour from the wheat at a total cost of $2 per pound (including the amount paid to the farmer for the wheat).
The Flour Factory sells 475 pounds of flour to consumers for $3 per pound. They add the 25 unsold pounds to inventory.
Find the value added by the Flour Factory.
Enter a number rounded to two decimal places as necessary.
575
The government wants real GDP per capita to double in 14 years. If population is expected to grow by 1% per year then real GDP must grow by ___ per year.
4%
7%
6%
5%
A
70 / 14 = 5%
Growth rate of real GDP per capita=Growth rate of real GDP−Growth rate of population
5% = X + 1%
4% = X
The rate of inflation over the last two years has averaged 2% per year. At the same time, John feels like he is able to purchase fewer goods and services with his annual salary. Therefore:
Both John’s nominal and real salaries must have declined
John’s nominal salary must have declined
John must not have received any pay raises
John’s real salary must have declined
D
When calculating real GDP from year to year, which is true?
We hold prices fixed at a base year level.
We hold quantities fixed at a base year level.
We increase nominal GDP by the rate of inflation.
We divide currrent year prices by base year prices and then multiply by the quantity produced.
A
Does each of the following transactions count in GDP?
Linda visits the dentist and pays $250
yes
Does each of the following transactions count in GDP?
The government sends $1 million to low income families for food assistance
no
Does each of the following transactions count in GDP?
The government spends $5 million on teacher salaries
yes (service is provided by teachers) …
Does each of the following transactions count in GDP?
UCF buys a new computer from the Apple store
no (intermediate good)
Does each of the following transactions count in GDP?
You win the lottery and receive $500
no
Does each of the following transactions count in GDP?
Bill goes to the mall and spends $200 on clothing made in China
no
Does each of the following transactions count in GDP?
Bob volunteers at a food bank.
no
John B. Retired owns a house on a 10-acre lot filled with apple trees. Each year he hires a few workers to pick the apples and he sells them to Betty’s Pies for $4,000. Betty uses the apples to makes pies that she sells for $9,000 to local restaurants. The local restaurants sell the pies (by the slice) to consumers for $12,000.
As a result of these transactions GDP increases by $[x].
Enter a whole number. Do not enter any other characters.
12000
Median household income in 1970 was $8,600 and the CPI that year had a value of 39.
Median household income in 1990 was $29,500 and the CPI that year had a value of 132.
Across this time period, what happened to real median household income?
It remained the same
It increased
It decreased
B
We want to compare the well being of the average person in Country A in comparison to Country B. What measure should we focus on?
The inflation rate
Real GDP
Real GDP per capita
Consumption spending
C
The stock of equipment and structures that are used to produce goods and services is called
technology.
investment.
productivity.
physical capital.
D
When we add up the value of consumption, investment, government purchases, and net exports this is known as the
income approach.
value added approach.
production approach.
expenditure approach.
B
To calculate the rate of inflation between the two years what should we calculate?
the percentage change in real GDP
the GDP deflator for each year
the percentage change in nominal GDP
this is not possible because we don't know the CPI
B
Brenda uses all of the following resources to prepare delicious breakfast meals at her café. Which of them is an example of human capital?
Brenda's unique recipes
advertising
the $50,000 Brenda invested when she started the business
furniture and kitchen equipment
A
The growth rate of real GDP was 4% in 2022. In 2023 the growth rate of real GDP was 2%.
What can we infer?
The price level is falling.
The economy is in a recession.
The level of production is growing more slowly.
The level of production has fallen.
C
The level of production is growing more slowly: This is a correct inference. A decline in the growth rate of real GDP from 4% to 2% indicates that while the economy is still growing, the rate at which production is increasing has slowed down.
The level of production has fallen: This is incorrect. The real GDP growth rate being positive (2% in 2023) implies that the overall production level has increased from the previous year, not decreased.
The government spending category (G) of GDP includes
all government expenditures.
all government expenditures on new final goods and services.
all government expenditures except interest payments.
all government expenditures and taxes.
B
During each recession, potential GDP falls.
False
If oil prices increase by 20%, there is a supply shock.
True
Real GDP can never greater than potential GDP.
False
The last recession in the United States began in December 2007
True (as of 2023)
Congress meets every 6-8 weeks to discuss the performance of the economy and potential changes to fiscal policy
False
If total government spending in a given year was 3.7 trillion, then all of this spending counts directly in GDP as part of the G category
False
All else the same, an increase in income in the US leads to a decrease in our net exports
True
When foreign countries experience an increase in income, this is likely to increase out GDP
True
During a recession, the Federal Reserve is most likely to sell government bonds to the public
False
When the Federal Reserve buys government bonds, interest rates are likely to Fall. Therefore, they wouldnt sell bonds, thus increasing interest. They would buy them.
When the Federal Reserve buys government bonds, interest rates are likely to Fall
True
Total spending in the economy is equal to
C+I+G-NX
False, its +NX
Movements of Real GDP around Potential GDP are called the business cycle
True