Climate change - Chapter 12
1/23
There's no tags or description
Looks like no tags are added yet.
Name | Mastery | Learn | Test | Matching | Spaced | Call with Kai |
|---|
No analytics yet
Send a link to your students to track their progress
24 Terms
Climate change
A long-term shift in the climate of a location, region, or the entire planet. Broader than global warming, which refers only to rising surface temperatures, not conditions becoming more extreme.
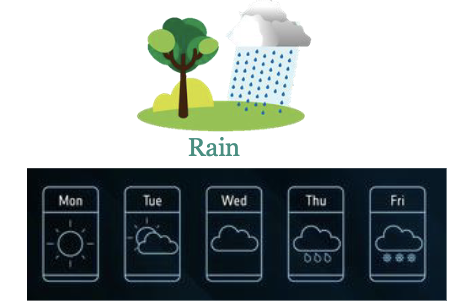
weather (“mood”; “outfit”)
Condition of the atmosphere at a specific WHAT and WHAT
WHAT-term (hours to days)
Expressed by temperature, precipitation, humidity, wind
weather (“mood”; “outfit”)
Condition of the atmosphere at a specific TIME and PLACE
SHORT-term (hours to days)
Expressed by temperature, precipitation, humidity, wind
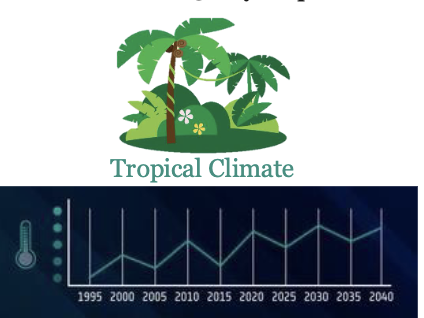
Climate (“personality”; “wardrobe”)
Composite of day-to-day weather conditions over WHAT
Includes WHAT shifts and the full range of extremes
Measured over WHAT+ year periods
Climate (“personality”; “wardrobe”)
Composite of day-to-day weather conditions over DECADES
Includes SEASONAL shifts and the full range of extremes
Measured over 30+ year periods
IPCC (intergovernmental panel on climate change)
The UN body for assessing climate science. Founded 1988, 195 member countries. Assessment reports synthesize drivers, impacts, and options across Shared Socioeconomic Pathways
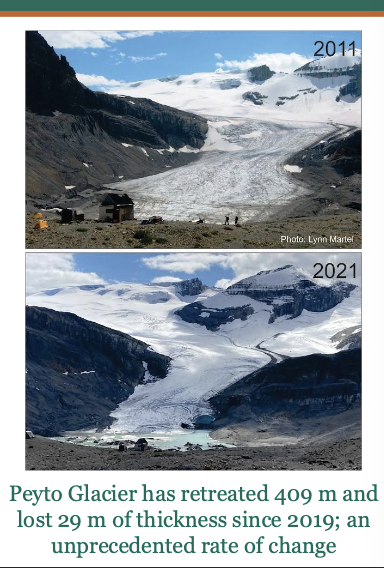
Glacial retreat and sea level rise
Glaciers are among the clearest WHAT indicators of climate change; their retreat is unambiguous and fast
Warmer temperatures melt mountain glaciers and polar ice sheets, especially at WHAT
Greenland losing ~170 Gt/year; Antarctica ~150 Gt/year (Gt = gigaton = 1 Billion tons = 1 km3 of ice)
WHAT is very likely the main driver of global glacier retreat since the 1990s’ — IPCC 2023
Glacial retreat and sea level rise
Glaciers are among the clearest VISIBLE indicators of climate change; their retreat is unambiguous and fast
Warmer temperatures melt mountain glaciers and polar ice sheets, especially at HIGHER LATITUDES
Greenland losing ~170 Gt/year; Antarctica ~150 Gt/year (Gt = gigaton = 1 Billion tons = 1 km3 of ice)
HUMAN INFLUENCES is very likely the main driver of global glacier retreat since the 1990s’ — IPCC 2023
Glacial retreat and sea level rise
consequences:
WHAT rose - 100 mm since 1993 and accelerating
Low-lying cities and entire islands nations face existential risk by 2100
Glacial retreat and sea level rise
consequences:
GLOBAL SEA LEVEL rose - 100 mm since 1993 and accelerating
Low-lying cities and entire islands nations face existential risk by 2100
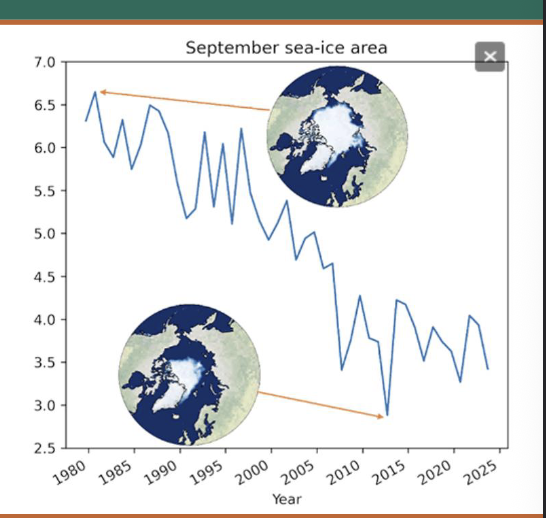
Arctic Sea Ice Melt
Frozen ocean water that forms and melts seasonally across the Arctic Ocean.
Covers >7M km² at its summer minimum and >15M km² in winter.
September minimum extent has declined ~13% per decade since 1979.
Feedback loop: loss of WHAT (reflection) → ocean absorbs more WHAT → further WHAT
Loss of WHAT (polar bears, seals, penguins)
Arctic Sea Ice Melt
Frozen ocean water that forms and melts seasonally across the Arctic Ocean.
Covers >7M km² at its summer minimum and >15M km² in winter.
September minimum extent has declined ~13% per decade since 1979.
Feedback loop: loss of ALBEDO (reflection) → ocean absorbs more HEAT → further WARMING
Loss of HABITAT (polar bears, seals, penguins)
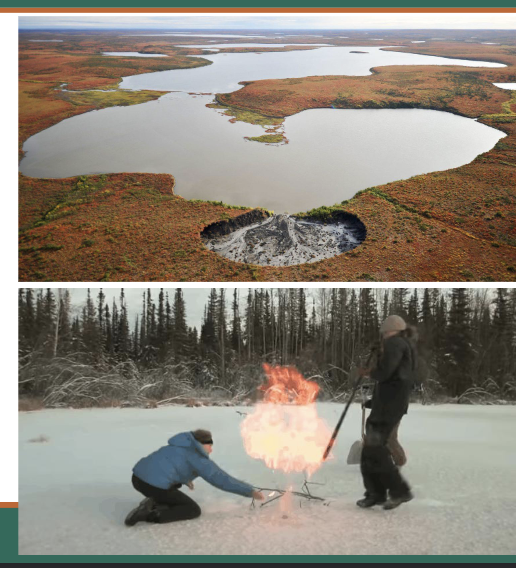
Permafrost thaw
Ground that remains frozen for > WHAT years.
Underlies ~24% of the Northern Hemisphere’s land surface.
Stores ~1,500 Gt of carbon = ~2x what is currently in the atmosphere.
Thawing releases WHAT and WHAT (methane = 80× more potent than CO₂)
Feedback loop: thaw → emissions → more warming → more thaw
WHAT landscapes and infrastructure
Thermokarst lakes can burn because they release flammable WHAT from thawing permafrost
Permafrost thaw
Ground that remains frozen for > 2 years.
Underlies ~24% of the Northern Hemisphere’s land surface.
Stores ~1,500 Gt of carbon = ~2x what is currently in the atmosphere.
Thawing releases CO₂ and CH₄ (methane = 80× more potent than CO₂)
Feedback loop: thaw → emissions → more warming → more thaw
DESTABILIZES landscapes and infrastructure
Thermokarst lakes can burn because they release flammable METHANE from thawing permafrost
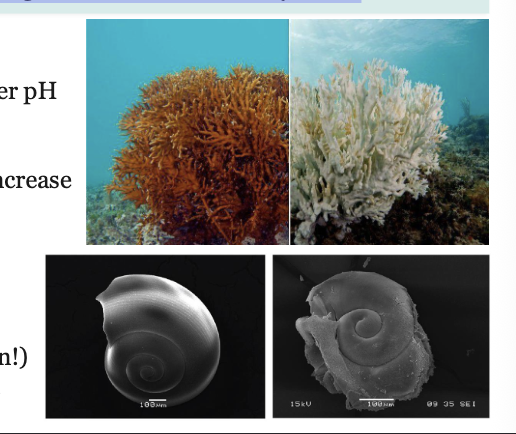
Ocean acidification
The ongoing decrease in ocean pH as excess CO₂ is absorbed, producing H⁺ ions that convert carbonate into forms unavailable directly affecting shell-forming organisms and indirectly impacting broader marine ecosystems
Ocean acidification
The chemistry: CO₂ + H₂O → forms carbonic acid → H⁺ ions → lower pH
What’s changing:
Since 1750, pH has dropped from 8.2 to 8.1 = 26% increase in acidity (log scale).
By 2100 on current trajectory: ~7.95 = 41% increase
Why it matters:
Corals are weak or fail to build their WHAT
Shells become WHAT, WHAT, or even WHAT (plankton!)
Affects WHAT systems and WHAT of some fish
Ocean acidification
The chemistry: CO₂ + H₂O → forms carbonic acid → H⁺ ions → lower pH
What’s changing:
Since 1750, pH has dropped from 8.2 to 8.1 = 26% increase in acidity (log scale).
By 2100 on current trajectory: ~7.95 = 41% increase
Why it matters:
Corals are weak or fail to build their SKELETONS
Shells become WEAK, THIN, or even DISSOLVE (plankton!)
Affects SENSORY systems and METABOLISM of some fish
What are the four biological responses to climate change
WHAT
WHAT
WHAT
WHAT
What are the four biological responses to climate change
Phenology
Range shifts
Ecosystems cascades
Human health
Phenology
The TIMING of seasonal life-cycle events (when flowers bloom, birds migrate, insects hatch) and how they respond to environmental conditions)
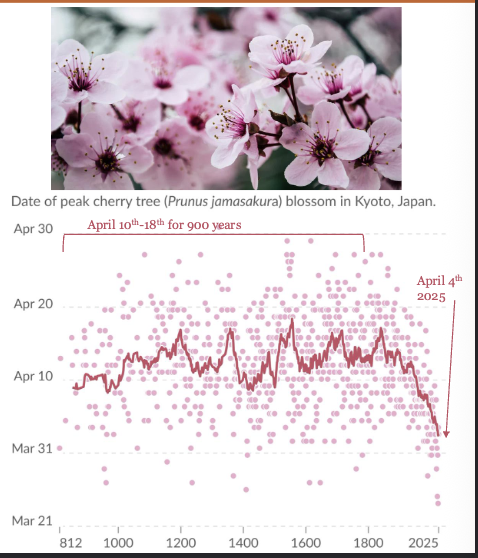
Phenology example
Cherry blossom (Prunus jamasakura) flowering in Kyoto has been recorded since the 9th century = one of the longest continuous biological records on Earth
Stable for 900 years: peak flowering varied within a ~8-day window across nearly a millennium.
Rapid shift: peak flowering now occurring WHAT. March 26, 2021 = earliest date in 1,200 years.
Temperature is the driver: increasing March WHAT explain ~87% of the variance
Phenology example
Cherry blossom (Prunus jamasakura) flowering in Kyoto has been recorded since the 9th century = one of the longest continuous biological records on Earth
Stable for 900 years: peak flowering varied within a ~8-day window across nearly a millennium.
Rapid shift: peak flowering now occurring EARLIER. March 26, 2021 = earliest date in 1,200 years.
Temperature is the driver: increasing March TEMPERATURES explain ~87% of the variance

Phenological mismatch
When seasonal events shift OUT OF SYNC between species and their key resources (eg breeding no longer aligns with food availability)
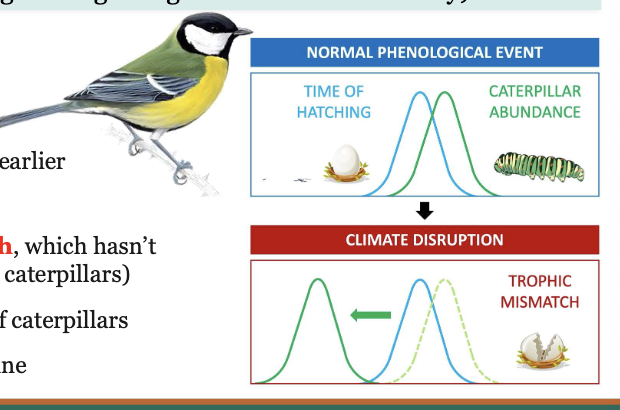
Phenological mismatch example
The Changes
Temperature rises earlier in spring
Oak leaves bud earlier
Winter moth caterpillars hatch ~18 days WHAT
The mismatch
Great tit egg-laying is cued by day length, which WHAT changed, so it lags behind (~11 days after caterpillars)
Chick hatching misses the narrow peak of caterpillars
Chick survival and breeding success WHAT
A mismatch of 11 days between caterpillar peak and chick hatching can WHAT breeding success
Phenological mismatch example
The Changes
Temperature rises earlier in spring
Oak leaves bud earlier
Winter moth caterpillars hatch ~18 days EARLIER
The mismatch
Great tit egg-laying is cued by day length, which HASN’T changed, so it lags behind (~11 days after caterpillars)
Chick hatching misses the narrow peak of caterpillars
Chick survival and breeding success DECLINE
A mismatch of 11 days between caterpillar peak and chick hatching can HALVE breeding success

Range shift
Animals, plants, and pests are tracking their climate envelopes poleward and upward. Novel communities with no evolutionary history are forming
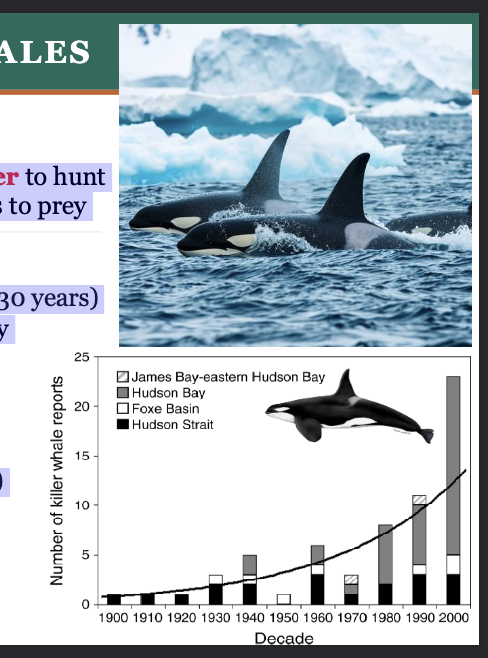
Range shift example
Killer whales are moving into the Arctic
Killer whales have large dorsal fins, need WHAT water to hunt
Historically, dense sea ice limited WHAT and access to WHAT
What’s Changing?
Killer whales now routinely observed in the Arctic (last 30 years)
Loss of sea ice allows access to previously protected prey
Consequences
Increased predation on naïve species (walrus, bowhead)
Killer whales encounter new threats (noise, pollutants)
Shifts in Arctic food webs
Impacts on Indigenous hunting
Range shift example
Killer whales are moving into the Arctic
Killer whales have large dorsal fins, need OPEN water to hunt
Historically, dense sea ice limited MOVEMENT and access to PREY
What’s Changing?
Killer whales now routinely observed in the Arctic (last 30 years)
Loss of sea ice allows access to previously protected prey
Consequences
Increased predation on naïve species (walrus, bowhead)
Killer whales encounter new threats (noise, pollutants)
Shifts in Arctic food webs
Impacts on Indigenous hunting
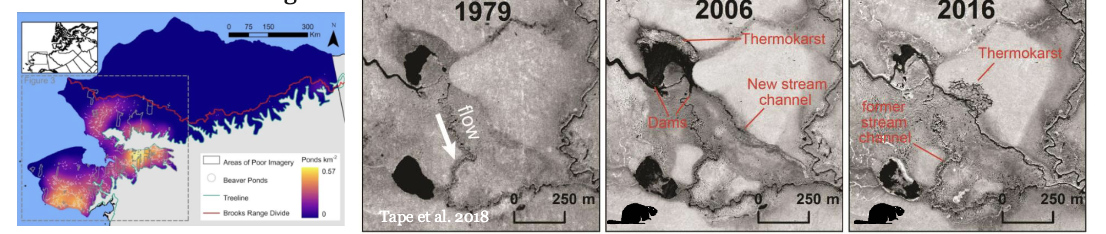
Range shift example on shrubs and beavers
What’s happening: warming is driving shrub expansion across the tundra
Direct impact: open tundra species lose WHAT and WHAT; less snow → less albedo → warming
Range shift: shrubs create habitat and food for WHAT, beavers are expanding north
Ecosystem engineering: beaver dams create new WHAT ( > 10,000 in Alaska since the 2000s); ponds WHAT ground and alter hydrology (block and reroute rivers)
Climate feedback: warmer, wetter ground accelerates WHAT, stored CO2 and CH4 released = more warming
Range shift example on shrubs and beavers
What’s happening: warming is driving shrub expansion across the tundra
Direct impact: open tundra species lose HABITAT and FOOD; less snow → less albedo → warming
Range shift: shrubs create habitat and food for BEAVERS, beavers are expanding north
Ecosystem engineering: beaver dams create new PONDS ( > 10,000 in Alaska since the 2000s); ponds WARM ground and alter hydrology (block and reroute rivers)
Climate feedback: warmer, wetter ground accelerates PERMAFROST THAW, stored CO2 and CH4 released = more warming
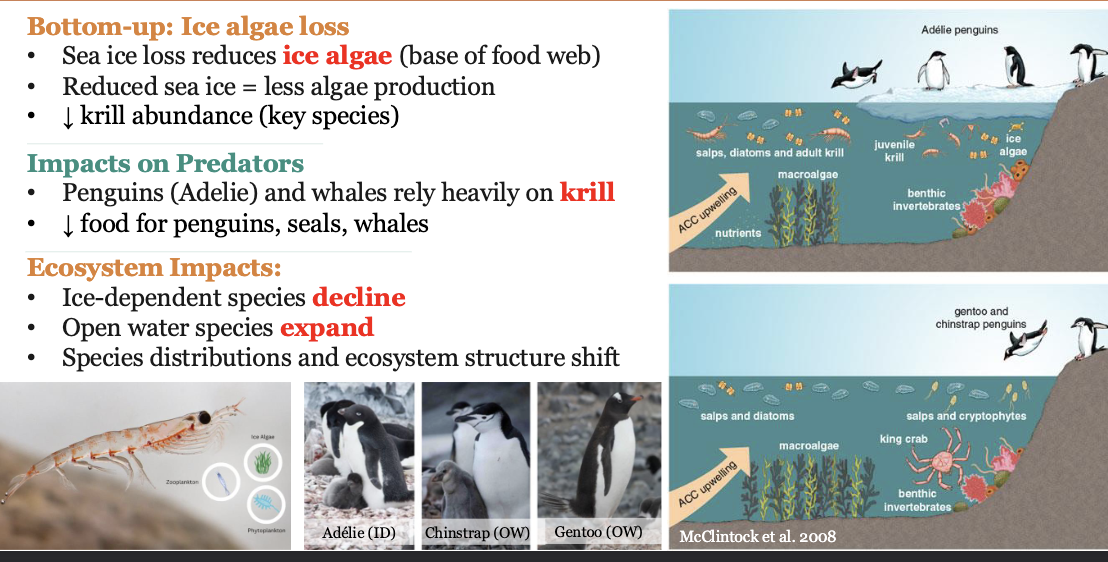
Ecosystems cascade: In arctic food webs
Bottom-up: Ice algae loss
Sea ice loss reduces ice WHAT (base of food web)
Reduced sea ice = less algae production
WHAT krill abundance (key species)
Impacts on Predators
Penguins (Adelie) and whales rely heavily on WHAT
WHAT food for penguins, seals, whales
Ecosystem Impacts:
Ice-dependent species WHAT
Open water species WHAT
Species distributions and ecosystem structure shift
Ecosystems cascade: In arctic food webs
Bottom-up: Ice algae loss
Sea ice loss reduces ice ALGAL (base of food web)
Reduced sea ice = less algae production
DECREASE krill abundance (key species)
Impacts on Predators
Penguins (Adelie) and whales rely heavily on KRILL
DECREASE food for penguins, seals, whales
Ecosystem Impacts:
Ice-dependent species DECLINE
Open water species EXPAND
Species distributions and ecosystem structure shift
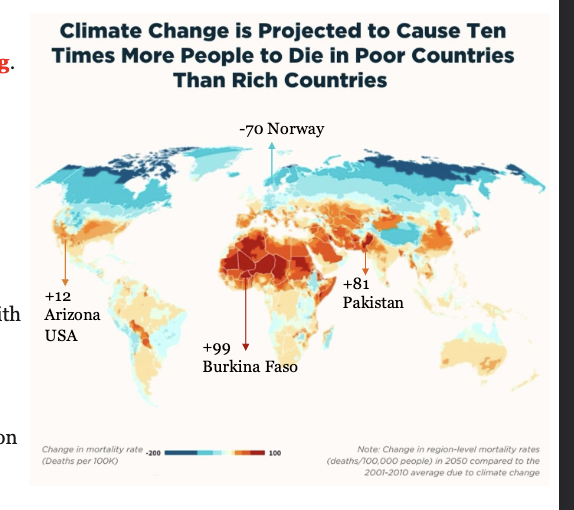
Indigenous communities are on the front line, experiencing the WHAT and most WHAT impacts.
Those least responsible for climate change face the greatest WHAT; it is both an WHAT and WHAT justice crisis
Indigenous communities are on the front line, experiencing the EARLIEST and most SEVERE impacts.
Those least responsible for climate change face the greatest CONSEQUENCES; it is both an ECOLOGICAL and SOCIAL justice crisis
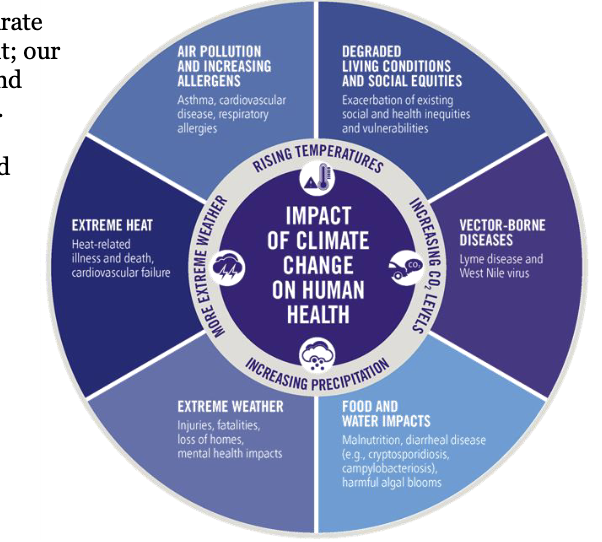
Extreme heat
Deadliest weather-related killer in many regions. Heat events more WHAT, more WHAT, longer-lasting. Mortalities deeply unequal within and between countries.
The 2003 European heat wave:
~70,000 excess deaths across Europe in 6 weeks. A ‘once-in-500-year’ event now projected to occur once every 40 years.
Who is most vulnerable:
outdoor workers, people in densely populated cities, the elderly, people with health conditions, and low-income and racialized communities with less access to cooling.
Projections:
annual heat-related deaths in European cities alone projected to WHAT 10-fold by 2100 without mitigation Global burden falls disproportionately on the Global South
Extreme heat
Deadliest weather-related killer in many regions. Heat events more FREQUENT, more INTENSE, longer-lasting. Mortalities deeply unequal within and between countries.
The 2003 European heat wave:
~70,000 excess deaths across Europe in 6 weeks. A ‘once-in-500-year’ event now projected to occur once every 40 years.
Who is most vulnerable:
outdoor workers, people in densely populated cities, the elderly, people with health conditions, and low-income and racialized communities with less access to cooling.
Projections:
annual heat-related deaths in European cities alone projected to INCREASE 10-fold by 2100 without mitigation Global burden falls disproportionately on the Global South
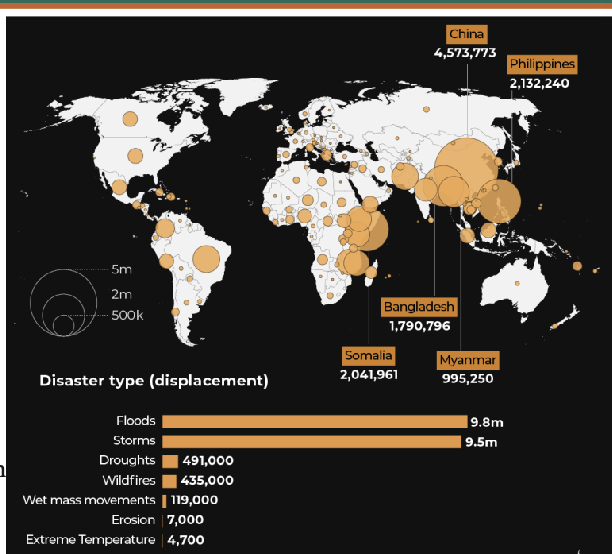
Climate displacement
The World Bank projects 216 million climate migrants by 2050 from crop failure, water scarcity, sea level rise, and extreme heat.
Pacific island nations (Tuvalu, Kiribati) face complete inundation.
Bangladesh facing sea level rise, cyclones, and flooding.
Somalia facing multi-year droughts, crop failures, livestock loss.
‘Climate refugee’ has no WHAT under international law; a governance gap with enormous human consequences
Climate displacement
The World Bank projects 216 million climate migrants by 2050 from crop failure, water scarcity, sea level rise, and extreme heat.
Pacific island nations (Tuvalu, Kiribati) face complete inundation.
Bangladesh facing sea level rise, cyclones, and flooding.
Somalia facing multi-year droughts, crop failures, livestock loss.
‘Climate refugee’ has no LEGAL RECOGNITION under international law; a governance gap with enormous human consequences
Mitigation
Actions that REDUCE or PREVENT GREENHOUSE GAS emissions or enhance their removal from the atmosphere.
Mitigation
Carbon pricing: carbon tax (direct fee per tonne CO₂), cap-and-trade (legal limit on total emissions; companies buy and sell permits) = financial incentive to WHAT
Technology: renewable energy (solar, wind, geothermal), electric vehicles and grid storage, carbon capture and storage; better urban design (insulation, walkable cities)
Natural climate solutions: protecting tropical forests; peatland protection; reforestation; blue carbon (mangroves, seagrasses sequester 3–5× more carbon/ha than forests). *most effective
Global Agreements and Climate Targets: Kyoto (1997): first binding treaty; developed nations only; limited impact. Paris (2015): 196 signatories; voluntary NDCs; ‘well below 2°C’. In 2019 Trump removed the US
Criticisms: no WHAT binding targets, no enforcement; emissions have continued to WHAT since
Mitigation
Carbon pricing: carbon tax (direct fee per tonne CO₂), cap-and-trade (legal limit on total emissions; companies buy and sell permits) = financial incentive to REDUCE EMISSIONS
Technology: renewable energy (solar, wind, geothermal), electric vehicles and grid storage, carbon capture and storage; better urban design (insulation, walkable cities)
Natural climate solutions: protecting tropical forests; peatland protection; reforestation; blue carbon (mangroves, seagrasses sequester 3–5× more carbon/ha than forests). *most effective
Global Agreements and Climate Targets: Kyoto (1997): first binding treaty; developed nations only; limited impact. Paris (2015): 196 signatories; voluntary NDCs; ‘well below 2°C’. In 2019 Trump removed the US
Criticisms: no LEGALLY binding targets, no enforcement; emissions have continued to RISE since