Modern Climate
1/40
There's no tags or description
Looks like no tags are added yet.
Name | Mastery | Learn | Test | Matching | Spaced | Call with Kai |
|---|
No analytics yet
Send a link to your students to track their progress
41 Terms
PQS10.1. DESCRIBE the major features of the Holocene climate and IDENTIFY the natural drivers responsible for these climate variations
The Holocene thermal maximum was
(a)had warmer summers than the pre-industrial period
(b)2°C warmer on average than the pre-industrial period
(c)had warmer winters than the pre-industrial period
(d)colder on average than the pre-industrial period
(e)was warmer in the Northern Hemisphere
The Holocene thermal maximum was
(a)had warmer summers than the pre-industrial period
(e)was warmer in the Northern Hemisphere
PQS10.2. DESCRIBE the major features of the Holocene climate and IDENTIFY the natural drivers responsible for these climate variations
The Holocene thermal maximum was caused by:
A change in orbital forcing.
PQS10.3. DESCRIBE the major features of the Holocene climate and IDENTIFY the natural drivers responsible for these climate variations
The term “Holocene” describes
The last 10,000 years
PQS10.3. DESCRIBE the major features of the Holocene climate and IDENTIFY the natural drivers responsible for these climate variations
Volcanic forcing over the last 1,000 years has caused:
widespread cold anomalies that lasted a few years
Climate Proxy
Evidence in the natural world of past climatic conditions.
PQS10.5. GIVE EXAMPLES of climate proxies and DESCRIBE how they can be used to reconstruct past climates
Which ones of these proxy can be used to reconstruct climate at annual resolution?
ice core isotope O18
coral isotope O18
tree rings
Temperature over the last 2,000 years:
What drives climate variability on these timescales?
volcanism
Change the amount of solar radiation received
Change in Albedo feedbacks
Greenhouse gas forcings-change the amount of greenhouse gases trapping infrared heat.
PQS10.6. COMPARE today’s temperature & atmospheric CO2 concentration AND the rates of change of these quantities to times in the past
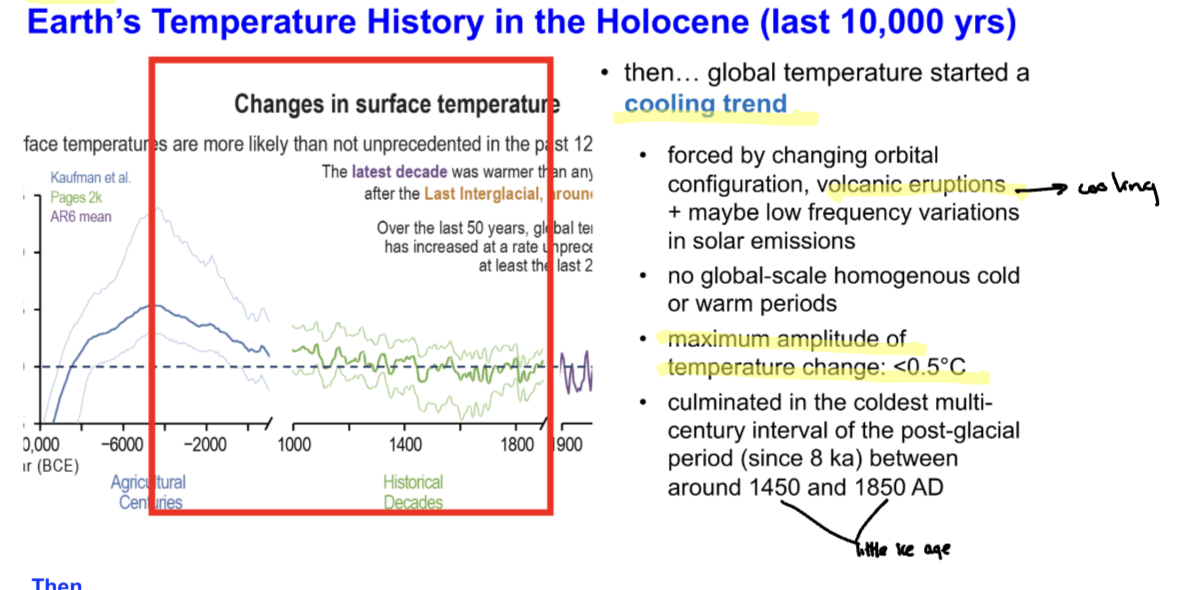
the last 50 years have been warming faster than any period in the past 2,000 years
the last 10 years were warmer than any multi-century period since the last interglacial, ~125,000 years ago
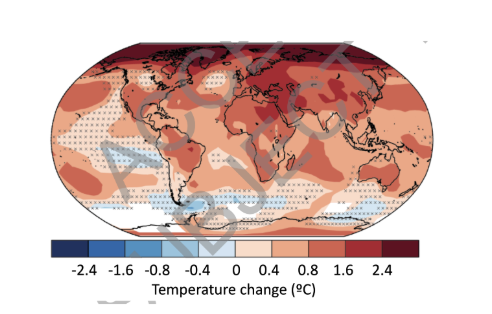
the spatial pattern of the recent warming trend is more uniform than in the past
PQS10.7. COMPARE today’s temperature & atmospheric CO2 concentration AND the rates of change of these quantities to times in the past
The last time the global temperature was as warm as the last 50 years is:
during the last interglacial period, 125,000 years ago

PQS10.8. COMPARE today’s temperature & atmospheric CO2 concentration AND the rates of change of these quantities to times in the past
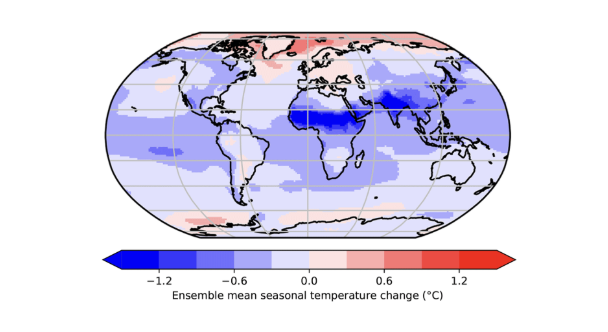
mid-Holocene mean annual temperature

PQS10.8. COMPARE today’s temperature & atmospheric CO2 concentration AND the rates of change of these quantities to times in the past
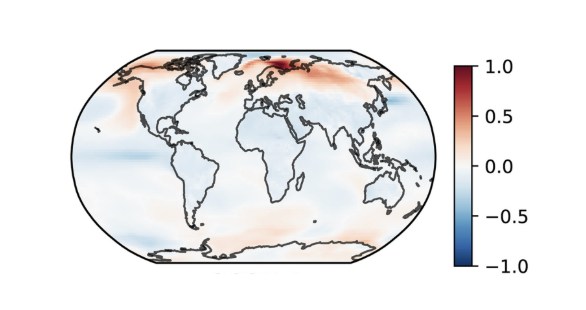
last millennium MCA-LIA

PQS10.8. COMPARE today’s temperature & atmospheric CO2 concentration AND the rates of change of these quantities to times in the past
1980-2020
PQS10.8. COMPARE today’s temperature & atmospheric CO2 concentration AND the rates of change of these quantities to times in the past
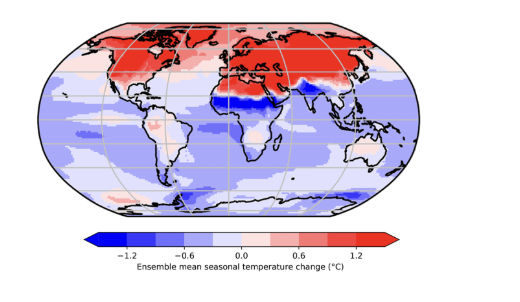
mid-Holocene June-July-August temperature
warming has concentrated in N. Hemisphere summer
Warmer N. Hemisphere summers→ a shift of the ITCZ northwards and a West African stringer monsoon (Sahara Desert was green).
PQS10.9. COMPARE today’s temperature & atmospheric CO2 concentration AND the rates of change of these quantities to times in the past
The average RATE of CHANGE of temperature ______
has increased over the past 150 years
PQS10.10. COMPARE today’s temperature & atmospheric CO2 concentration AND the rates of change of these quantities to times in the past
The record of atmospheric CO2 from the Vostok Ice Core records the concentration of atmospheric CO2 during the past four ice ages. It indicates that changes in atmospheric CO2 concentrations between ice ages and warm interglacial periods vary by:
about 100 ppm
110 ppm/10,000 years
PQS10.11. COMPARE today’s temperature & atmospheric CO2 concentration AND the rates of change of these quantities to times in the past
Since the start of the Industrial Revolution (~1750) atmospheric CO2 concentrations have increased by:
about 100 ppm
PQS10.12. COMPARE today’s temperature & atmospheric CO2 concentration AND the rates of change of these quantities to times in the past
The average RATE of CHANGE of CO2 atmospheric concentration in the most recent decade is ________.
about 100x the rate of change of atmospheric concentration between ice ages and warm interglacial periods
PQS10.13. ASSESS the plausibility that natural variability (e.g. solar and volcanic forcing) can explain the late 20th century/early 21st century global warming
Global average temperatures have risen in the past few decades. Which of the following correlates to that temperature rise? Choose all that apply.
(a)
An increase in Earth’s greenhouse effect due to less atmospheric CO2.
(b)
An increase in solar radiation due to more sunspots.
(c)
An increase in Earth’s greenhouse effect due to more atmospheric CO2 .
(d)
An increase in solar radiation due to fewer sunspots.
An increase in Earth’s greenhouse effect due to more atmospheric CO2 .
PQS10.14. ASSESS the plausibility that natural variability (e.g. solar and volcanic forcing) can explain the late 20th century/early 21st century global warming
The net climate forcing associated with human activities since 1750 compares to the climate forcing associated with natural changes in solar variability during this period in the following way:
The net climate forcing of human-caused warming exceeds warming by natural solar variability by a factor of 10.
PQS10.15. DESCRIBE and INTERPRET evidence supporting the idea that humans have a discernible influence on climate
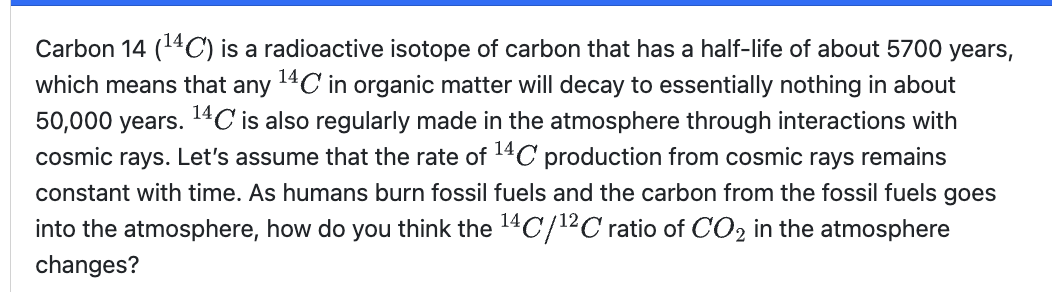
14C/12C decreases because burning fossil fuels would add no to the atmosphere but would add .
The Age of Fossil Fuels: Fossil fuels like coal and oil are millions of years old. Since Carbon-14 has a half-life of only 5,700 years, it completely decays away after about 50,000 years. Therefore, fossil fuels contain virtually no Carbon 14.
.
Trends in the change of Carbon-14=
Further evidence of fossil fuel burning.
Lots of the coal we burn today is from plants that lived about 300 million years ago. How much 14C would you expect to be in the coal?
none, or virtually none.
This is because C-14 decays with time and has a ½ like of 6,000 years.
What is happening the change in Carbon-14 in the atmosphere?
Carbon-14 is decreasing because of the addition of fossil fuels that have change in Carbon-14 ~ 0. This dilution is called the Suess effect.
The primary human activities that add CO2 to the atmosphere are burning fossil fuels and deforestation. How would you expect these activities to affect the ratio of Carbon-13/Carbon-12 in the atmospheric CO2?
13C-12C would decrease (get lighter)→ Suess effect
Plants and the organic matter derived from them (including fossil fuels) are enriched in the “lighter” isotope, Carbon-12 because photosynthesis preferentially utilizes it over the “heavier” Carbon-13.
The ratio of Carbon-13 to Carbon-12 in atmospheric CO2 decreases because these activities release carbon derived from plants, which is naturally enriched in the lighter Carbon-12 isotope.
PQS10.16. DESCRIBE and INTERPRET evidence supporting the idea that humans have a discernible influence on climate
Which types of climate models have been able to reproduce the observations of temperature changes since 1900?
Models that include both natural and human forcings.
PQS10.16. DESCRIBE and INTERPRET evidence supporting the idea that humans have a discernible influence on climate
Climate models that incorporate only natural forcing reproduce…
Climate models that incorporate only natural forcing reproduce the real climate record pretty well for the first part of the 20th century, but not the last part
PQS10.16. DESCRIBE and INTERPRET evidence supporting the idea that humans have a discernible influence on climate
Climate models that incorporate both natural and anthropogenic forcing reproduce…
Climate models that incorporate both natural and anthropogenic forcing reproduce the real climate record better than models that only include natural forcing.
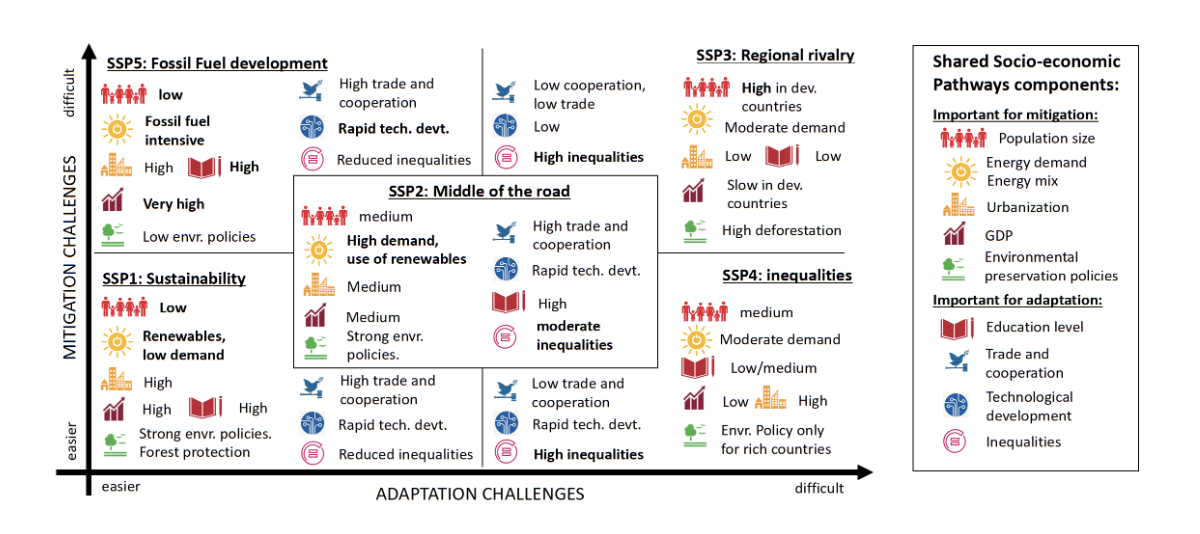
PQS10.18. UNDERSTAND different climate change scenarios are and how they are connected to socioeconomics, energy & land use, emissions, climate change, and climate impacts
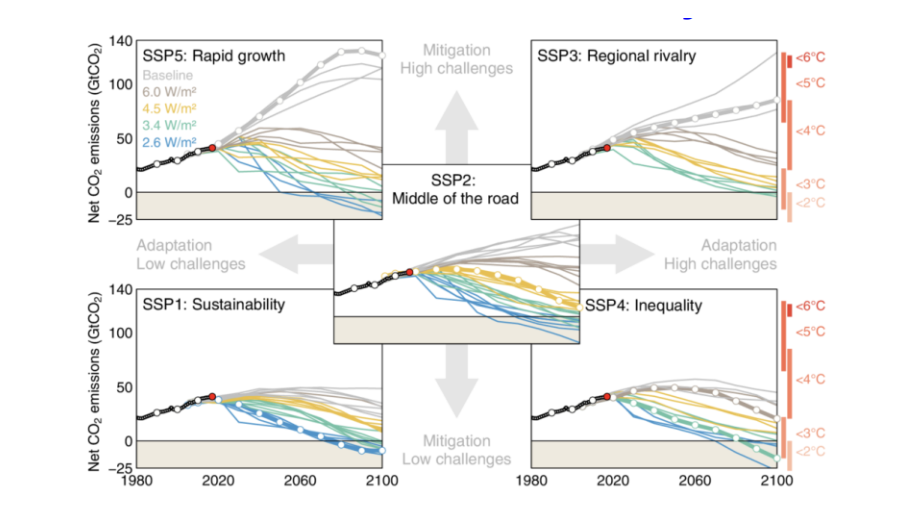
The shared socioeconomic pathways include trajectories of...
Important mitigation
Population size
Energy demand & energy mix
GDP
Environmental preservation policies
Important adaptation
Education level
Trade and cooperation
Technological development
Inequalities
PQS10.19. UNDERSTAND different climate change scenarios are and how they are connected to socioeconomics, energy & land use, emissions, climate change, and climate impacts
Which of these scenarios is compatible with limiting global warming to <2°C?
SSP1-2.6
PQS10.20. UNDERSTAND different climate change scenarios are and how they are connected to socioeconomics, energy & land use, emissions, climate change, and climate impacts
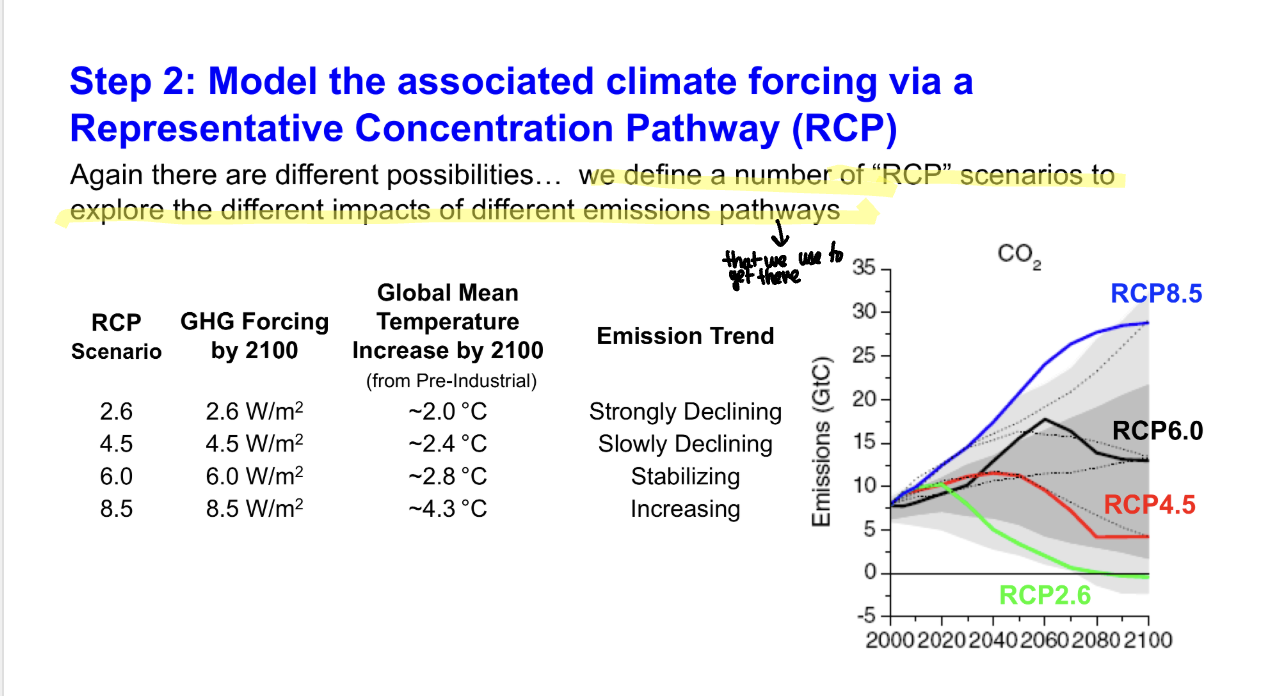
What does the second number in scenario naming convention correspond to (e.g. the 8.5 in SSP5-8.5)?
The equivalent radiative forcing of all anthropogenic emissions in 2100 in W/m².
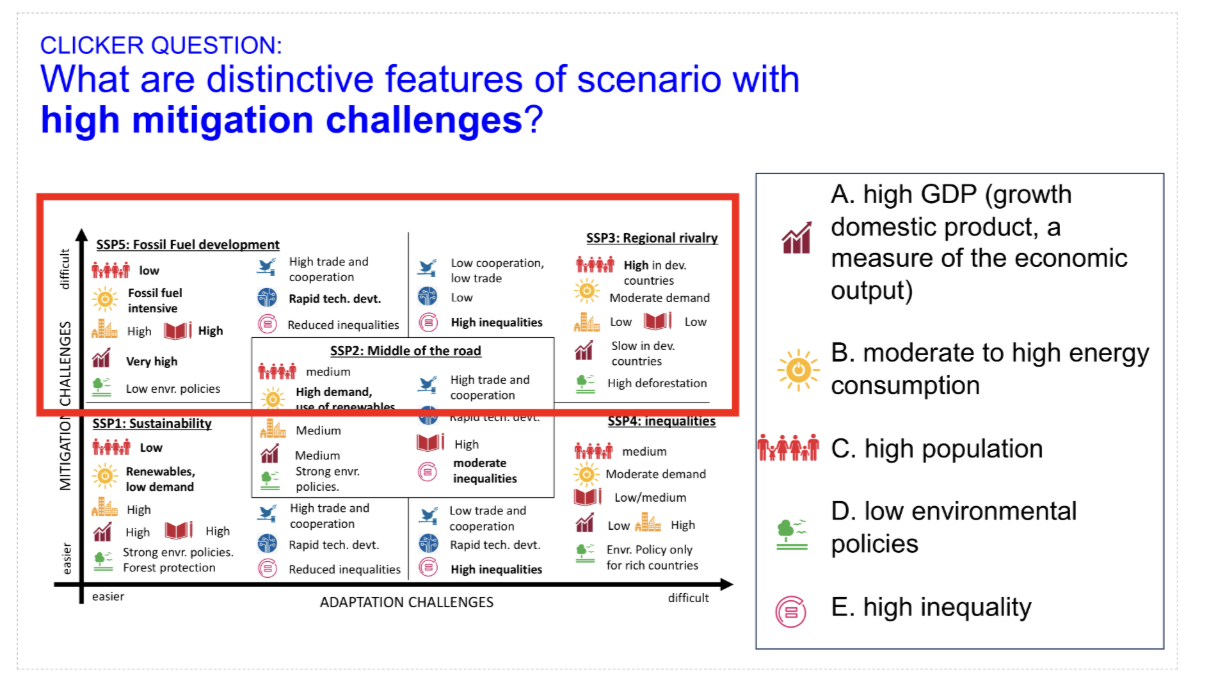
PQS10.21. UNDERSTAND different climate change scenarios are and how they are connected to socioeconomics, energy & land use, emissions, climate change, and climate impacts
What are the distinctive features of the scenario with high mitigation and low adaptation challenges?
What are the distinctive features of the scenario with high mitigation and low adaptation challenges?
high energy consumption
high GDP
high level of education
high level of technology
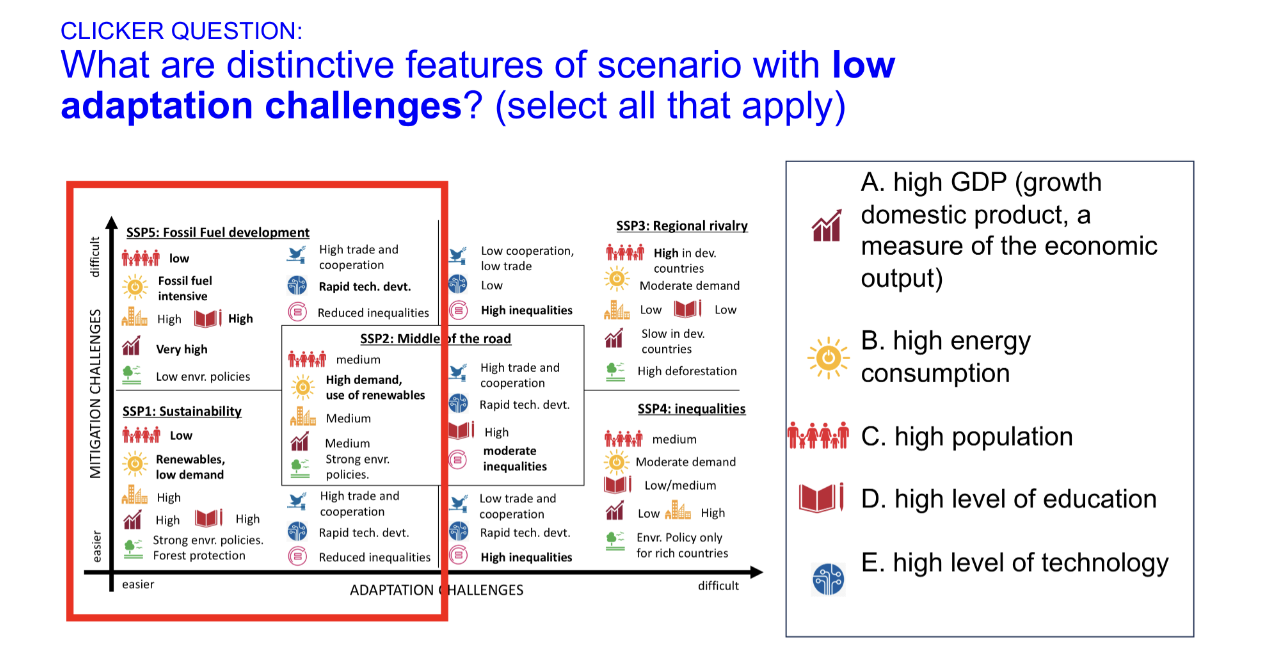

PQS10.22. UNDERSTAND different climate change scenarios are and how they are connected to socioeconomics, energy & land use, emissions, climate change, and climate impacts
What are distinctive features of scenario with low adaptation challenges? Choose all that apply.
High GDP
High level of education
High level of technology

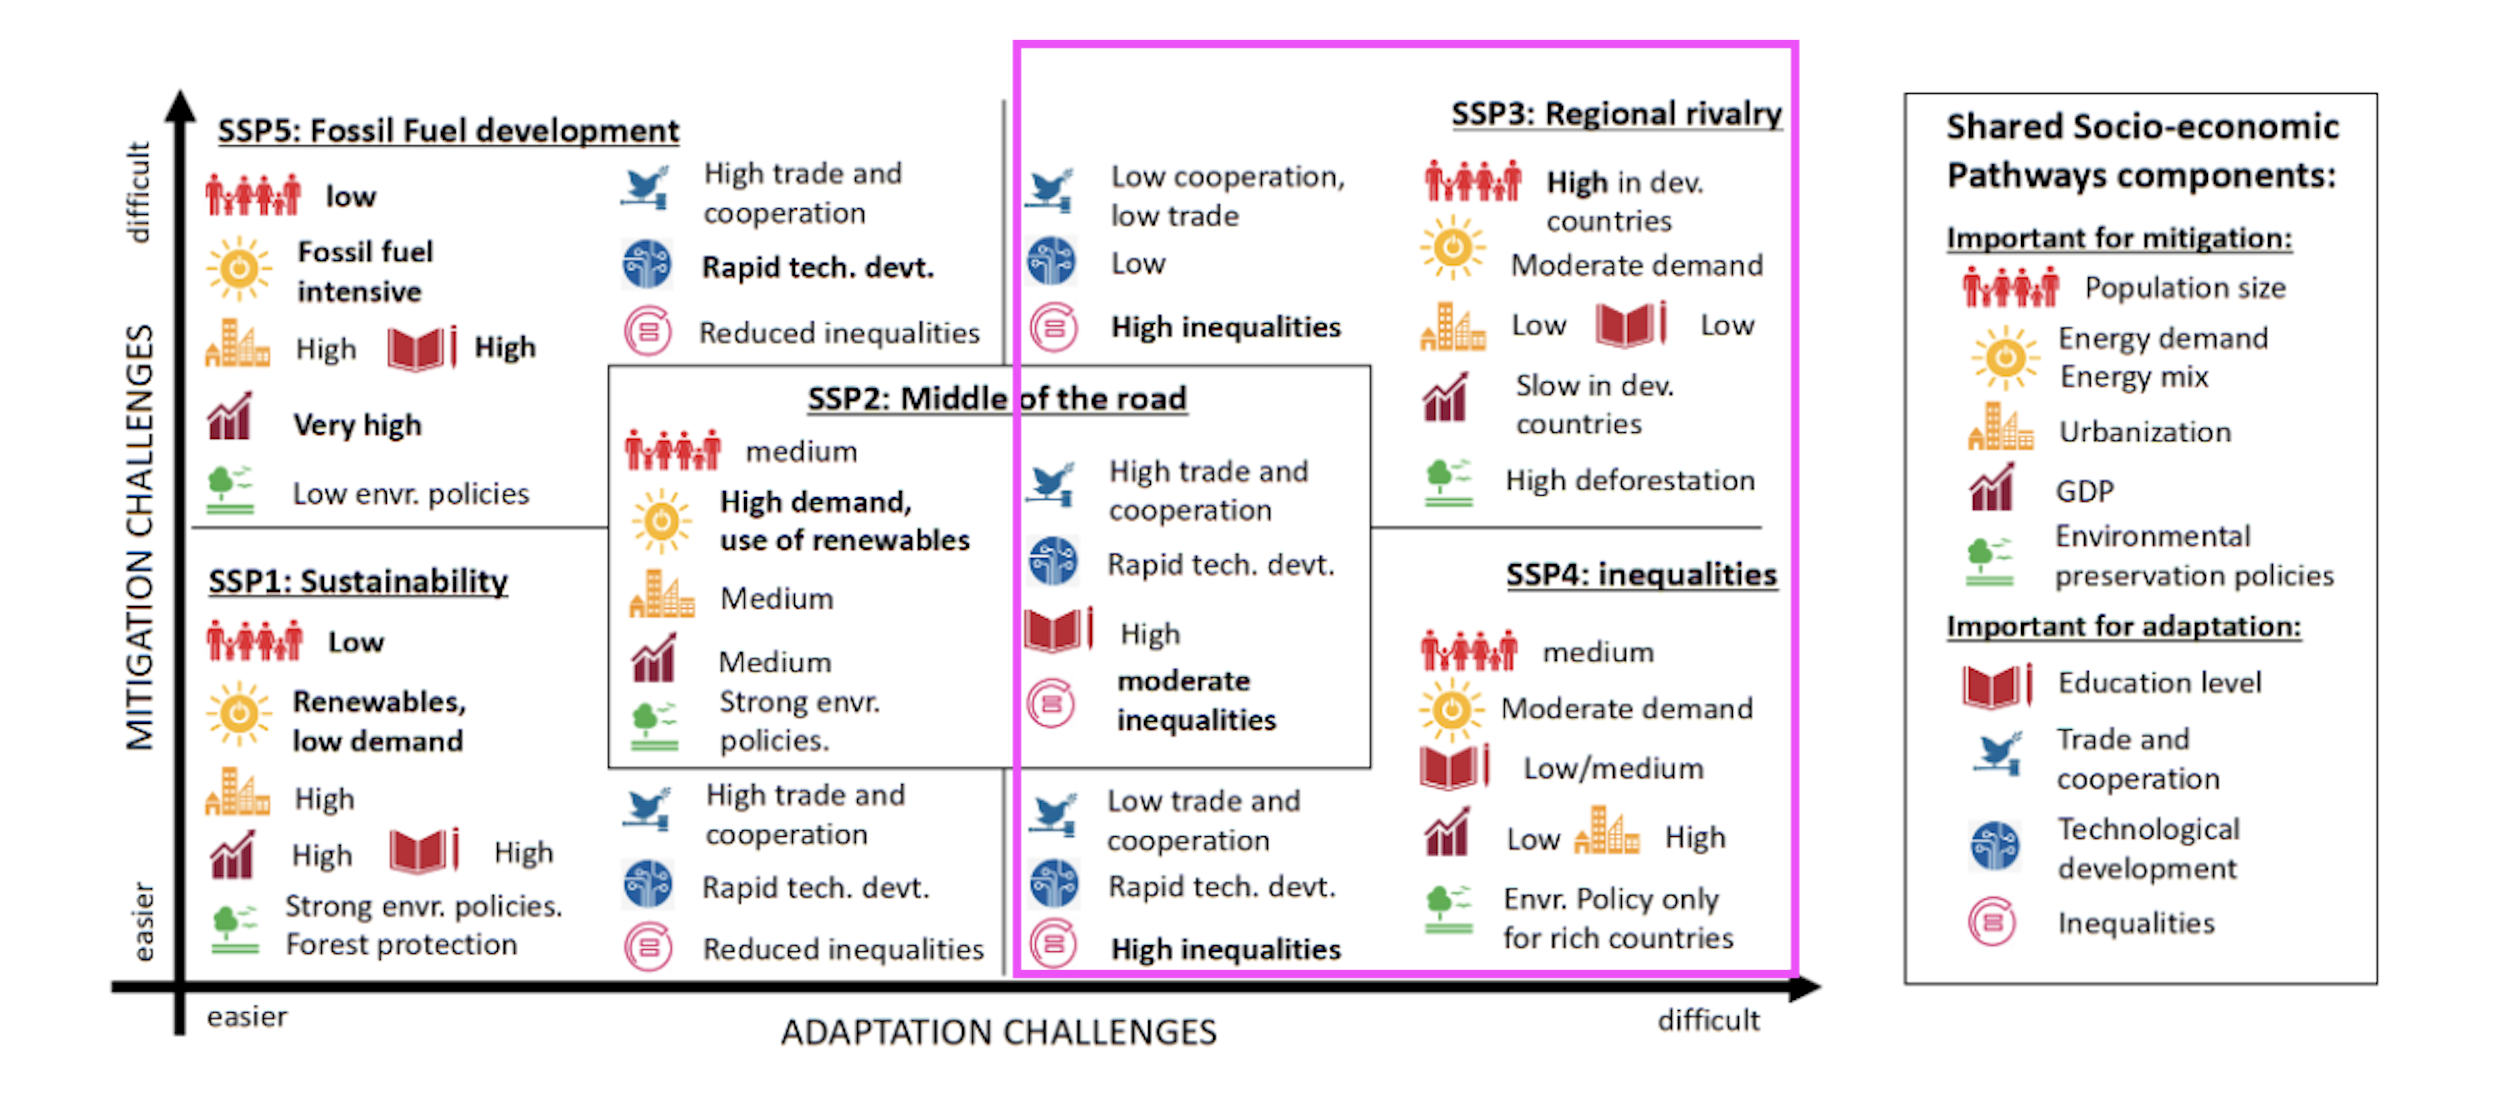
What are distinctive features of scenario with high adaptation challenges?
high/medium population
low level of international cooperation and trade
high inequalities
low level of education
low GDP (growth domestic product, a measure of the economic output)
PQS10.24. DESCRIBE various other metrics/impacts of modern climate change distinct from changes in surface temperature
Which of these observations can you use to show that our climate has changed in the past 100 years?
The rate of sea level rise
The observation that glaciers around the world are retreating
The intensification of precipitation extremes
Largest contributor to sea level rise today:
Increasing water temperature
PQS10.25. DESCRIBE various other metrics/impacts of modern climate change distinct from changes in surface temperature
Sea level has increased in the last century by:
20 cm
PQS10.26. DESCRIBE various other metrics of modern climate change distinct from changes in surface temperature
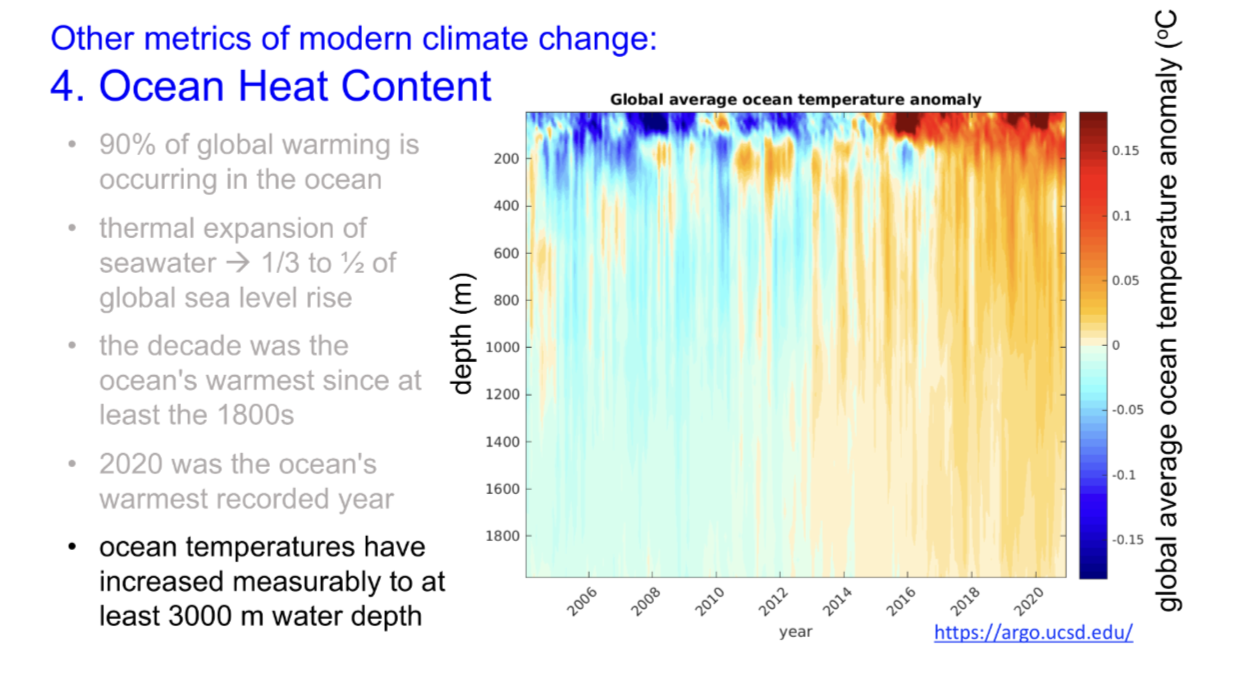
Over the past century, which part of the ocean has warmed most significantly?
most of the ocean above 2000m depth
PQS10.27. DESCRIBE various other metrics/impacts of modern climate change distinct from changes in surface temperature
Over the past 100 years, what is TRUE about Earth's surface temperature change?
The surface temperature has increased by 0.5 to 1C on average.
Polar regions have warmed approximately 5 times more than the global average.
PQS10.28. DESCRIBE some most likely impacts of climate change within your expected lifetime based on IPCC scenarios
Less snowfall but more rain in winter ok
More frequent pluvial floods in winter ok
More forest fires ok
fewer frost days in winter okmore frequent heat waves ok
Warmer winter temperaturesok
more frequent pluvial floods in winter ok
PQS10.29. DESCRIBE some most likely impacts of climate change within your expected lifetime based on IPCC scenarios
Select the statements that are TRUE about expections regrading precipitation extremes in the coming century. Choose all that apply.
floods caused by extreme rainfall will increase
floods caused by snow and glacial melt will decrease
some regions will get drier and some will get wetter
subtropical dry regions will become even drier
PQS10.30. DESCRIBE some most likely impacts of climate change within your expected lifetime based on IPCC scenarios
We are already committed to a certain amount of climate change. Which of these changes are irreversible?
sea level rise
the melting of glaciers and ice sheets
ocean warming