chap 11
1/40
There's no tags or description
Looks like no tags are added yet.
Name | Mastery | Learn | Test | Matching | Spaced | Call with Kai |
|---|
No analytics yet
Send a link to your students to track their progress
41 Terms
Interpersonal Attraction
Standards of physical attractiveness vary across cultures.
Gender difference: Across cultures, physical attractiveness is more important for women than men.
There are universal features + culture-specific features that influence interpersonal attraction.
Universal characteristics found attractive around the world — faces (CCAMBS)
Clear Complexion
Evolutionary reasoning: signals health, absence of parasites/disease.
Cosmetics industries worldwide target skin clarity.
Bilateral Symmetry
indicates developmental stability.
Evidence strongest in hunter-gatherer groups like the Hadza (higher infant mortality → stronger preference).
Seen across species (e.g., symmetrical scorpion flies get more mates).
Genetic mutations, pathogens, or stressors in the womb can lead to asymmetrical features
Averageness
Attractive faces tend to have average features (size, configuration).
Why:
Indicates genetic normality (fewer abnormalities).
Processing fluency: easier for the brain to process prototype-like (avg) faces → positive affect.
Cross-cultural: People rate average faces as attractive even when the faces are from unfamiliar cultures.
One study used composite photos of Europeans, East Asians and people of mixed heritage
Composites were created from images across racial groups
Participants rated these faces for how attractive they perceived them and composite faces were rated as more attractive
Composite faces across racial groups were rated as the most attractive
Biracial/Mixed faces often rated as most attractive (e.g., averaged Eurasian faces) due to:
Genetic diversity → healthier genes
Broader average of features one has been exposed to
Universal characteristics found attractive around the world — bodies
Bodies do not follow the “average is best” pattern.
Western Ideals: Thin female bodies
Historically: larger bodies idealized, Many non-Western cultures prefer heavier bodies
Western thinness ideals spread globally as indicators of high socioeconomic status.
Why, historically and globally, has more body weight been rated less attractive and skinniness rated more attractive?
Introduction of the diet industry and the fitness industry
Profit motive: companies promoting an ideal that is extremely difficult, if not impossible to achieve, and in doing so making women more insecure and motivated to consume the diet regimes or diet pills, or workout classes or appearing-altering cosmetic procedures
Food scarcity as an explanation:
Across cultures, food scarcity is associated with men preferring women with greater body weight. More body weight = higher rates of survival and reproduction
This could also explain why body ideals have become thinner in wealthy societies, as food becomes more abundant
Thinness also shows restrain from indulging in the abundance of food that is available to us in the West
So is food availability a determining factor in the valuing of thinness
Cultures with less food security have a bigger preference for female voluptuousness
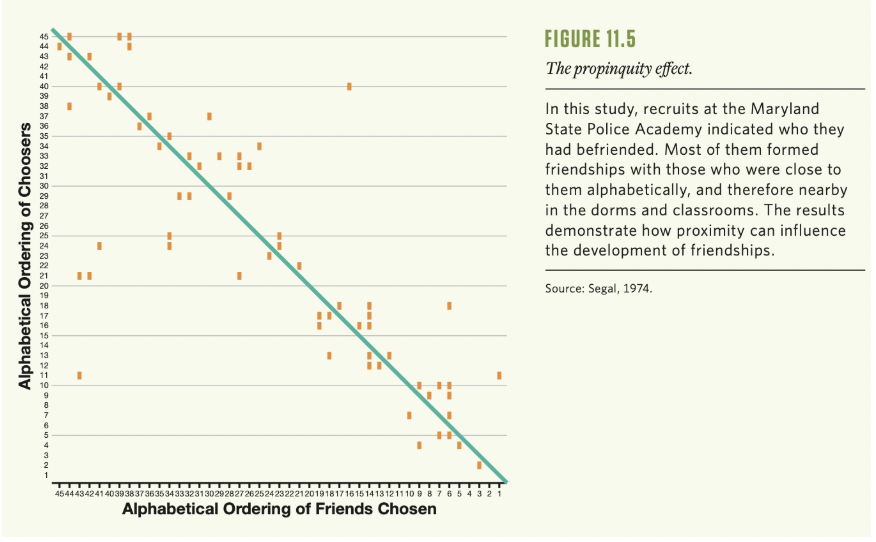
The Propinquity Effect (Proximity) + its Mechanism
People are more likely to become friends with those with whom they frequently interact
Mechanism of Propinquity effect: Mere Exposure Effect
The more we’re exposed to someone or something, the more we like it, because it becomes familiar.
More exposure → more liking (familiarity = safety).
Pleasant Association through classical conditioning
Seen in Americans, Japanese, even chickens → cultural universal.
Study: Maryland State Police Academy study:
Recruits seated/living alphabetically → 45% of friendships formed with someone whose last name was adjacent alphabetically.
Proximity > personality or background.
The Similarity-Attraction Effect
People are attracted to others who are similar in attitudes, personality, religion, background, SES, etc.
Similarity-attraction is not universal (unlike propinquity) → stronger in independent, Western cultures.
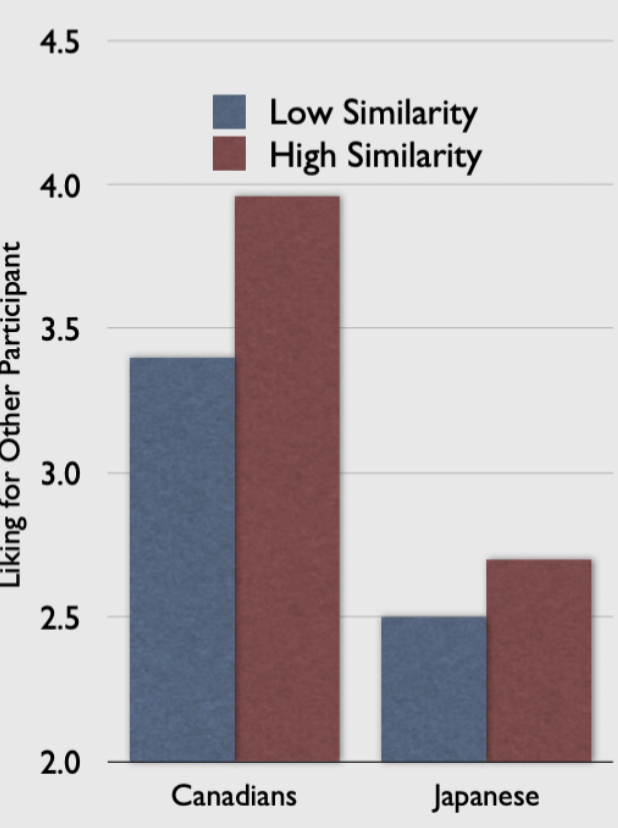
The Similarity-Attraction Effect: Cultural Differences:
Cultural Differences: Stronger in North America Vs. East Asian Cultures
Setup:
Japanese and Canadian participants briefly met a stranger.
Then shown a “profile” of the stranger that was:
Highly similar to them, or
Very dissimilar
Participants rated how much they liked the stranger.
Results:
Canadians: liked high-similar people much more.
Japanese: liking barely changed with similarity.
Close Relationships
Humans are ultra-social: Most life events occur in the context of relationships.
Conversation content: gossip about others is most common.
Happiest moments = usually when people are with others.
Most emotionally painful events = breakups and deaths of loved ones.
Universals: humans do not live as isolated individuals in any culture.
But: how people relate to each other varies by culture in predictable ways.
delete
Communal sharing:
Authority ranking:
Equality matching:
Market pricing
Basic Relational Models:
all relationships in all cultures are built from four basic models
Universality claim: all cultures use all four, but frequency and context differ by culture.
Universally recognizable cross-culturally
Violations of these schemas can be appraised by reacting with offensive to interpreting it as humorous
A single relationship can use all four at different moments, e.g. at family dinner:
Communal sharing: everyone eats until satisfied.
Authority ranking: father at head of table, parents’ decisions override.
Equality matching: each person gets a same-sized dessert.
Market pricing: child gets $1 per dishwasher load.
Communal Sharing:
Emphasis on common identity rather than individual differences.
Resources are pooled and shared for the greater good.
Everyone is treated equally (same rights/privileges).
“To each according to their needs, from each according to their ability” → like scared values
Eg. Family: Don’t track exact contributions, no one earns affection or food
Cross-cultural pattern: Stronger in Non-western Cultures
In the West, strongest within families and lower SES groups.
Authority Ranking:
People are arranged in a hierarchy.
Higher rank = more privileges, power, prestige.
Lower rank = obedience, but also protection/care from above.
Asymmetry is key: roles and entitlements are not equal..
More dominant in class-based, hierarchical societies.
Eg:
Appears even within families (e.g., parents overrule kids)
Military (ranks, pay, duties, salutes).
Equality Matching
People keep track of exchanges and try to pay back equivalently.
Based on balance and reciprocity.
Examples in Western contexts: Car pools, reciprocal dinner invitations, Christmas cards.
Non-Western example: rotating credit associations
Everyone contributes equal money; each family gets the whole pot in turn.
Emphasis on taking turns and equal shares.
Common in many traditional subsistence societies.
E.g., Trobriand Islanders: dangerous ocean voyages to exchange equally valued shell necklaces that have no practical use; strong obligation to reciprocate.
East Asians: strong motivation for equality matching → Reluctant to accept gifts because receiving implies obligation to reciprocate.
Market Pricing
Different resources reduced to a common metric (usually money).
Based on proportionality, ratios, and value.
People expect equivalent value, but exchange doesn’t have to be identical goods.
e.g., pay $500 for roof repair = agreed equivalent of labor.
Status is irrelevant: CEO and janitor pay the same price for milk.
Exchange possible between strangers (e.g., buying on eBay).
Very common in modern Western societies; economic theories treat most interactions as market pricing.
Relational Mobility:
How much freedom and opportunity people have to form, leave, and change close relationships.
High Relational Mobility | Low Relational Mobility |
Ties are flexible; many opportunities for new connections. In open competitive markets for relationships | Few opportunities to form new relationships; existing ones are stable, long-term. Closed markets for relationships. |
Relationships are voluntary and conditional:
| Relationships are shaped by circumstance, not choice:
|
People can leave unsatisfying relationships and look for better ones. |
|
Typical in:
| Typical in:
|
Prototypical case: North American college students
| Migrants: when people move to new cultures, they partly adopt local views of relational mobility. |
Outcomes:
| Outcomes:
|
Relational Mobility and Attractiveness:
In high-relational-mobility societies:
People are in an “open relationship market.”
Being attractive to potential partners (friends, romantic, work) is more important.
Traits that draw others in (e.g., similarity, uniqueness, physical attractiveness) are highly valued.
In low-relational-mobility societies:
Attractiveness matters less, because you cannot easily change your social network.
Relationships persist regardless of evaluations
Evidence: Schug et al. (2009):
Americans felt they had many opportunities for new relationships and showed a strong similarity-attraction effect.
Japanese felt fewer opportunities and showed a weaker similarity effect. → Relational mobility explains cultural differences in similarity-attraction.
Factors influencing cultural variation and Relational mobility
Subsistence patterns
Cultures with more herding and fewer threats → more mobile
Cultures with more threats and rice farming → less mobility
More herding = more moving around = more mobility
External Threats
Fewer threats = greater relational mobility
The Tyranny of the Beautiful
In high-relational-mobility Western contexts, being physically attractive yields many unfair advantages→ better rates, votes, rated smartness, better earning
Halo effect: Because attractiveness is the first cue we see, it’s cognitively easy to assume attractive people also have other positive traits.
Evidence: Cross-cultural twist: Ghana vs USA (Anderson, Adams & Plaut, 2008)
USA (high relational mobility): More-attractive Americans → higher life and friendship satisfaction.
Ghana (low relational mobility): More-attractive Ghanaians → lower satisfaction with life and friendships.
Interpretation: In Ghana’s low-mobility context, attractiveness may not translate into better outcomes and may even create jealousy or suspicion.
Urban vs rural USA (Plaut, Adams & Anderson, 2009):
Urban (higher mobility): more-attractive women → higher well-being.
Rural (lower mobility): attractiveness not linked to well-being.
Residential Mobility:
how often people change where they live.
Strongly tied to relational mobility (moving → new relationships).
Individual level effects: People who move a lot show:
Show conditional loyalty: Identify with their college only if it’s described positively.
Have more Facebook friends and keep expanding their network.
See personality traits (visible quickly) as more central than group memberships (take longer to know).
Prefer large national chains (Starbucks, Walmart) over local stores: Chains = familiar and reliable no matter where you go.
Community Level Effects:
States/areas with high residential mobility:
Higher crime rates and less community involvement
Over generations, willingness to move → better job opportunities and higher income; families who never move tend to stay poorer.
Takeaway: American psychological patterns may partly come from a highly mobile lifestyle.
Study on Residential mobility and identity:
Americans who have never moved viewed group membership to be as important as personality traits for their identity
Those who have moved 1+ value personality traits more, and group memberships less
Residential mobility and social preferences:
The universalist: Helped stranger and friend equally
The loyal friend: Only helped friend
Results:
Among people whose family never moved residences, 90% prefer the loyal friend.
Among people who moved residences while they were a child more than once, preference for the loyal friend goes down to 62%.
Friends and Enemies
In West African cultures, it’s common to be wary of friends, despite collectivism.
Study findings:
Only ~26% of Americans say they have enemies. Enemies are more often outsiders
About 71% of Ghanaians say they have enemies. Enemies are often in-group members (neighbors, friends, relatives).
Relational Mobility and Friendships/Enemies:
High Mobility - E.g. USA | Low Mobility - Ghana |
Avoid people who might become enemies | Cannot easily escape negative relationships |
Choose to engage only with useful or positive partners | Can be stuck with interacting with people you dislike for years |
Less likely to form actual enemy relations. | People with low-mobility cultures show more desire to understand enemies, and low-mobility people avoid them. |
Varieties of Friendship:
Number of Friends: Americans have a higher social network → relatively casual and numerous relationships
Collectivistic cultures:
Important aspect: giving advice, often unsolicited.
Russians especially:
Offer advice even when not requested.
Friendship involves telling others how they should live their lives.
Americans: advice more often tied to whether it is requested.
Ghanaian vs American vs east asia view of “having many friends”
Ghanaians: person with many friends = possibly foolish
Because friendships involve strong obligations and practical support (financial, social, etc.).
Many friends = many obligations → burdensome.
Americans: more likely to see many friends as positive (social, fun, status).
East Asia:
Those high in relational mobility → friendship attitudes similar to Americans.
Those low in relational mobility → more cautious about friends, like Ghanaians.
Simpatico:
valued relational style characterized by Warmth, hospitality, harmony, ease in social situations.
Self-concept includes traits like: Easygoing, respectful, courteous, agreeable.
Social expectations: Interactions should be pleasant, positive, and harmonious, with minimal negativity.
Work context:
Latin Americans prefer group settings with a warm, friendly atmosphere.
European Americans (esp. Protestants) often focus more on tasks than relational climate.
Interaction studies —> latin americans, European americans, african americans thoughts on interactions w/ eachtoher
Latin Americans:
Talk more, show more eye contact, and have a more positive affect in interaction.
When European Americans or African Americans interact with Latin Americans:
They rate the interaction as more smooth, natural, involving,
And express more interest in future interaction.
Overall: Latin Americans tend to be more sociable and spend more time socializing than European Americans, and bring simpático energy into group settings.
Romantic Love: Why it exists:
Parental Love: human infants are highly dependent for a long period; neglect would decrease child survival.
Romantic love evolved to keep 2 parents together long enough to raise a vulnerable child (Fisher, 2004; Frank, 1988; Chapais, 2010).
Parents who stayed together produced more surviving offspring → love selected for.
Is romantic Love universal:
Reviewed 166 cultures; found evidence of romantic love in 89%.
Remaining 11% likely due to ethnographic oversight, not lack of love.
Conclusion: Romantic love is a human universal (functional universal).
But expression and role of love varies culturally.
Elements of Love Relationships: Sternberg’s triangular theory of love:
Cultures differ in how strongly each emphasized
Intimacy: Closeness, connection, deep knowledge
Self-disclosure may not be as central to intimacy outside the west
May rely more on kindness, responsibility, and support
High mobility (USA): need to invest in relationships → more self-disclosure.
Low mobility: relationships are stable → less need to disclose.
Passion: Physical attraction, sexual desire
Westerners:
Report higher passion
Satisfaction is more tied to passion.
East Asians:
Lower reported passion, less central to satisfaction
Relational Mobility:
Americans have higher relational mobility → more chances to leave a partner.
Passion acts as “glue” preventing partner switching.
Cultures with fewer relationship options (Japan) need less passionate glue.
Commitment: Decision to stay long-term
Asia – Lower relational mobility
Higher commitment on avg.
Relationships are more stable due obligations and social constraints
Divorce rates correlate with:
Individualism → Higher indiv. = higher divorce rates
Relational mobility
Cultural Variations in Marriage
Western Cultures:
Greater self-disclosure → high intimacy in romantic partnerships
Spouse often top priority relationship
Passion is more central for satisfaction
East Asian and Mexican Contexts:
Commitment strong predictor of satisfaction
Lower romantic self-disclosure
People with interdependent selves get intimacy from broader networks (friends, parents).
Studies: Ghanaians and Taiwanese often prioritize mothers over spouses.
Acculturation increases intimacy → East Asians/Mexicans who are more acculturated disclose more.
Arranged marriages and love marriages
Arranged marriages are common in many current and traditional cultures, with little or
no focus on romantic love in the early stages.In contrast, the norm in many other cultures is love marriage, in which couples choose each other based on mutual love.
Cultures that have extended family systems are more likely to have arranged marriages than cultures with nuclear family systems.
Idealisation of Partner:
Idealisation of partner ⇒ Higher love, longer relationship survival
Protects from thinking about partner’s flaws → reduces dissonance → increases satisfaction
Cultural difference:
Canadians idealise partners more than Japanese
Idealisation = more common in western individualistic contexts.
USA Historical Model: marriage
Institutional Marriage: Life’s necessities and survival
Marriage meets basic needs: food, safety, childcare, shelter
Partners = economic team
Companionate Marriage: Belonging and Survival
Rising urbanisation → gender role division
Focus shifts to love, belonging, companionship, affection.
Self-expressive Marriage: Self-expression and authenticity
Women entering the workforce; contraception empowers choice.
Marriage becomes about personal growth, self-esteem, identity.
Higher expectations → lower satisfaction for many
People rely on more spouses:
Fewer close friends over time
More time spent only with spouse.
Climbing Mount Maslow and Marriage:
Marriage used to focus on meeting lower-level needs
But in modern western cultures → marriage has climbed the mountain → people expect a spouse to help them meet higher-level needs
Identity, authenticity, personal growth, self-expression, and autonomy.
The importance of marital quality has increased, %age of people happy in marriage has declined → Why?
Most people don’t have the time, skills, or emotional resources to maintain a relationship that must meet self-actualization needs.
The standards have become too high.
Many marriages collapse under this pressure.
Average marriage quality went DOWN because the bar was raised.
But the best marriages today are BETTER than before —> consequences of this shift
Even though most marriages suffer, the top tier of marriages are now the best in human history.
higher divorce rates
Successful marriages require more resources & skills
People with higher social class / education have higher marriage success
Low SES → long work hours, financial strain, fewer support systems.
History of Arranged Vs Love Marriages:
Global patterns
Historically, most marriages were arranged
Declining today in China, India, Japan, and Turkey.
Most societies required parents’ input or approval.
Rising in the importance of love in USA
Would you marry someone with all desired qualities except love?
India/Pakistan: ~50% said yes (another 25% unsure)
USA, UK, AUS, Latin America: >80% said no
Conclusion: love is required for marriage in some cultures but not others.
Preference for arranged marriages:
In extended families → love = disruptive
Strong feelings may conflict with family responsibilities.
Families are better positioned to evaluate long-term compatibility.
Western Assumptions above Love:
Only self-selected partners can be loved → arranged couples often develop love over time (puppy analogy)
Love is an individualistic choice → arranged-marriage cultures view marriage as a two-family alliance, and families are experts in compatibility.
Love-based marriages are more successful: India: 74% believe arranged marriages are more likely to succeed. Cultures focusing heavily on love have higher divorce rates.
Satisfaction in Arranged vs Love Marriages (cross cultural studies)
Cross-cultural studies
Turkey & Israel: arranged couples ≈ love couples in satisfaction.
USA (Moonies): arranged mass marriages had similar satisfaction & dissolution after 3 years (Galanter, 1986).
Japan & China:
Men in arranged marriages → equal or higher satisfaction
Women → less satisfied than women in love marriages
Suggests arranged marriage costs fall more on women in these societies.
Gupta & Singh (1982) – Indian Couples
Love marriages start with more love but decline over time.
Arranged marriages start low but increase steadily.
After ~10 years, arranged couples report more love than love-marriage couples.
Interpretation:
Different comparison standards → arranged couples compare “some love” to initial zero, while love-marriage couples compare “reduced love” to initial high passion.