S2 L4 Machine learning
1/20
There's no tags or description
Looks like no tags are added yet.
Name | Mastery | Learn | Test | Matching | Spaced | Call with Kai |
|---|
No analytics yet
Send a link to your students to track their progress
21 Terms
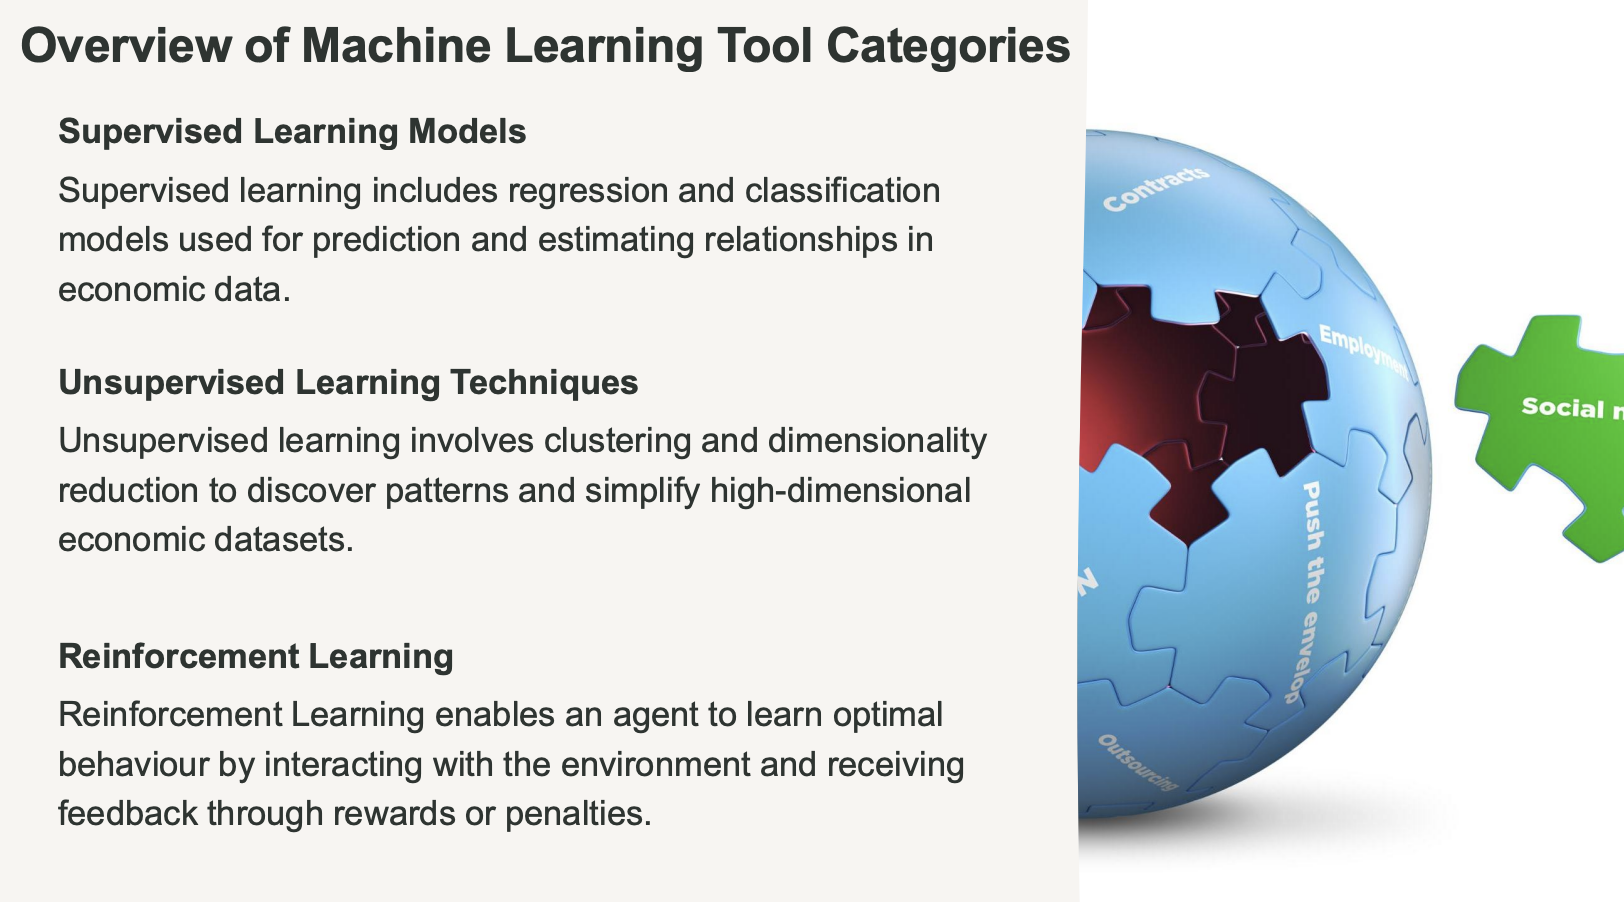
What are the three compartments in machine learning
Slide 4: Supervised Learning
What it means: Think of this as the "Guided Student" method . You give the computer a massive spreadsheet where all the answers (the "labels") are already filled in.
The translation: You give the computer 1,000 photos of houses and explicitly tell it the sale price of each one. The computer studies the data until it finds the pattern. This is used for two things:
Regression: Predicting a continuous number (like predicting exactly how much a new house will sell for) .
Classification: Predicting a category (like predicting "Will this person default on their mortgage: Yes or No?") .
Slide 5: Unsupervised Learning
What it means: Think of this as the "Explorer" method . You give the computer a massive spreadsheet, but you completely hide the answers.
The translation: You hand the computer a million grocery store receipts without telling it what to look for. The computer automatically explores the data and groups similar things together (Clustering). It might discover a hidden pattern like, "People who buy diapers on Friday nights also tend to buy beer."
Slide 6: Reinforcement Learning
What it means: Think of this as the "Video Gamer" method . You don't give the computer a spreadsheet at all. You drop it into a simulation and let it learn via trial and error.
The translation: If you want to teach a computer to play chess, you don't program the rules. You just tell it, "Winning gets you +1 point, losing gets you -1 point." The computer plays millions of random games against itself until it learns the best strategy to maximize its reward .
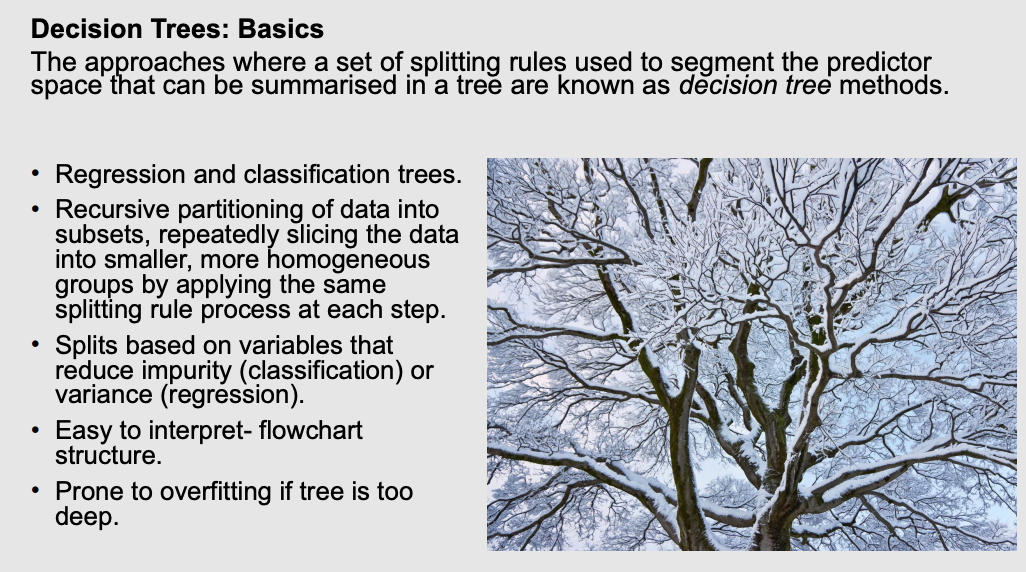
What is a decision tree? and what is the disadvantage of this?
What it means: We are now looking at our first specific Machine Learning tool .
The translation: A Decision Tree is literally just a flowchart. The computer looks at a massive crowd of data and repeatedly asks simple "Yes/No" questions to chop the data into smaller, more similar groups (this is called "recursive partitioning")
What is a regression tree and what are the three components of a regression tree
What it means: Here are the specific words you use to describe the flowchart :
Internal nodes: The exact point where the computer asks a question to split the data.
Branches: The lines connecting the questions.
Regions: The final buckets the data lands in at the very bottom of the tree.
The Prediction: If a new person falls into a specific bucket, the computer simply guesses that their outcome is the exact mean (average) of everyone else who landed in that bucket.
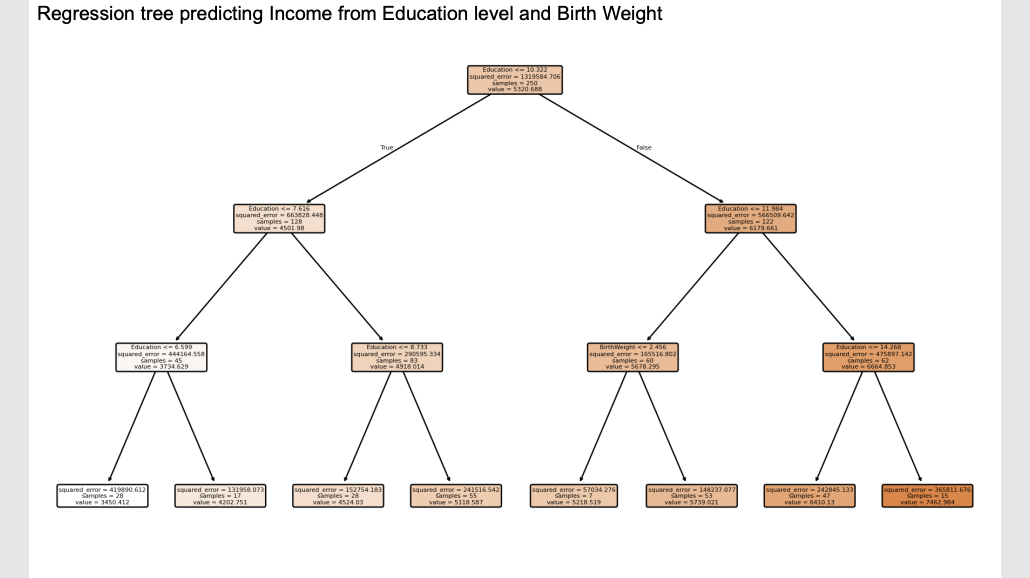
Example of a regression tree
What it means: This is what the software actually prints out . The computer is trying to predict a person's Income (the "value") by looking at their Education and their Birth Weight.
The translation: Start at the very top box . The computer asks its first question: "Is your Education <= 7.616 years?".
If True, you go down the left branch.
If False, you go down the right branch.
You follow the questions all the way down until you hit a final box, and the
valuein that box is your predicted income.
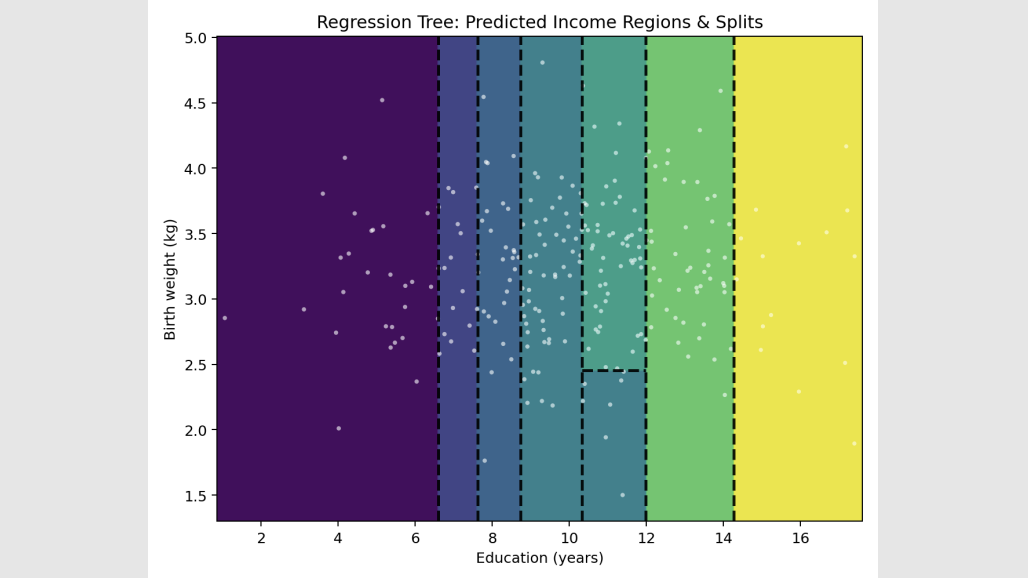
What does the boxes look like
What it means: These slides just show you what the flowchart from Slide 10 looks like if you drew it on a graph .
The translation: The computer is essentially taking a giant ruler and drawing straight vertical and horizontal lines (axis-aligned splits) across the data to box similar people together.
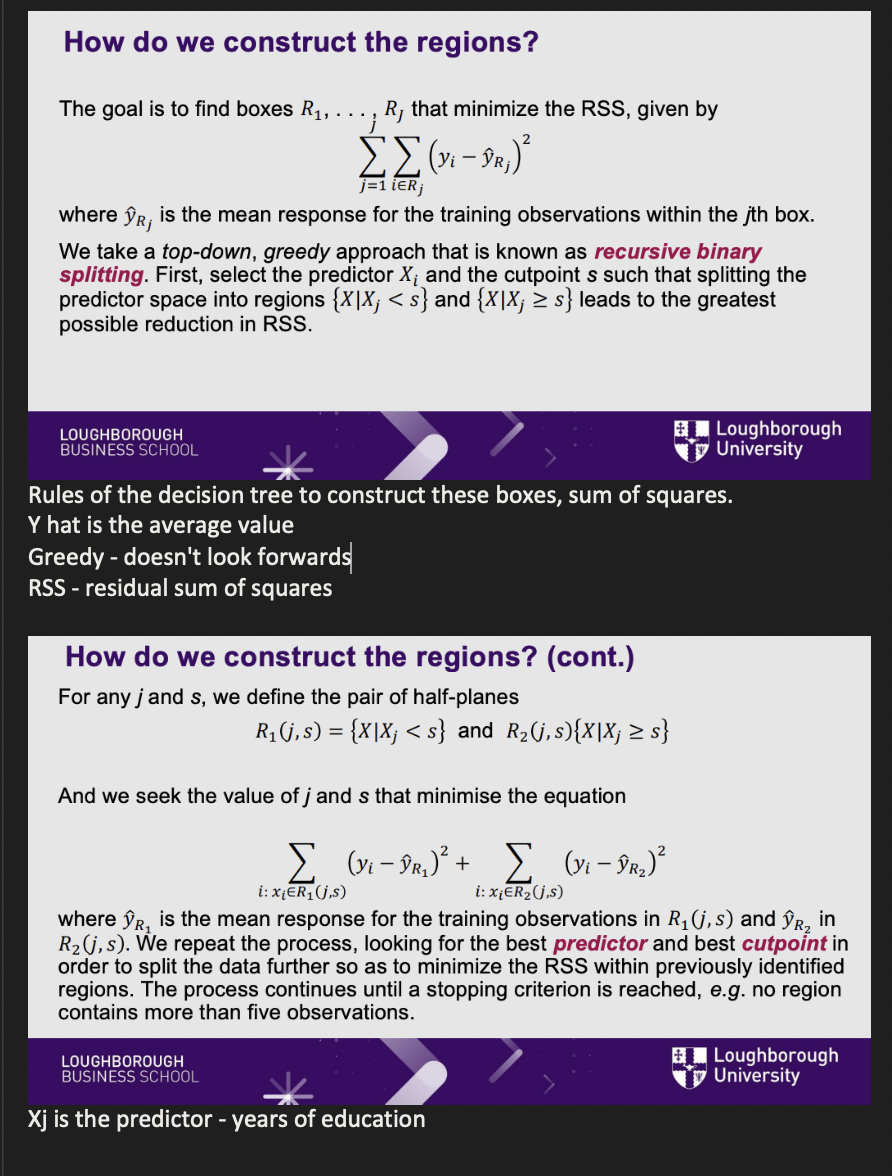
How do we construct the regions
What it means: How does the computer know exactly where to put the ruler? It uses a formula to minimize the RSS (Residual Sum of Squares) .
The translation: RSS is just a fancy mathematical term for "Prediction Error." The computer tests thousands of possible splitting lines. It calculates the error for the left side, calculates the error for the right side, adds them up, and officially chooses the split that drops the total error the most . It is called "greedy" because it only looks for the best split right now, without planning ahead. It keeps splitting until it hits a rule, like "stop if a box has fewer than 5 people in it".
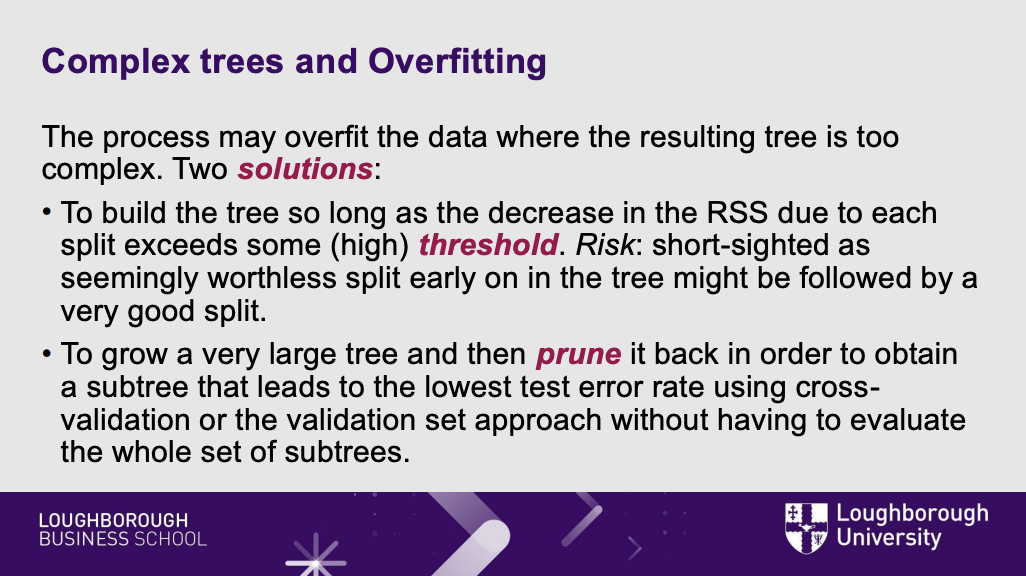
What is a flaw of the decision tree and the two soultions to this
What it means: This is the fatal flaw of Decision Trees .
The translation: If you let the computer keep splitting the data forever, it will eventually create a tiny, unique box for every single person in your spreadsheet. This is called Overfitting. The tree has perfectly memorized the past, but if you introduce a brand new person, the tree is so hyper-specific that its prediction will be terrible.
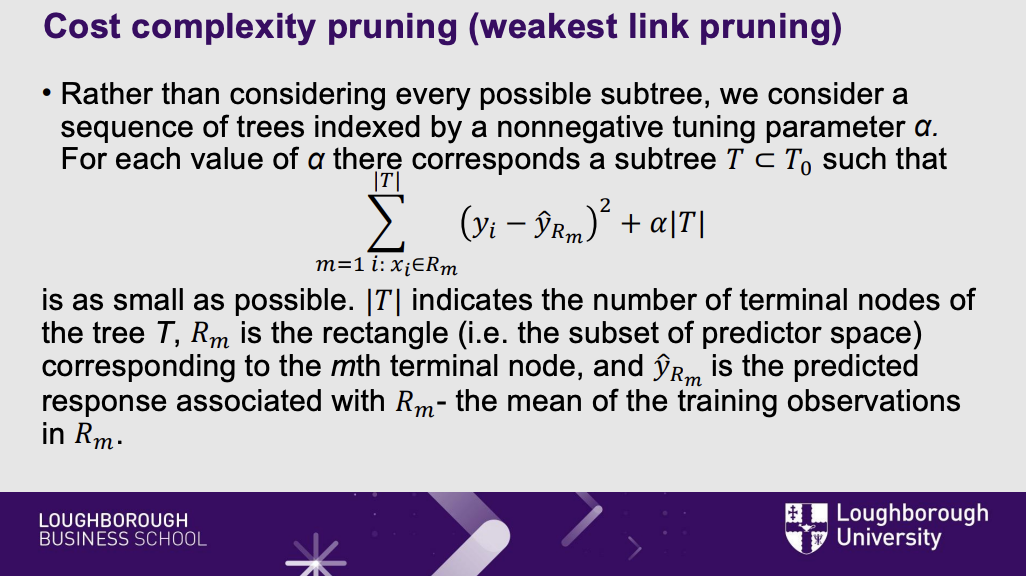
what is cost complexity pruning
What it means: To fix overfitting, we use Cost Complexity Pruning .
The translation: We let the computer grow a massive, overgrown tree. Then, we take out the mathematical scissors and cut off the bottom branches (pruning). We introduce a dial called $\alpha$ (alpha) that penalizes the computer for having too many branches . This forces the final tree to stay small, simple, and capable of handling new data.
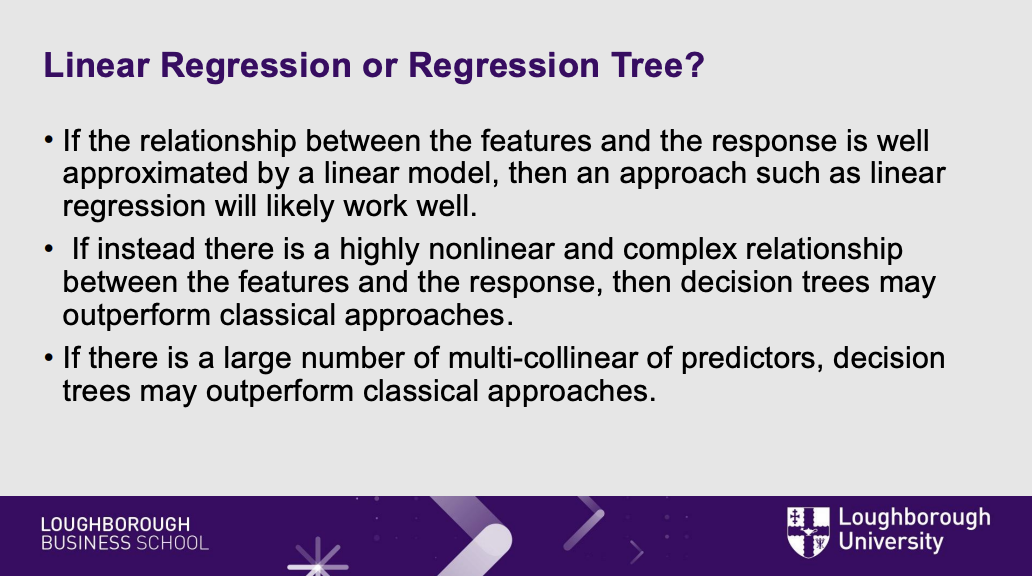
When to use linear regression vs regression trees
What it means: A quick cheat sheet on when to use which tool .
The translation: If your data forms a nice, simple straight line, use old-school Linear Regression. But if the real world is messy, highly complex, nonlinear, or has lots of overlapping variables, Decision Trees will easily outperform the old math .
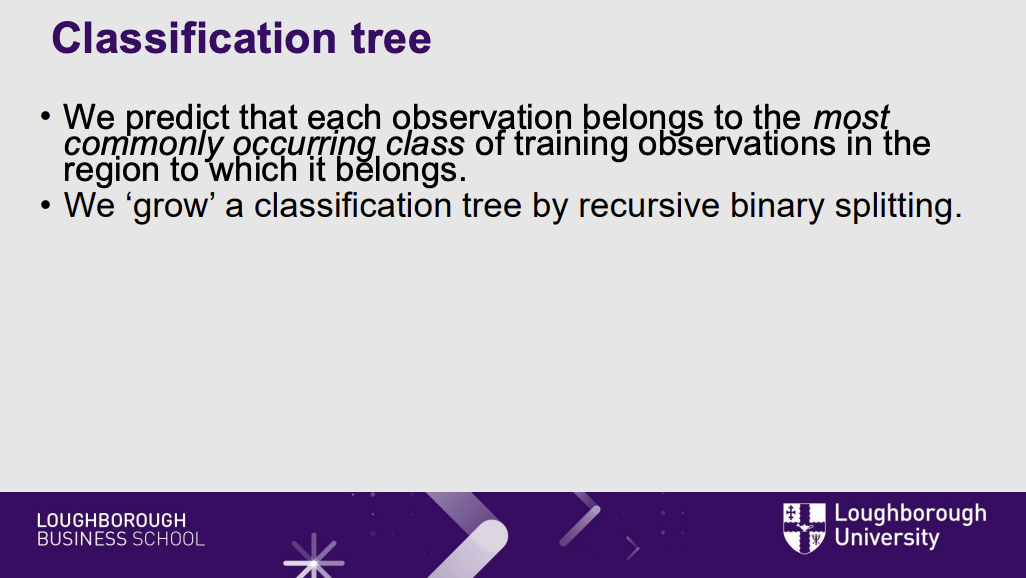
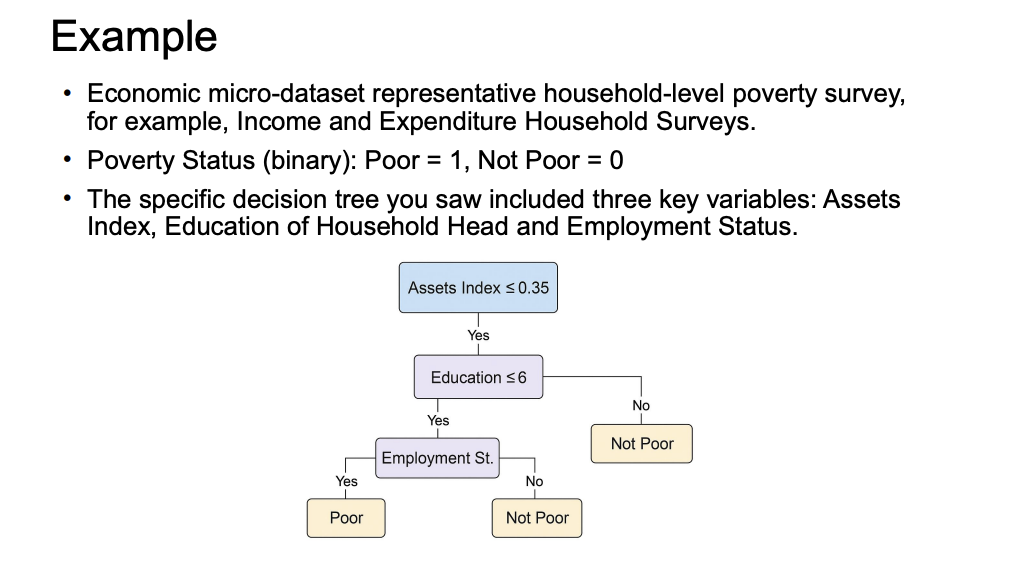
What is a classification tree?
What it means: The previous slides were about Regression Trees (predicting a number, like Income). This is about Classification Trees (predicting a category, like "Poor" or "Not Poor") .
The translation: The flowchart works exactly the same way. But instead of guessing the average number at the bottom of the tree, the computer takes a majority vote. If a box ends up with 8 "Poor" people and 2 "Not Poor" people, the computer predicts anyone landing in that box is "Poor."
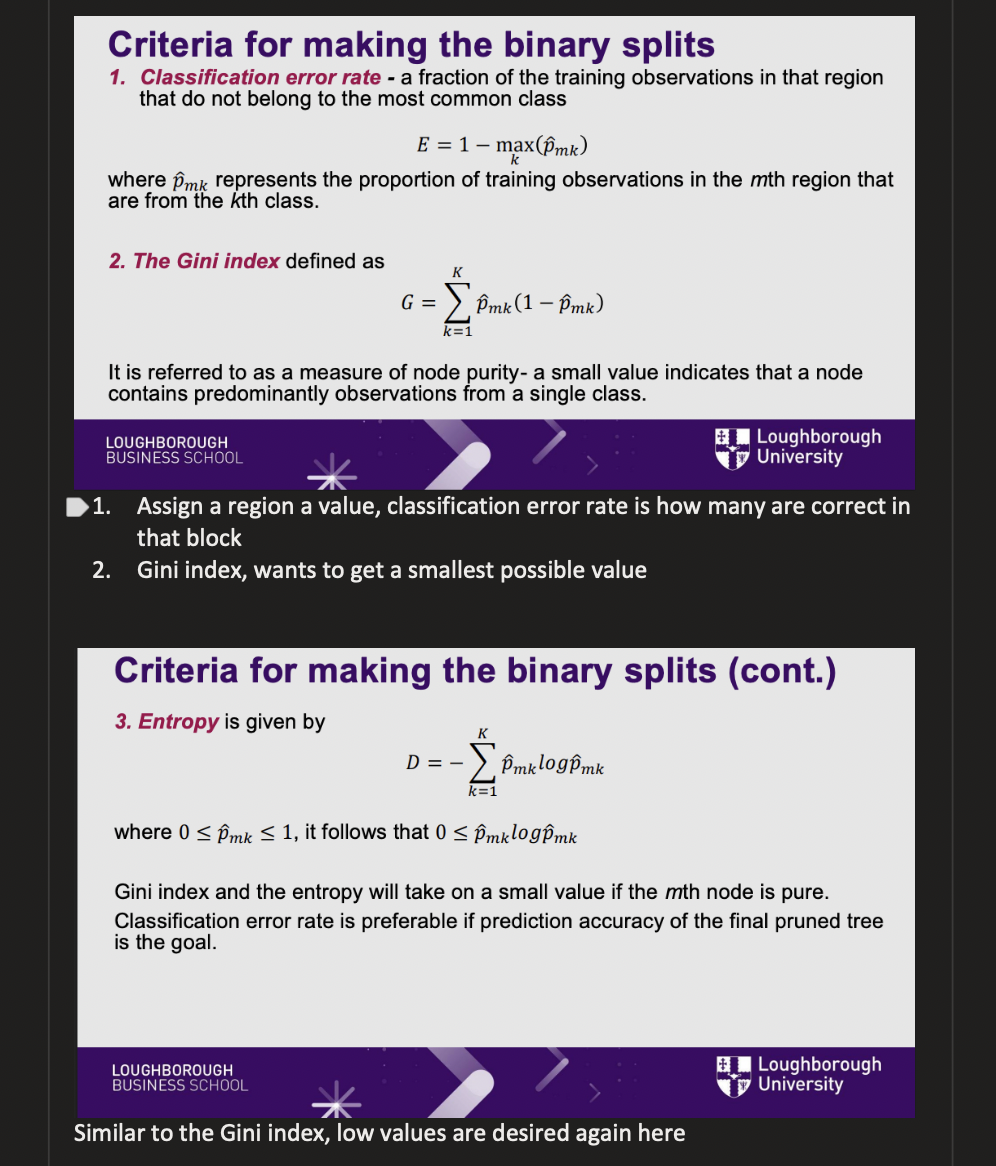
What are the three conditions for binary spilts
What it means: Because we aren't using numbers anymore, the computer can't use "RSS" to calculate the error when it splits the data. It has to use new formulas .
The translation: The computer's goal is to create boxes that are as "pure" as possible (meaning everyone in the box belongs to the exact same category). To measure this purity, it uses three formulas:
Classification Error Rate: Simply counting the fraction of people who are in the wrong box .
The Gini Index: A mathematical score of node purity .
Entropy: Another mathematical score of purity .
(Note: You do not need to memorize the algebra here, just know that Gini and Entropy are the tools the computer uses to draw the lines for categories).
Example
What it means: This is a real-world example of the category math (Gini/Entropy) we just talked about .
The translation: The computer is trying to predict if a household is "Poor" or "Not Poor". It found that the best first question to ask is about their Assets. Then, it asks about Education, and finally Employment . Notice how easy this flowchart is for a normal human to read!
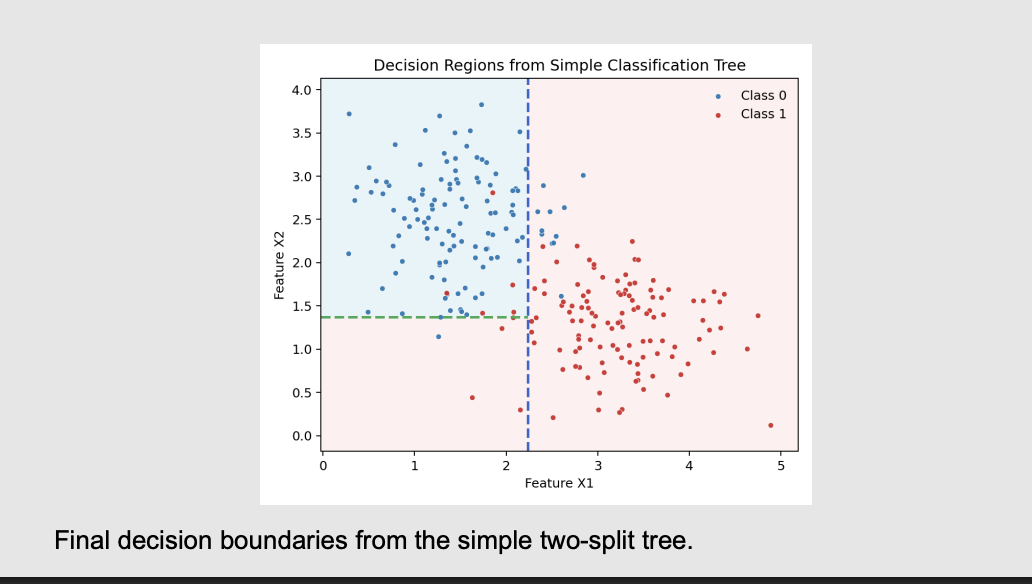
What is the end point of this example
What it means: These slides just show you what that poverty tree looks like on a scatterplot .
The translation: The red dots are "Poor" and the blue dots are "Not Poor". The computer draws a vertical line (Slide 23) to separate them as best it can. Then it draws a horizontal line (Slide 24) to isolate them even further .
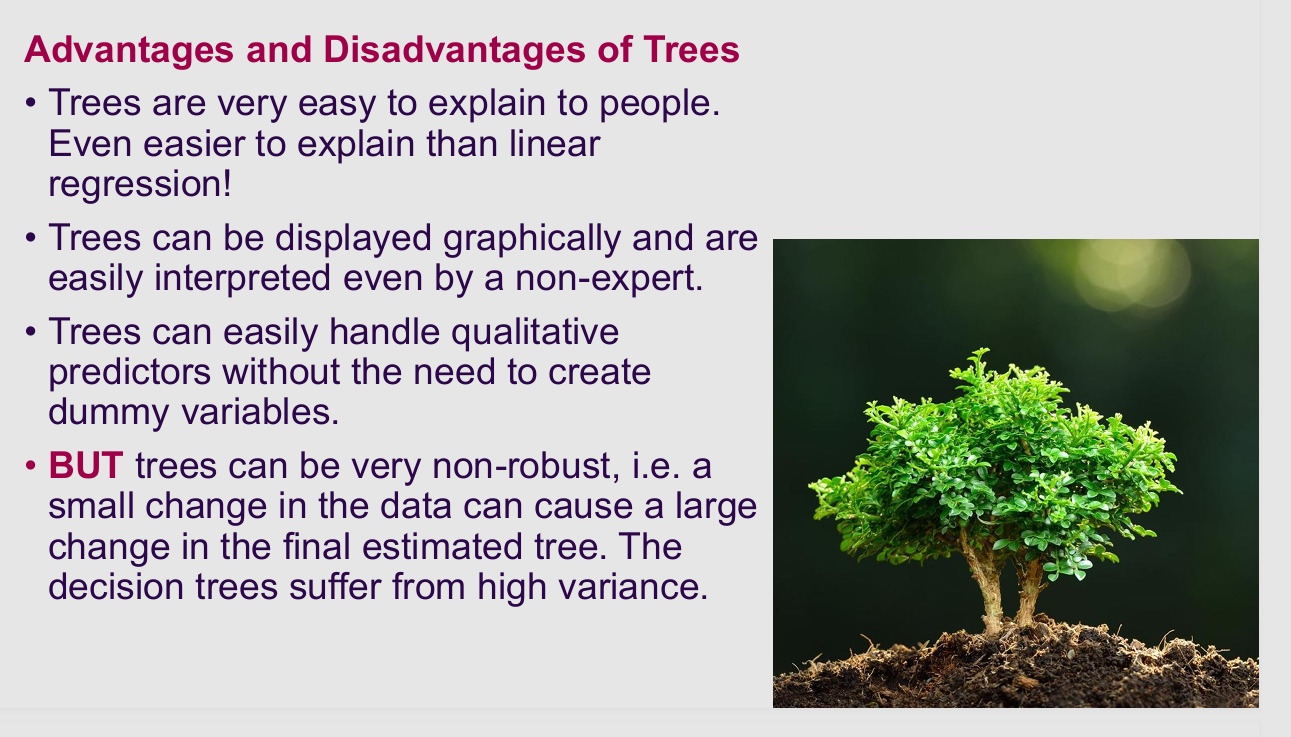
What are the pros and cons of trees
What it means: Why don't we just use single Decision Trees for everything?
The translation: * The Pros: They are incredibly easy to explain to your boss, and they don't require you to turn categories (like "Male/Female") into fake numbers (dummy variables) .
The Con: They have High Variance . This means they are extremely fragile. If you change just two or three people in your massive spreadsheet, the computer might draw a completely different flowchart!
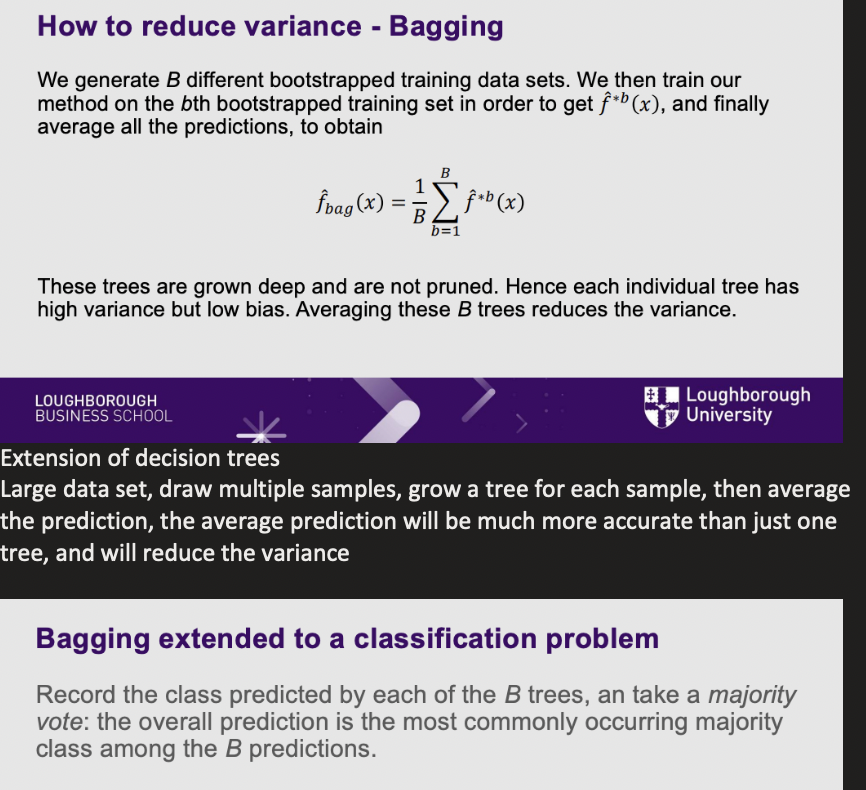
What is bagging (variance) and how is it reduced
What it means: How do we fix the fragile tree? We create a forest!
The translation: Instead of building one tree, the computer pulls random samples from your spreadsheet and builds hundreds of different trees (this random sampling is called "Bootstrapping")
If you are predicting a number (Regression), it averages the guesses from all 100 trees.
If you are predicting a category (Classification), it lets the 100 trees take a majority vote. This drastically reduces the fragility!
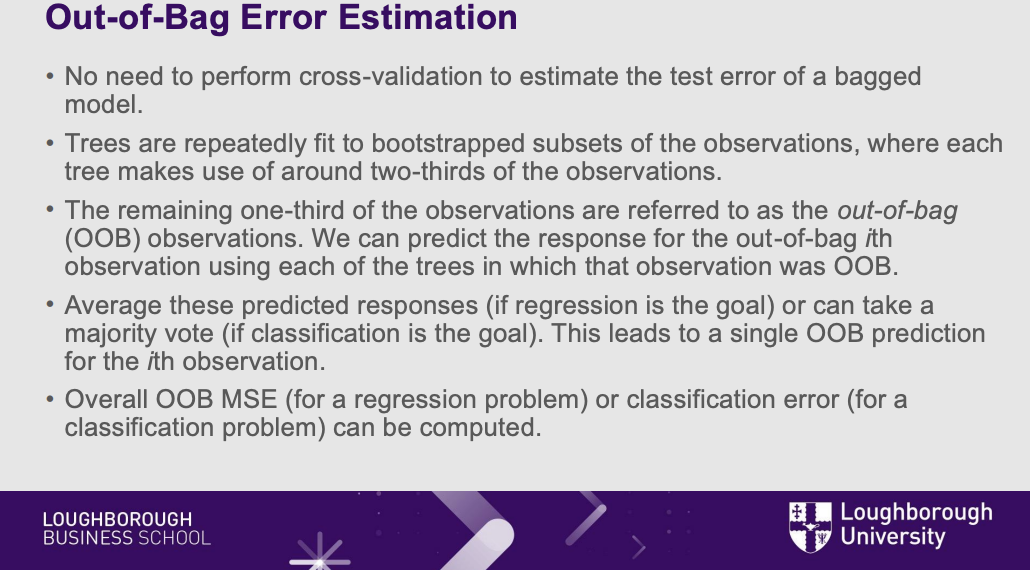
What is out of bag error
What it means: Because of the random sampling, Bagging has a built-in testing system .
The translation: When the computer pulls a random sample to build a tree, it leaves about 1/3 of the spreadsheet behind . It can immediately use that leftover data to test the tree and see how accurate it is, saving you a massive amount of coding time
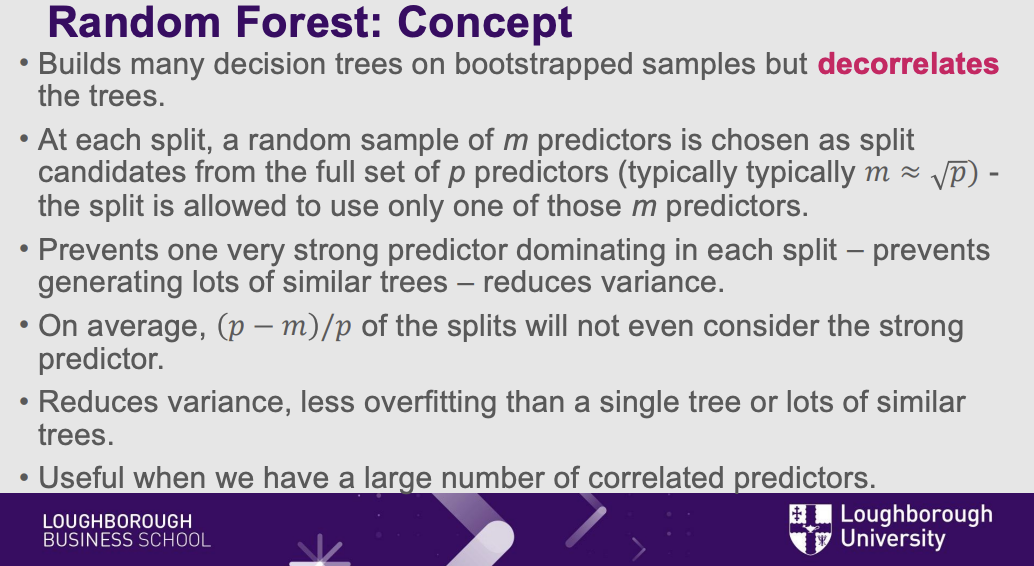
What is random forest concepts
Solution Part 2: Feature Randomness (Decorrelating the Trees)
The Concept: This is the most crucial part of the Random Forest algorithm. When a tree is trying to make a decision (a split), it is not allowed to look at all the variables at once. It is only allowed to choose from a small, random subset of variables (e.g., $m \approx \sqrt{p}$).
The Solar Example: Suppose "Household Income" is a massively dominant, obvious predictor of buying solar panels. If every tree could see all variables, every single tree would split on "Income" first. You would end up with 500 identical trees making the exact same mistakes.
By randomly hiding the "Income" variable from some of the trees, the algorithm forces them to look for secondary, subtler clues—like "Environmental Beliefs," "Government Subsidies," or "Roof Size." This forces the trees to become highly diverse and decorrelated from one another.
4. The Final Result: Variance Reduction
The Conclusion: A single deep decision tree has high variance (it makes wild, over-sensitive guesses). However, because the Random Forest is made up of hundreds of diverse, decorrelated trees, their individual, weird mistakes cancel each other out.
By averaging the predictions of this diverse committee, the Random Forest dramatically reduces the overall variance without increasing the bias. The final prediction becomes incredibly stable, robust, and highly resistant to overfitting.
More clever than bagging (samples and averages between different trees), bagging the trees are very similar, some of the predictors will dominate the splits. Random forest corrects for this.
Draws the random sample of predictors from the predictors space, then choose the best predictor from a sub sample…..
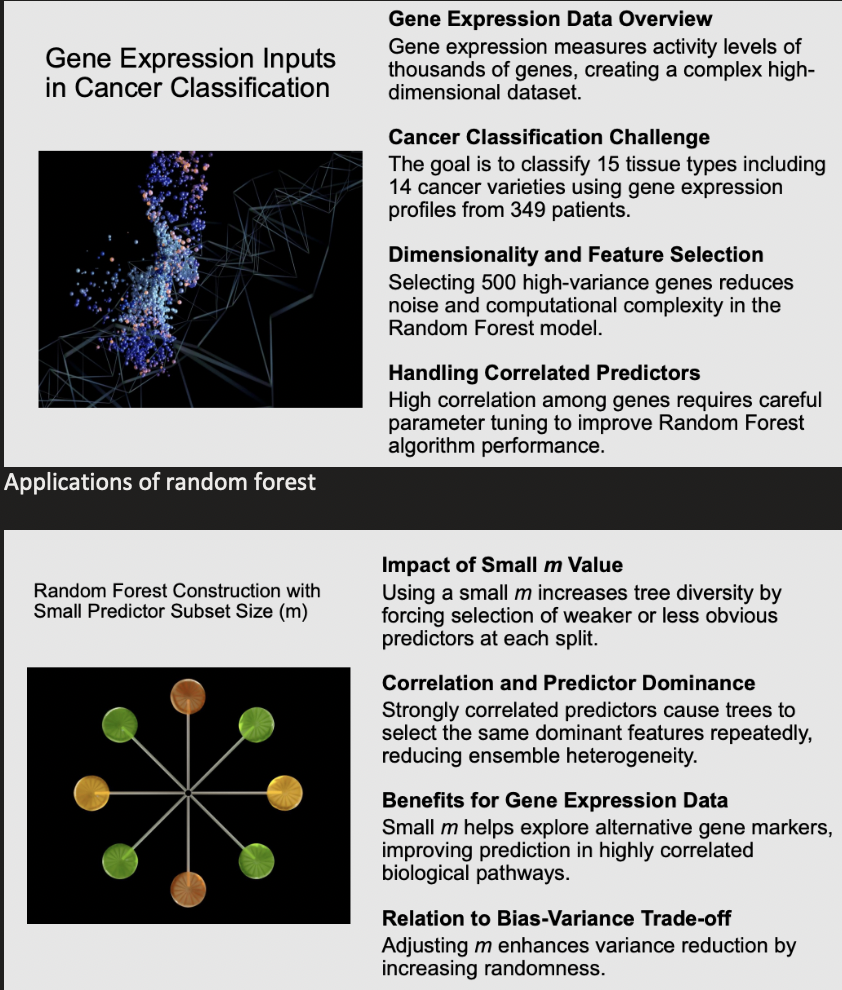
Example of random forest
What it means: This is a real-world example of why Random Forests are amazing .
The translation: Predicting cancer using DNA means looking at thousands of genes that are highly correlated. If you didn't force the computer to randomly restrict its choices (using a small "$m$" value), it would only ever look at the loudest, most obvious gene . Random Forests force the computer to explore the quieter genes, making the cancer prediction highly accurate
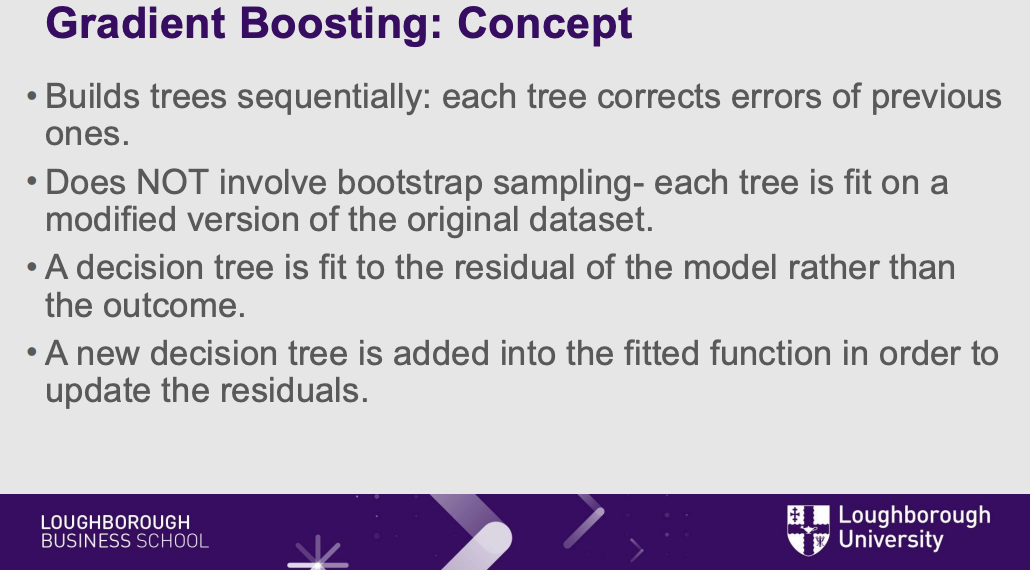
What is gradient boosting concept
What it means: This is a completely different way to build a forest .
The translation: Bagging and Random Forests build 100 trees at the exact same time and let them vote. Boosting builds trees one at a time, in a chain. * Tree 1 makes a prediction. It makes some mistakes.
Tree 2 only looks at the mistakes (the "residuals") from Tree 1 and tries to fix them .
Tree 3 only looks at the mistakes from Tree 2.
It is a slow, methodical learning process where every new tree is purely focused on fixing the errors of the past.
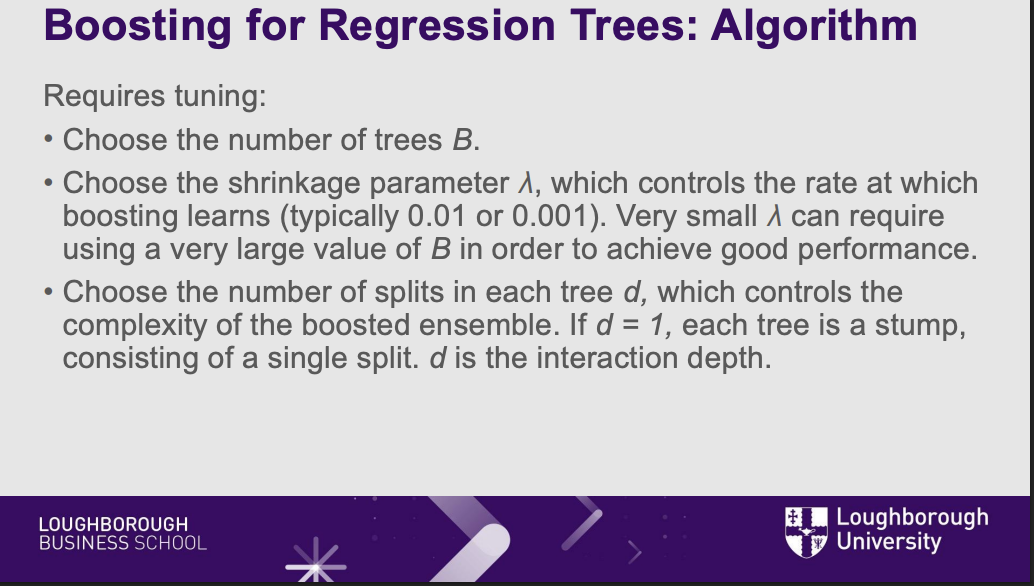
What does gradient boosting for regression tree require?
What it means: Because this model learns slowly, you have to give it strict instructions so it doesn't overfit .
The translation: You have three dials:
B: How many trees to build.
Shrinkage ($\lambda$): How fast it learns. Usually set very low (0.01) so it doesn't jump to conclusions .
Depth ($d$): How big each tree is allowed to get. Usually, they are kept tiny (called "stumps")