Ecology Ch.10
1/16
There's no tags or description
Looks like no tags are added yet.
Name | Mastery | Learn | Test | Matching | Spaced | Call with Kai |
|---|
No analytics yet
Send a link to your students to track their progress
17 Terms
What is a life table and what are it’s parameters?
A life table is a tool for tracking what happens to a population over time by recording Nx, Sx, lx, and Fx
Nx=number of individuals alive at time x
Sx= proportion of individuals alive at time x+1 compared to x ( Nx+1 / Nx)
lx = age specific survivorship - proportion of individuals living from birth to age x (Nx/ No)
Fx =age specific fecundity— average number of offspring produced by female at age x
From lx and mx you can predict mean life span, future age distributions, and future population size
cohort life table follows actual individuals from birth to death, which is more accurate;
static life table takes a snapshot at the age of death and infers survival from the age distribution, which is less accurate because it assumes conditions stay constant.
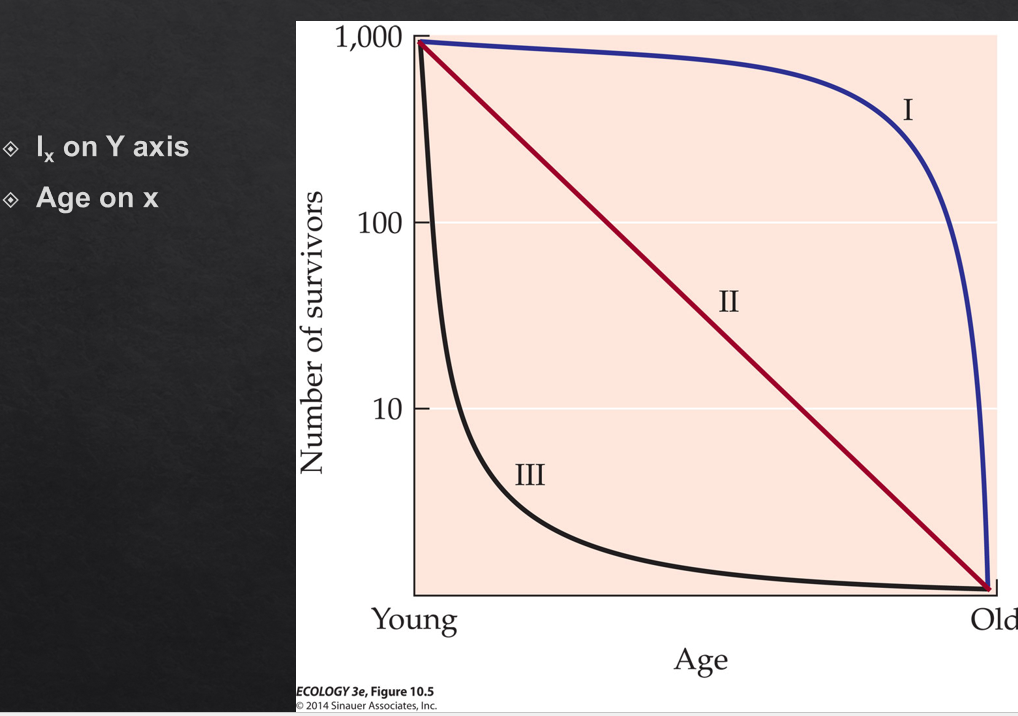
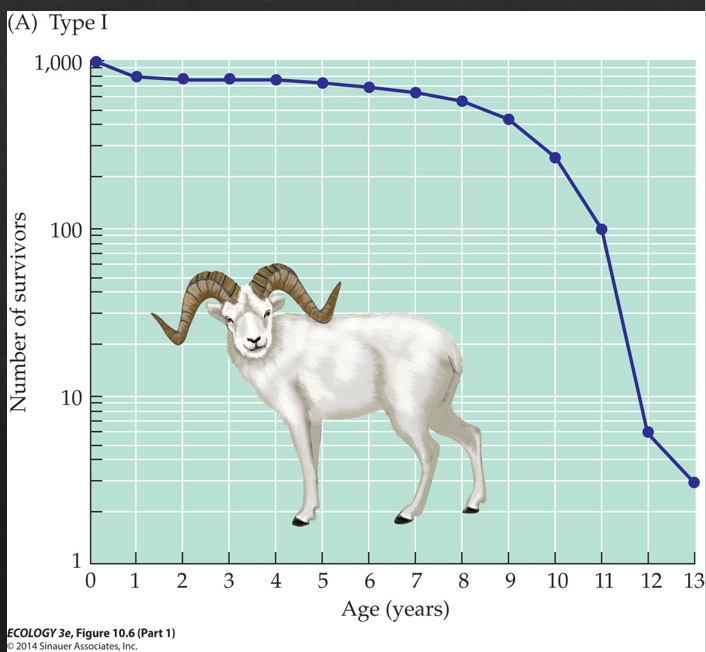
What is a type one survivorship curve?
Followed by humans and sheep large mammals)
Characterized by most individuals living past an early age and then dying at an old age
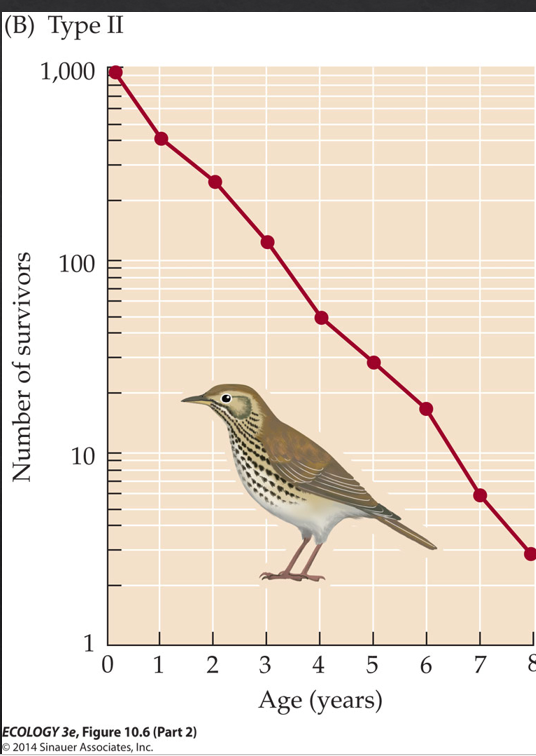
What is a type two survivorship curve?
Many mammals and small birds
Constant mortality rate across all ages
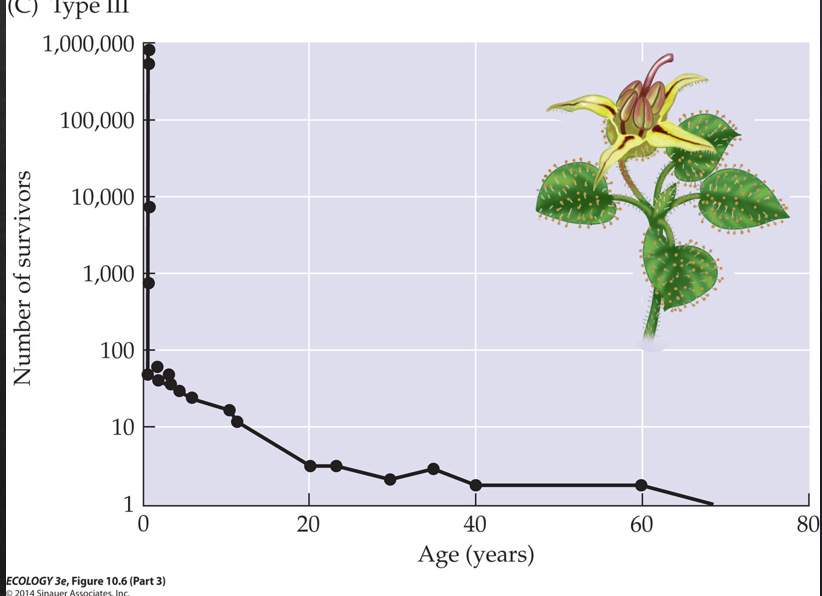
What is a type 3 curve?
Most organisms die young
plants, marine invertebrates with larval stages
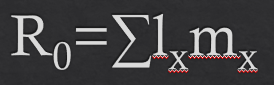
What is R0 and how do you calculate it?
R0 is the net reproductive rate. It is calculated by summing the Lx time mx calculation in each time.
R0 tells you how many daughters a female produces over her entire lifetime on average
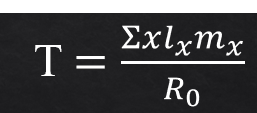
What is generation time and how do you calculate it?
Summation of x times lx time mx divided by R0
A T of 1.62 with and R0 of 1.78 means that a female will produce 1.78 offspring every 1.62 years.
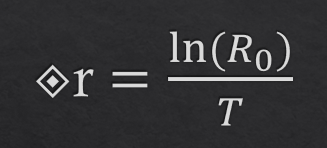
How do you calculate the instantaneous growth rate?
r= ln(R0)/T
What is lamda?
Lamda is the yearly population growth rate. It is calculated by Nt+1/ Nt
How do you predict population size at a time t?
If generations don’t overlap
Nt= N0 R^t
If generations overlap, R= e^r
Nt = N₀eʳᵗ
N₀ = population size right now (at time 0)
Nt = population size at some future time t
r = instantaneous per capita growth rate
t = amount of time elapsed
e = Euler's number (~2.718), the base of natural logarithm
How do you find doubling time?
Nt= Noe^rt
Doubling is when Nt/N0 =2
Nt/No= e^rt
2=e^rt
ln(2)=rt
What does exponential growth assume?
Infinite resources, which is not realistic.
dN/dt = rN
What is logistic growth and what are its assumptions?
Carrying capacity K because resources are finite
Logistic growth model incorporates K and intraspecific competition
dN/dt= rN((K-N/K)) which simplifies to dN/dt=rN(1- N/K)
(K-N/K) = Intraspecies competition factor
closed population
K and r are constant
Linear density dependence
no interspecific competition
no time lags
all members in the same cohort
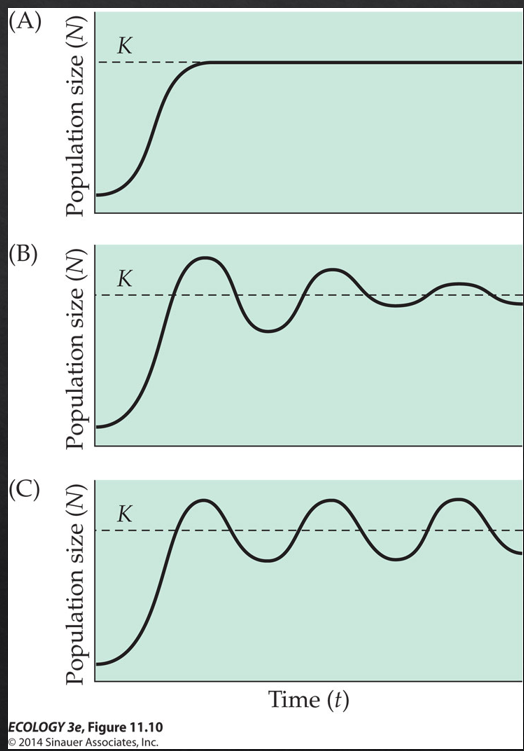
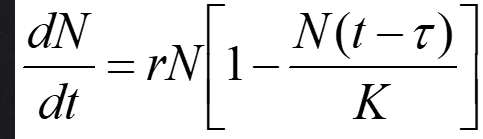
What is time lag?
A complication to the logistic model: populations don't respond to current density instantaneously. There is often a delay between when a density change occurs and when the population responds to it reproductively or behaviorally. When time lags are short, the population still smoothly approaches K. As τ increases, the population overshoots K before correcting, producing oscillations. If τ is long enough, those oscillations can become stable cycles or even chaotic fluctuations — the population perpetually overshoots and crashes without ever settling at K.
dN/dt = rN ( 1(-N(time - time lag)/K))
What is the time lag equation
What is density independent regulation?
means external factors — weather, storms, drought — affect the population regardless of how large it is. A hard freeze kills the same proportion of insects whether there are 100 or 10,000.
What is density dependent regulation?
means the per capita effect of a factor gets stronger as population density increases — food runs short, disease spreads more easily, predators focus on the species
Important equations
Life Table Equations
lx = number surviving to age x / number alive at age 0
mx = average number of female offspring produced by a female of age x
R₀ = Σ(lx × mx) Net reproductive rate — daughters produced per female per lifetime
T = Σ(x × lx × mx) / R₀ Generation time — average age of reproduction
Growth Rate Conversions
r = ln(R₀) / T Instantaneous per capita growth rate, calculated from life table
r = ln(λ) Instantaneous per capita growth rate, calculated from census data
λ = eʳ Finite rate of increase — multiply current population by this to get next time step's population
λ = Nt+1 / Nt Finite rate of increase calculated directly from census counts
Exponential Growth
dN/dt = rN Rate of population change at any instant — the calculus form
Nt = N₀Rᵗ Discrete form — use when generations don't overlap
Nt = N₀eʳᵗ Continuous form — use when generations overlap, which is most of the time
t = ln(2) / r = 0.693 / r Doubling time
Logistic Growth
dN/dt = rN[(K - N) / K] Full logistic growth equation
(K - N) / K The intraspecific competition function (ICF) — this is the term that slows growth as N approaches K. Equals 1 when N is near 0, equals 0 when N = K
K Carrying capacity — the population size at which dN/dt = 0 and growth stops