Econ 2006 Chapter 11
1/23
There's no tags or description
Looks like no tags are added yet.
Name | Mastery | Learn | Test | Matching | Spaced | Call with Kai |
|---|
No analytics yet
Send a link to your students to track their progress
24 Terms
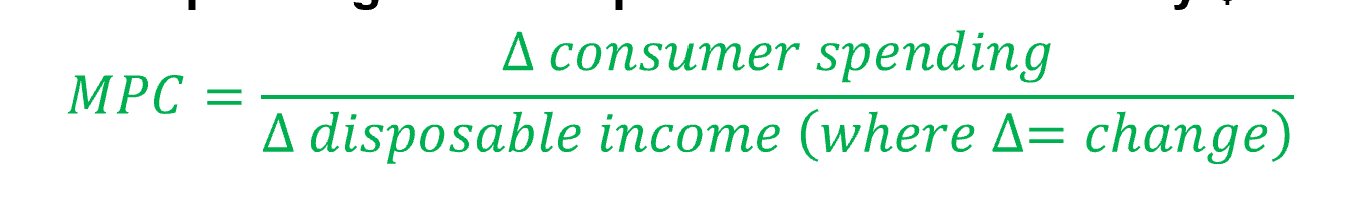
MPC: Marginal Propensity to Consume
means how much of an extra dollar of income people spend.
Formula: = change in consumer spending / change in disposable income
MPS: Marginal Propensity to Save
means how much of an extra dollar people save.
Formula: = 1 − MPC
consumption function
Shows how consumer spending changes when disposable income changes. MPC is the slope of the consumption function.
c = a + MPC × yd
c = consumer spending
a = autonomous consumer spending
MPC = marginal propensity to consume
yd = disposable income
Autonomous consumer spending
is spending that happens even if income is zero. For example, people may still buy food, basic needs, or use savings/borrowing even with no current income.
On a graph, autonomous spending is the vertical intercept.
UPWARD Shift in the aggregate consumption function
It shifts up when people spend more at every income level.
This can happen when:
Expected future income rises
If people think they will earn more in the future, they may spend more now.
Aggregate wealth rises
If people’s homes, stocks, or savings become more valuable, they feel wealthier and spend more.
More confidence or wealth = consumption function shifts up
DOWNWARD Shift in the aggregate consumption function
It shifts down when people spend less at every income level.
This can happen when:
People expect lower future income, or their wealth falls.
Less confidence or wealth = consumption function shifts down
Investment spending
is business spending on things like: Factories, equipment, machines, buildings, and inventories.
What affects planned investment spending?
1. Interest rate
If interest rates rise, borrowing becomes more expensive. → So firms invest less.
If interest rates fall, borrowing becomes cheaper. → So firms invest more.
2. Expected future real GDP
If businesses expect the economy to grow, they expect more future sales. →So they invest more.
3. Current production capacity
If firms already have unused factories or machines →they do not need to invest much.
If they are near full capacity → they may invest more.
Accelerator principle
When real GDP grows faster, planned investment spending increases.
When real GDP grows slower, planned investment spending decreases.
In simple terms:
Businesses invest more when they think demand is growing.
Planned inventory investment
= inventory changes businesses expected and intended.
Unplanned inventory investment
happens when actual sales are different from what businesses expected.
Positive unplanned inventory investment
This means inventories rise unexpectedly. It happens when firms produce more than people actually buy.
Negative unplanned inventory investment
This means inventories fall unexpectedly. It happens when firms produce less than people want to buy.
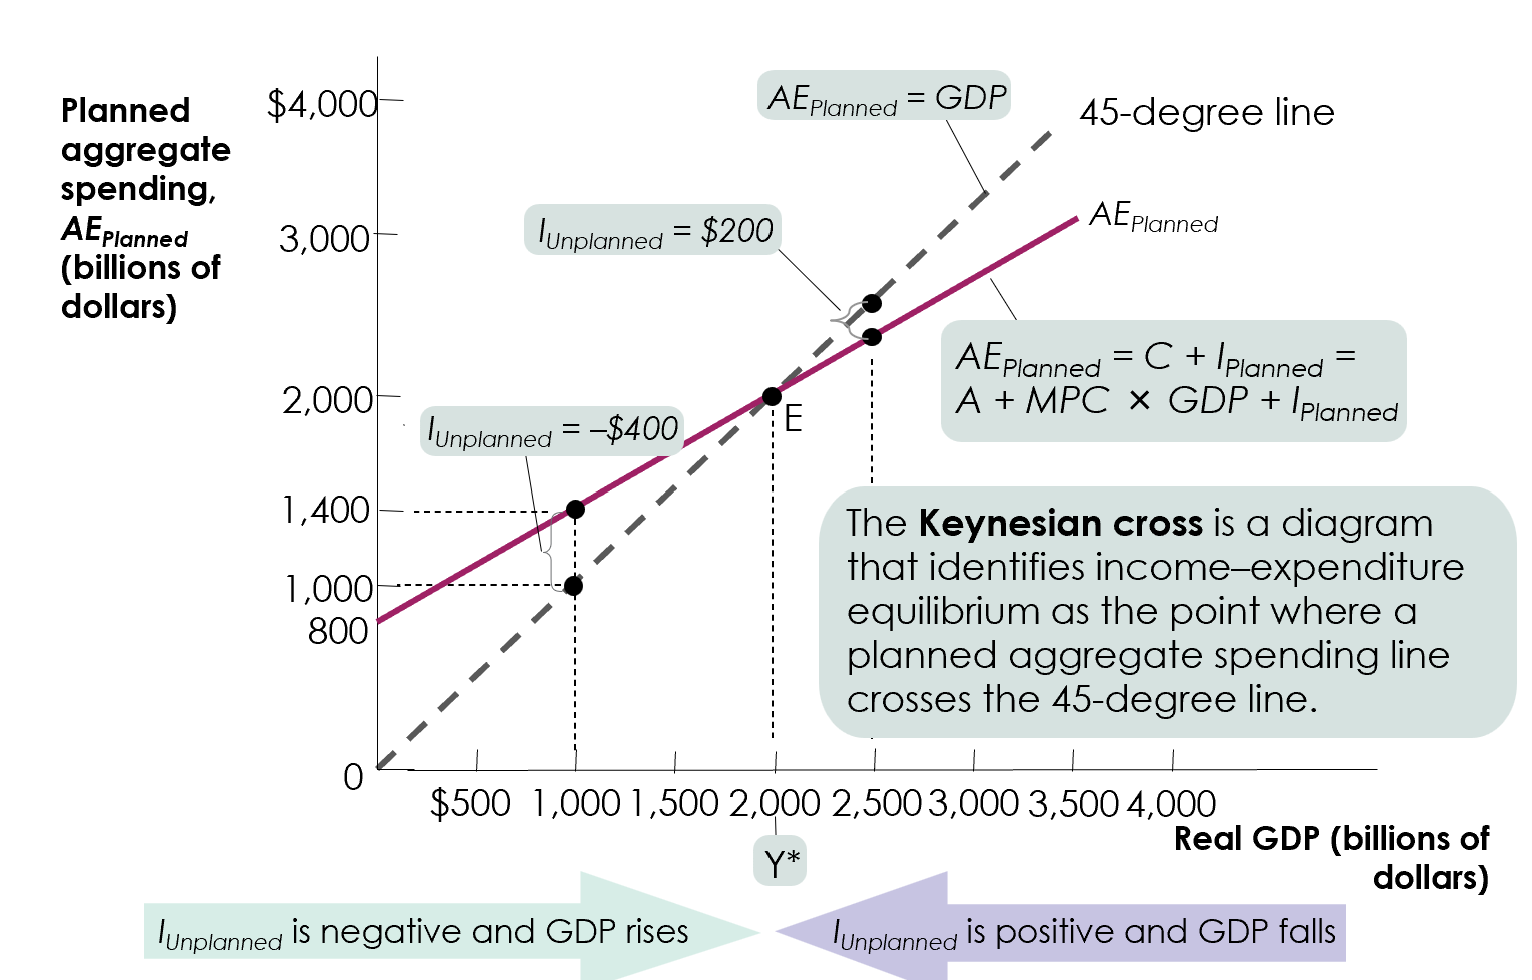
Planned aggregate spending
the total amount of spending people and businesses plan to do in the economy.
AEplanned = A + MPC × GDP + Iplanned
This means planned spending depends on:
Autonomous consumer spending, the MPC, GDP, and planned investment.
Income-expenditure equilibrium
The economy is in equilibrium when: Real GDP = planned aggregate spending
GDP = AEplanned
If GDP is greater than planned spending:
Firms produced more than people wanted to buy.
Inventories rise.
Unplanned inventory investment is positive.
Firms cut production.
GDP falls.
If GDP is less than planned spending:
People want to buy more than firms produced.
Inventories fall.
Unplanned inventory investment is negative.
Firms increase production.
GDP rises.
GDP > AEplanned → inventories rise → production falls
GDP < AEplanned → inventories fall → production rises
Keynesian cross
The 45-degree line shows where:
GDP = AEplanned
The economy is in equilibrium where the planned aggregate spending line crosses the 45-degree line.
That point is called: Y*
paradox of thrift
means that what is good for one person can be bad for the economy if everyone does it at the same time.
Change in GDP formula