How markets work (1.2)
1/137
There's no tags or description
Looks like no tags are added yet.
Name | Mastery | Learn | Test | Matching | Spaced | Call with Kai |
|---|
No analytics yet
Send a link to your students to track their progress
138 Terms
What consumers do
Maximise utility
What producers do
Maximise profit
What government does
Maximise welfare
Demand
The quantity of a good/service that consumers are able and willing to purchase at a given price in a given period of time.
The Law of Demand
There is an inverse relationship between price and quantity demanded. As price of a good/service increases, quantity demanded decreases and vice versa, assuming ceteris paribus.
Moving up the demand curve
Contraction of demand

Moving from b to a
Contraction of demand
Moving down the demand curve
Extension of demand
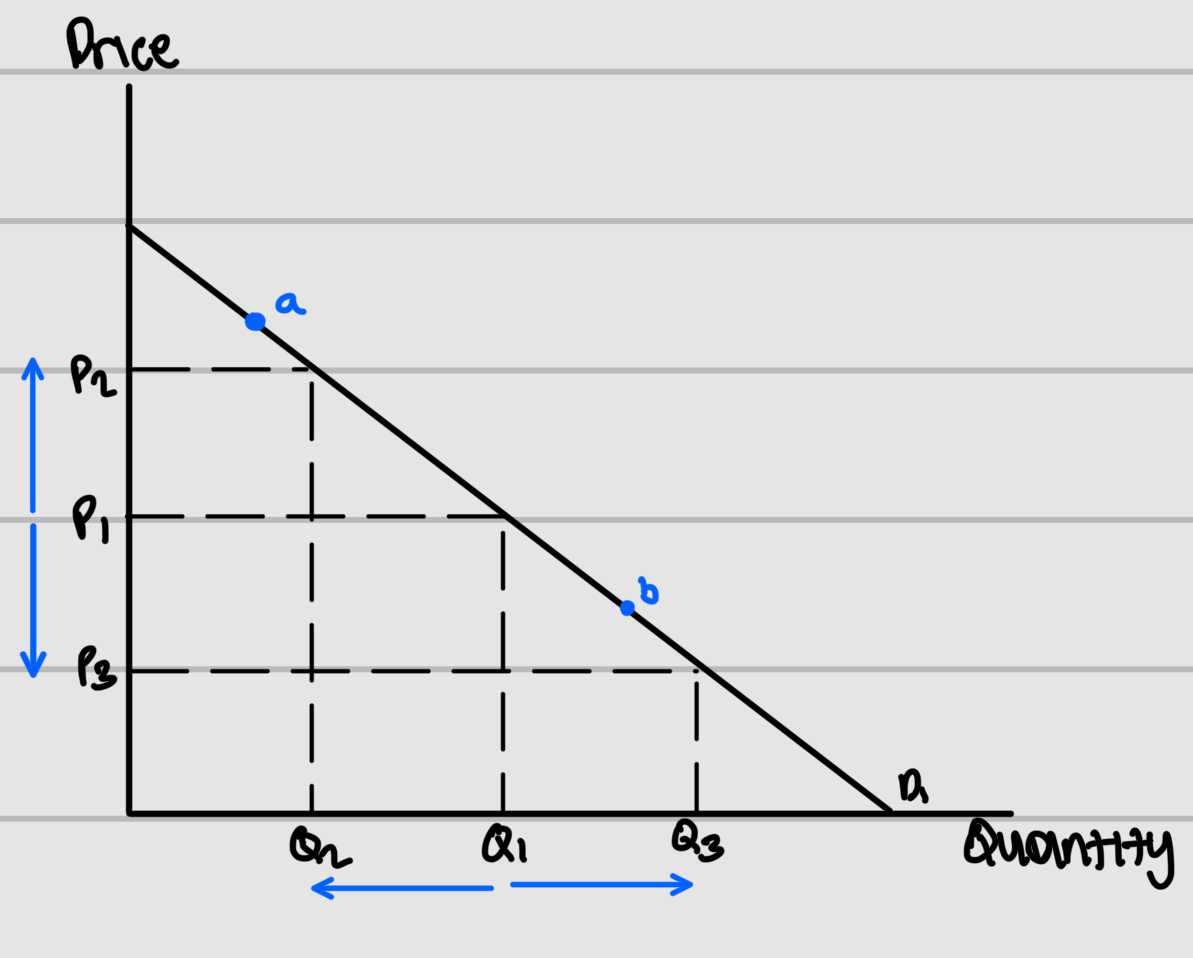
Moving from a to b
Extension of demand
Reasons for downward sloping demand curve
Income effect
Substitution effect
Both cause movement along the curve
Non-price factors affecting demand
Population
Advertisement
Substitutes price
Income
Fashion/trends
Interest rates
Complements price
Price elasticity of demand
How responsive the quantity demanded of a product is given a change in price
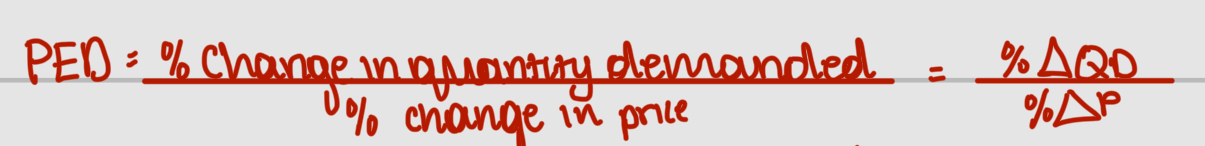
Equation of PED
Is PED always negative or positive
Negative
Why PED is always negative
The law of demand - Price and quantity demanded have a negative/inverse relationship
PED >1
Demand is price elastic
PED <1
Demand is price inelastic
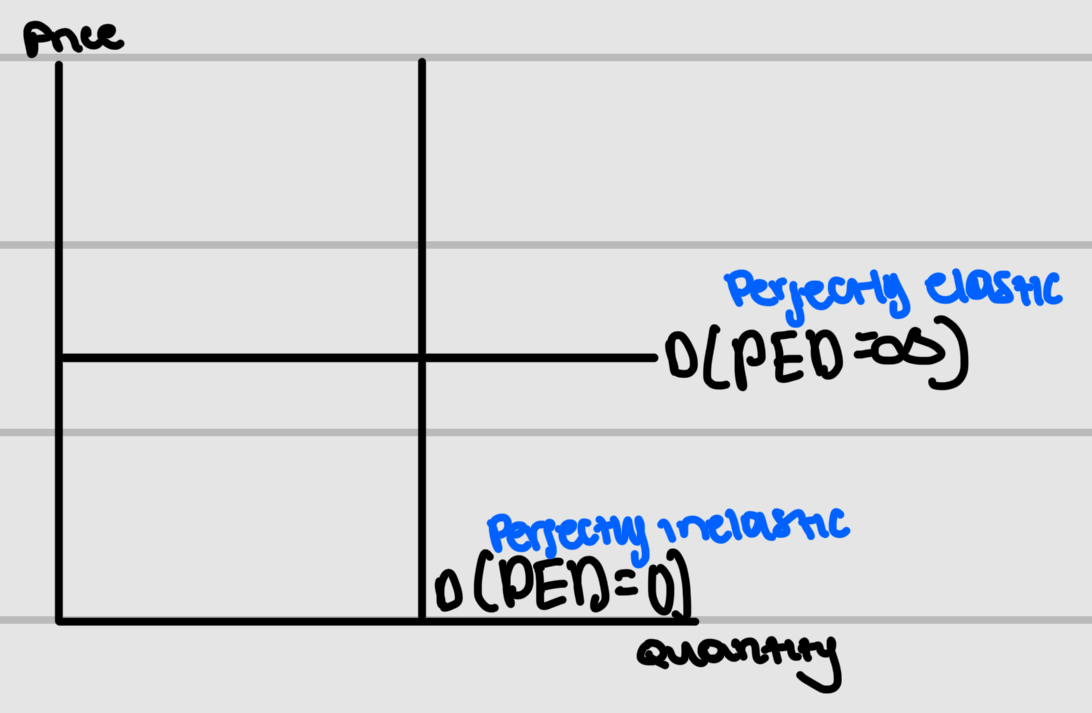
PED = 0
Demand is perfectly price inelastic
PED = infinity
Demand is perfectly price elastic
PED = 1
Demand is unitary/ unit price elastic
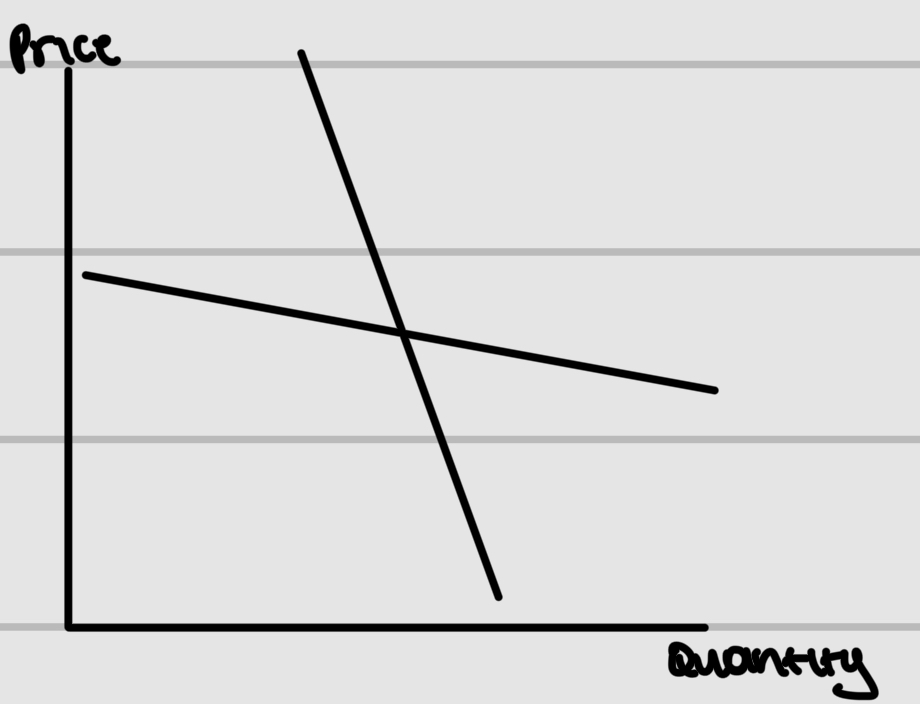
Label the type of elasticity of the demand curves and what their PED would be
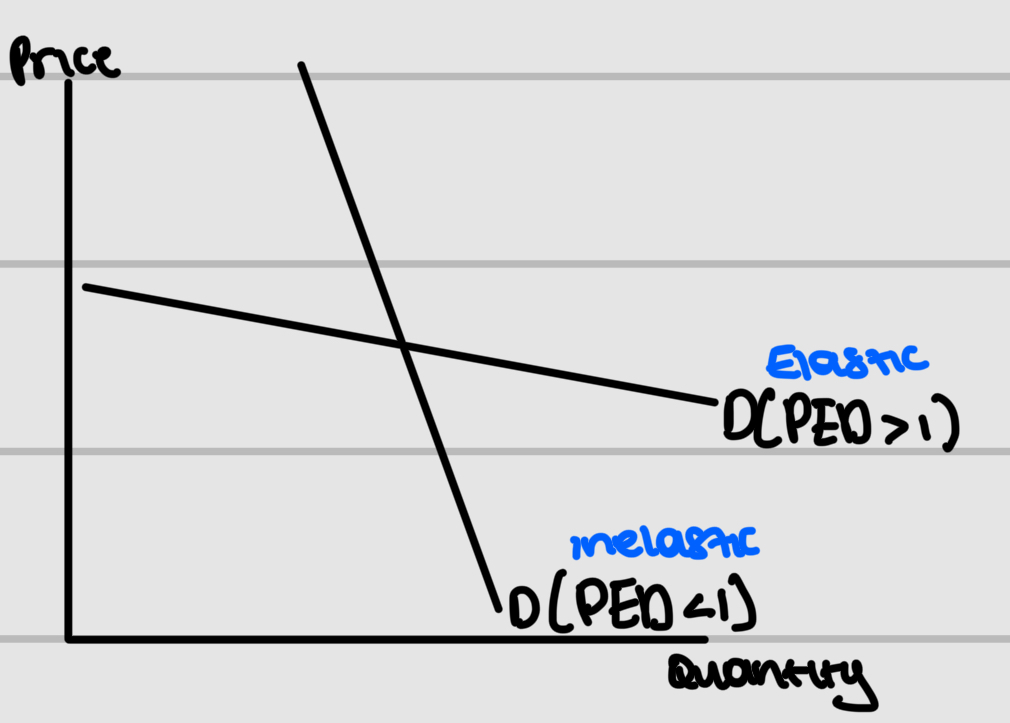
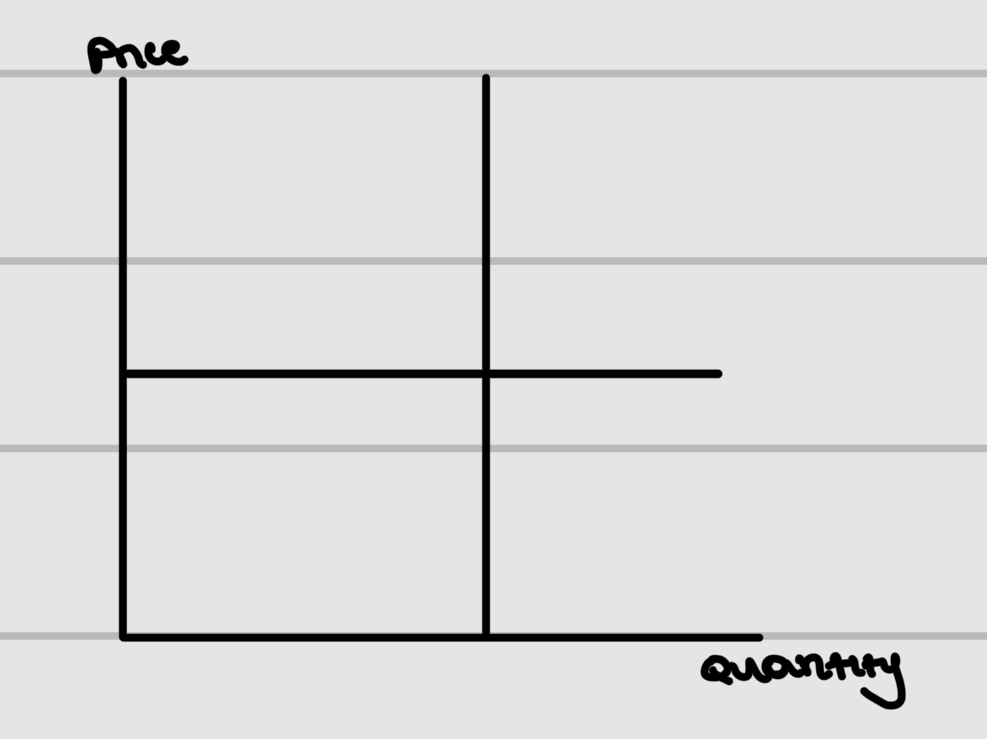
Label the type of elasticity of the demand curves and what their PED would be
Factors affecting PED
Substitutes (no.)
Percentage of income
Luxury/necessity
Addictive/habit forming
Time period
Income elasticity of demand (YED)
Measures the responsiveness of the quantity of a good/service demanded given a change in income
Equation of YED

What YED helps us determine about a good
Whether the good is a normal good or an inferior good
Normal good
Positive relationship between income and demand
Inferior good
Inverse relationship between income and demand
YED for normal goods
Positive YED
YED for inferior goods
Negative YED
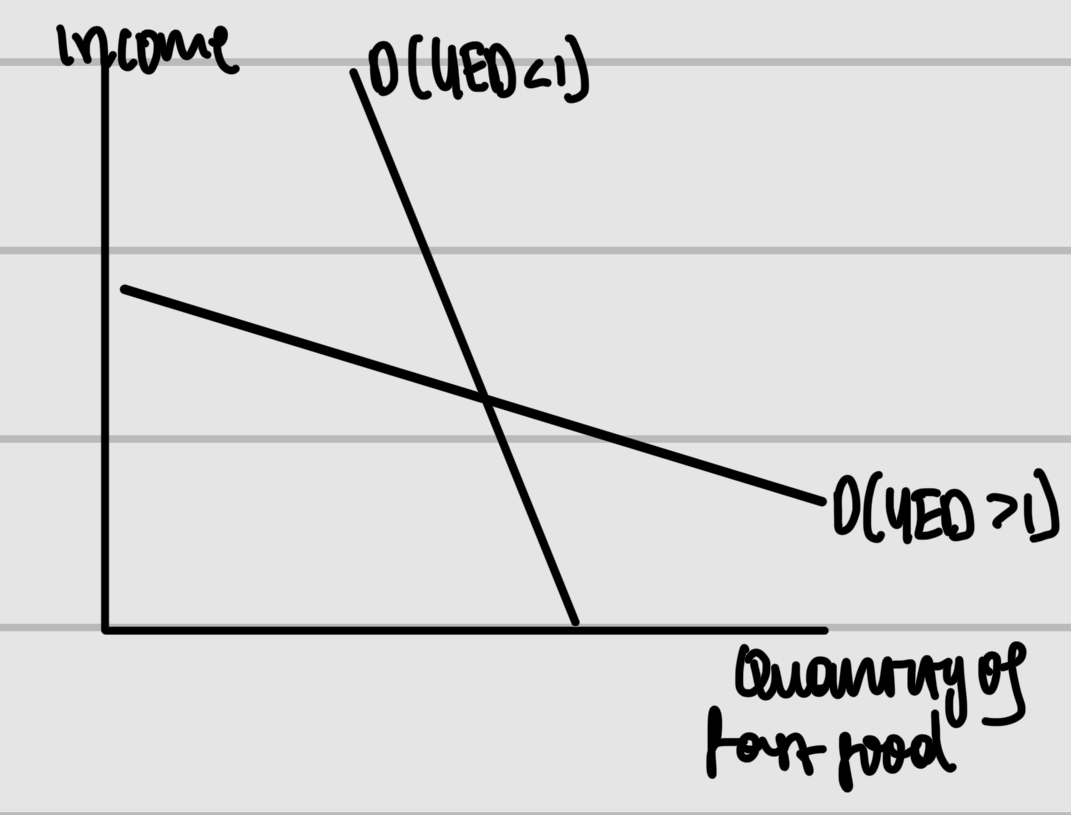
Normal good where YED >1
Demand is income elastic and it is a normal luxury good
Normal good where YED <1.
Demand is income inelastic and it i a normal necessity
Inferior good where YED >1
Demand is income elastic
Inferior good where YED <1
Demand is income inelastic
YED = 0
Demand is perfectly inelastic
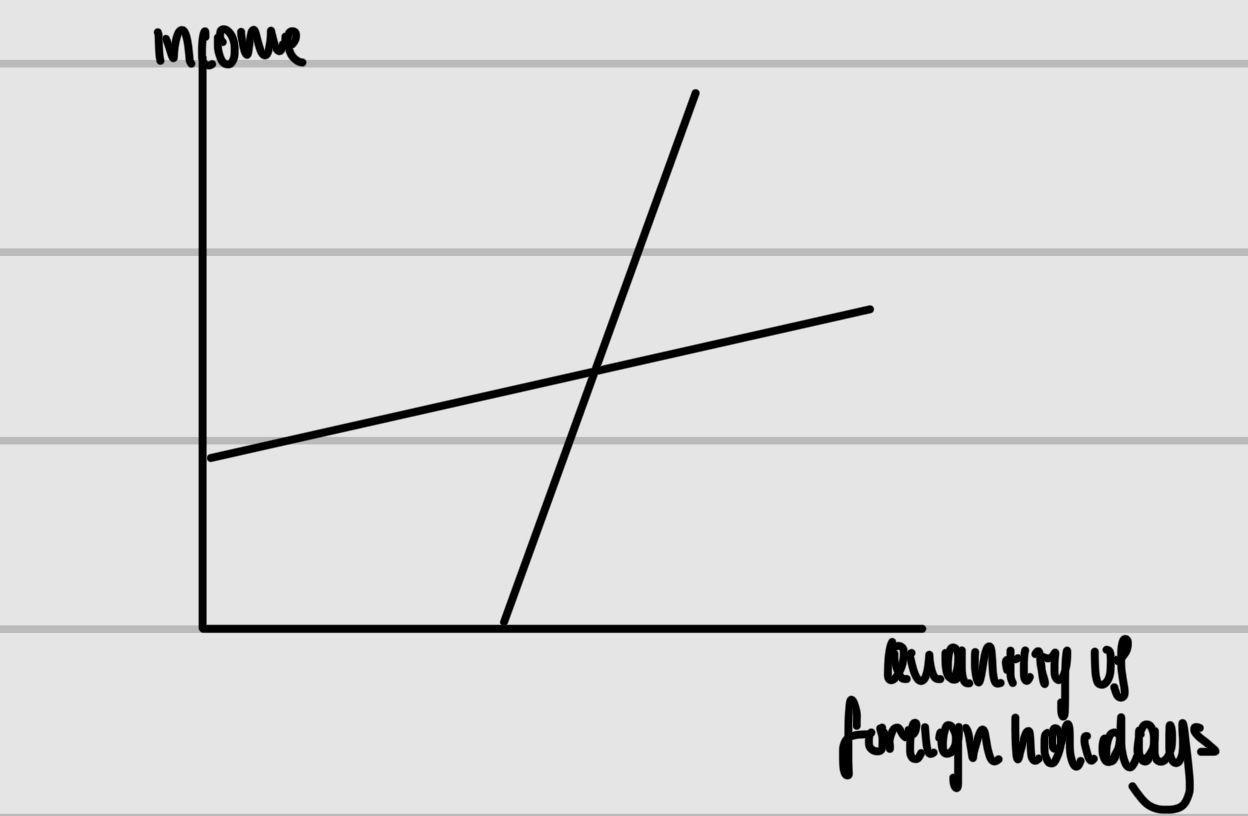
Label the type of elasticity of the demand curves and what their YED would be
Normal goods
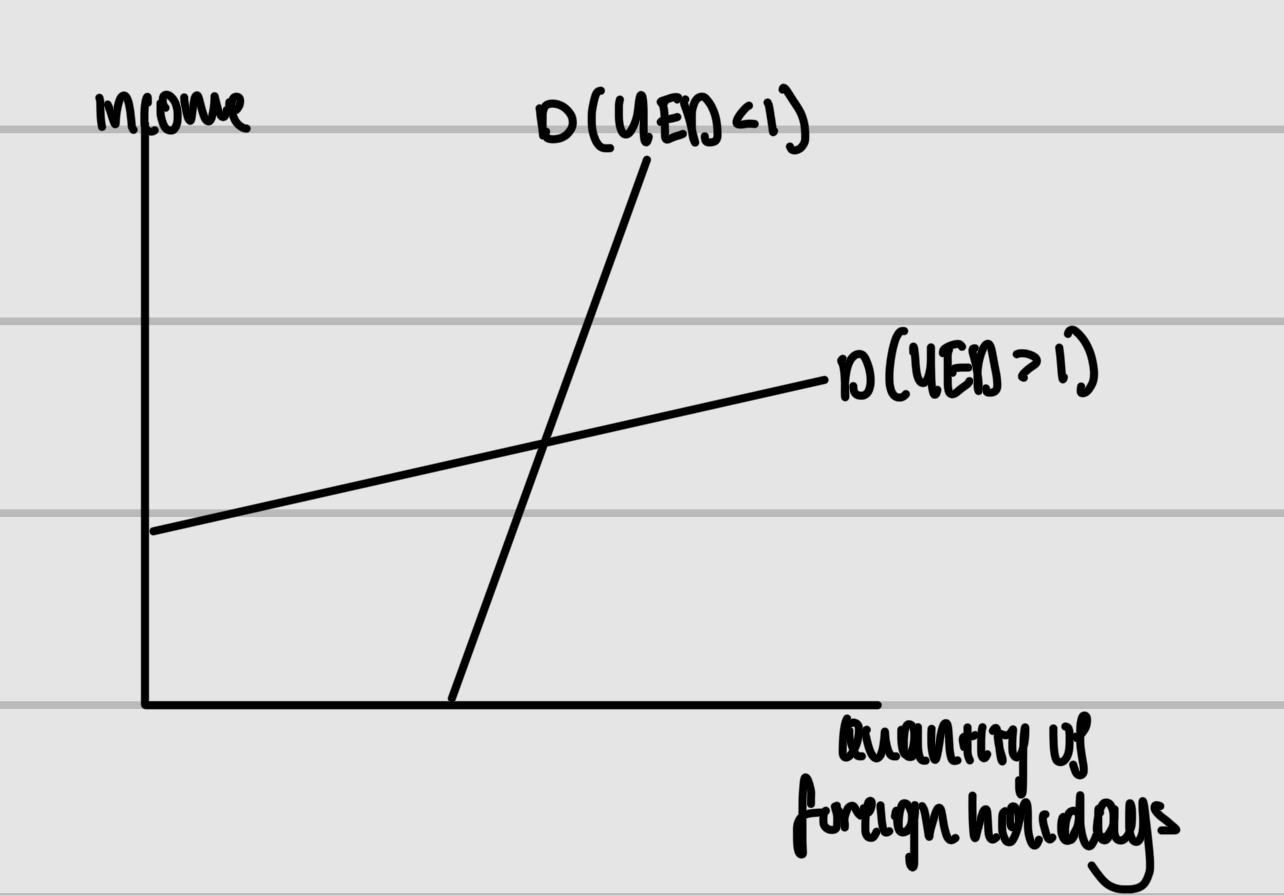
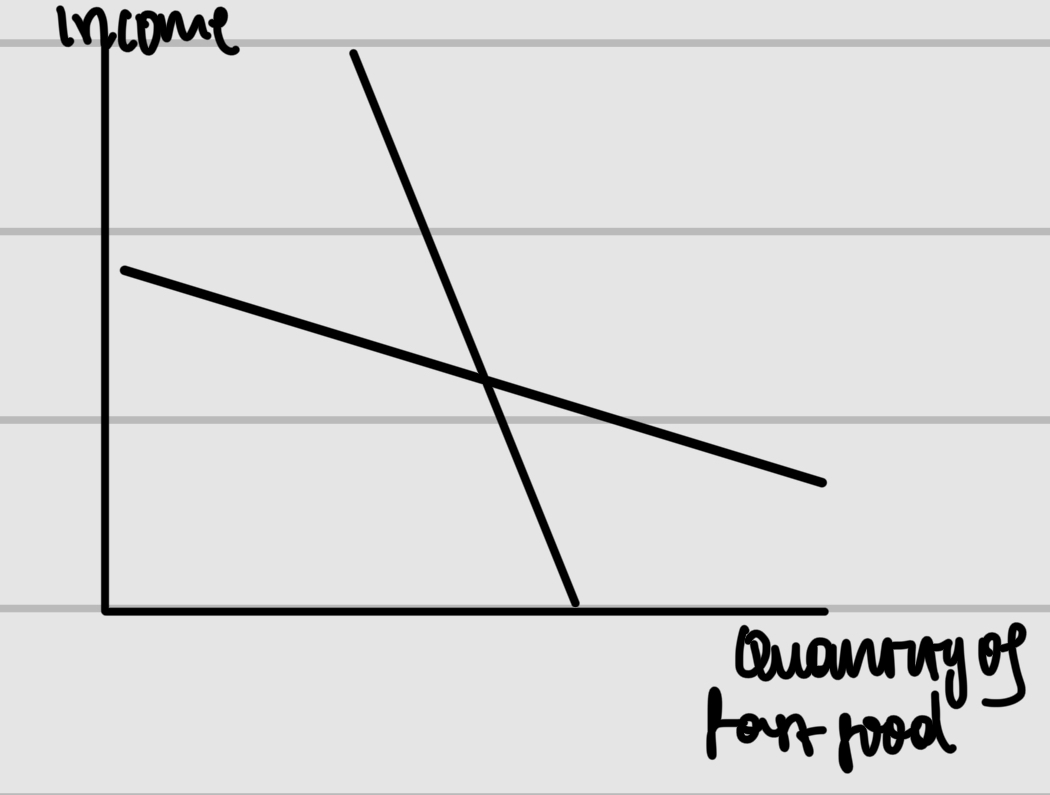
Label the type of elasticity of the demand curves and what their YED would be
Inferior goods
Cross elasticity of demand (XED)
Measures the responsiveness of quantity demanded of a good/service given a change in price of another good/service
What XED is used to figure out
Whether two goods have any relation to each other(substitute or complementary) and how strong this relation is.
Equation of XED

Positive XED
Substitute goods
Negative XED
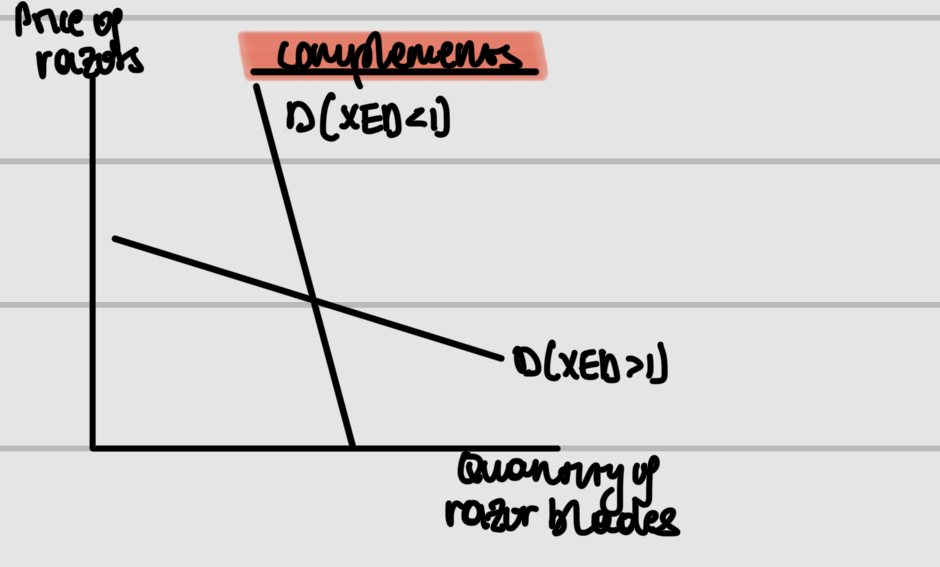
Complementary goods
XED without sign >1
Demand between the goods/services is price elastic and the goods/services are strongly related
XED without sign <1
Demand between the goods/services is price inelastic and the goods/services are weakly related
XED without sign = 0
Demand between the goods/services is perfectly price inelastic and the goods/services have no relationship
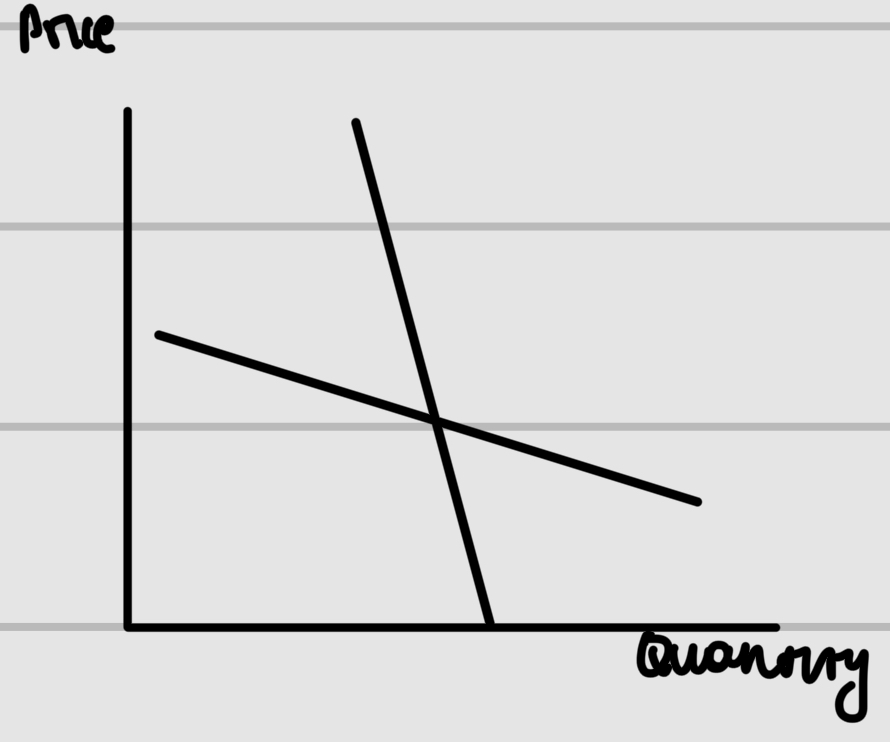
Label the type of goods shown by the graph and what the XED of the demand curves would be
PED’s cruciality in businesses
Helps businesses make pricing decisions to increase their total revenue
Equation for Total revenue

Relationship between PED and price changes, with total revenue
Elastic - Elastic
Only - Opposite
Irritates - Inelastic
Skin - Same
Affect on total revenue if the price is increased for an elastic good
Total Revenue decreases
Affect on total revenue when the price is decreased for an elastic good
Total Revenue increases
Affect on Total Revenue when the price is increased for an inelastic good
Total Revenue increases
Affect on the Total Revenue when the price for and inelastic good is decreased
Total Revenue decreases
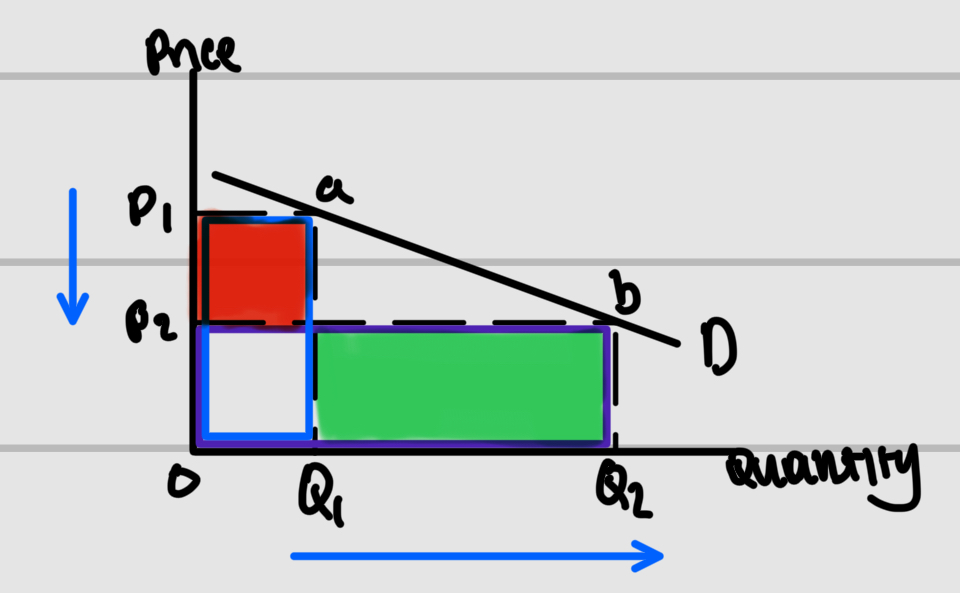
The type of elasticity this good has and what the green section represent
Elastic good and the section represents Revenue gained


The type of elasticity this good has and what the blue section represent
Elastic and the section represents the initial revenue


The type of elasticity this good has and what the purple section represent
Elastic and the section represents the New revenue


The type of elasticity this good has and what the red section represent
Elastic good and the section represents Revenue lost


The type of elasticity this good has and what the green section represent
Inelastic and the section represents revenue gained


The type of elasticity this good has and what the red section represent
Inelastic and the section represents revenue lost
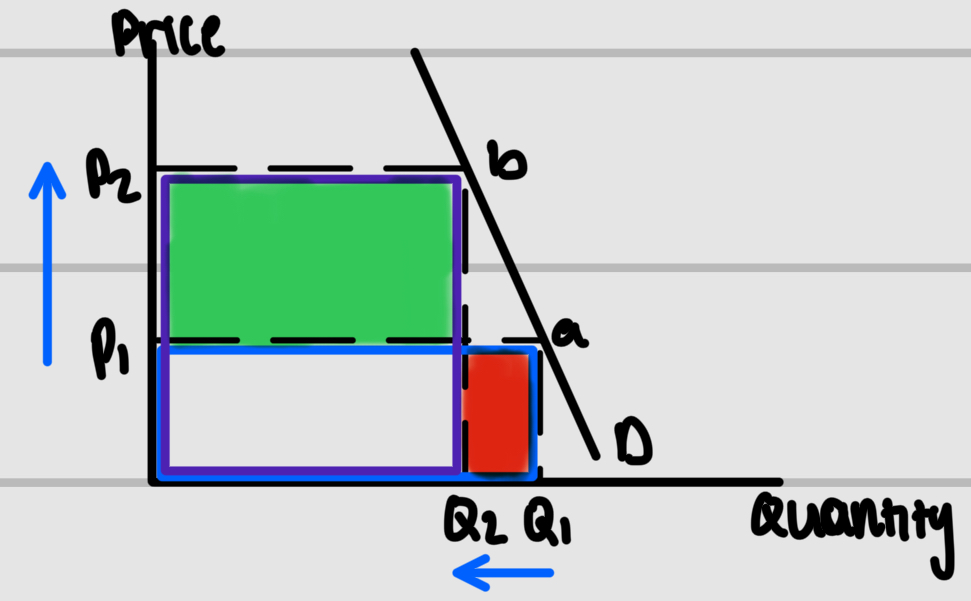

The type of elasticity this good has and what the blue section represent
Inelastic and the section represents the initial revenue


The type of elasticity this good has and what the purple section represent
Inelastic and the section represents the new revenue

Supply
The quantity of a good/service that producers are willing and able to produce at a given price in a given time period
Law of supply
There is a positive relationship between price and quantity supplied. As price increases, quantity supplied increase and vice versa, assuming ceteris paribus
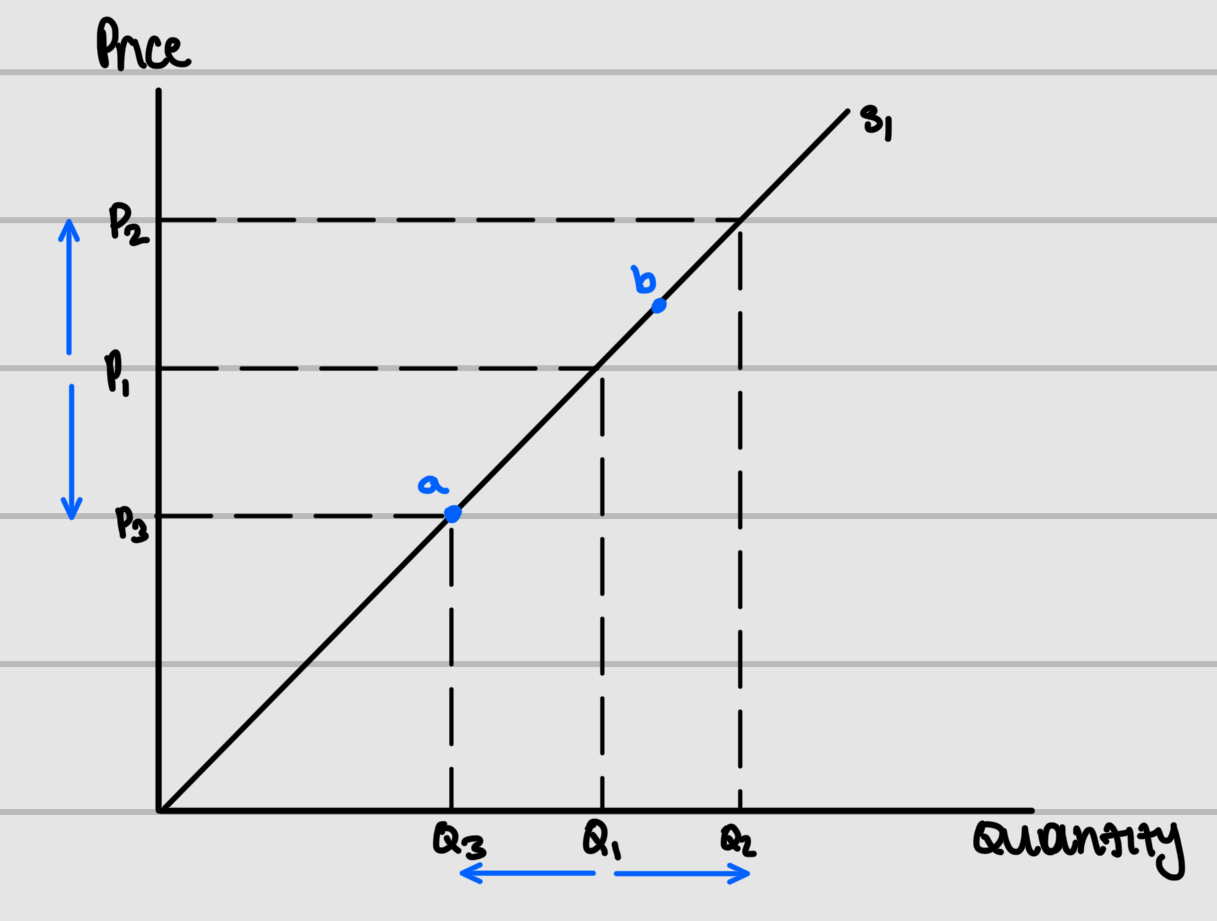
Moving from a to b
Extension of supply

Moving from b to a
Contraction of supply
Why there is a positive relationship between price and supply
Profit motive
When price increases producers produce more to increase profit
When quantity increases, producers increase the price of the goods or service to account for production costs and to increase profit
Non-price factors affecting supply, shifting the supply curve
Productivity
Indirect tax
No. of firms
Technology
Subsidies
Weather
Costs of production
Price elasticity of supply (PES)
Measures the responsiveness of quantity supplied to a given change in price
Equation of PES

Is PES always negative or positive
PES is always positive
Th reason why PES is always positive
The Law of Supply - There is a positive relationship between price and quantity supplied
PES >1
Supply is price elastic
PES <1
Supply is price inelastic
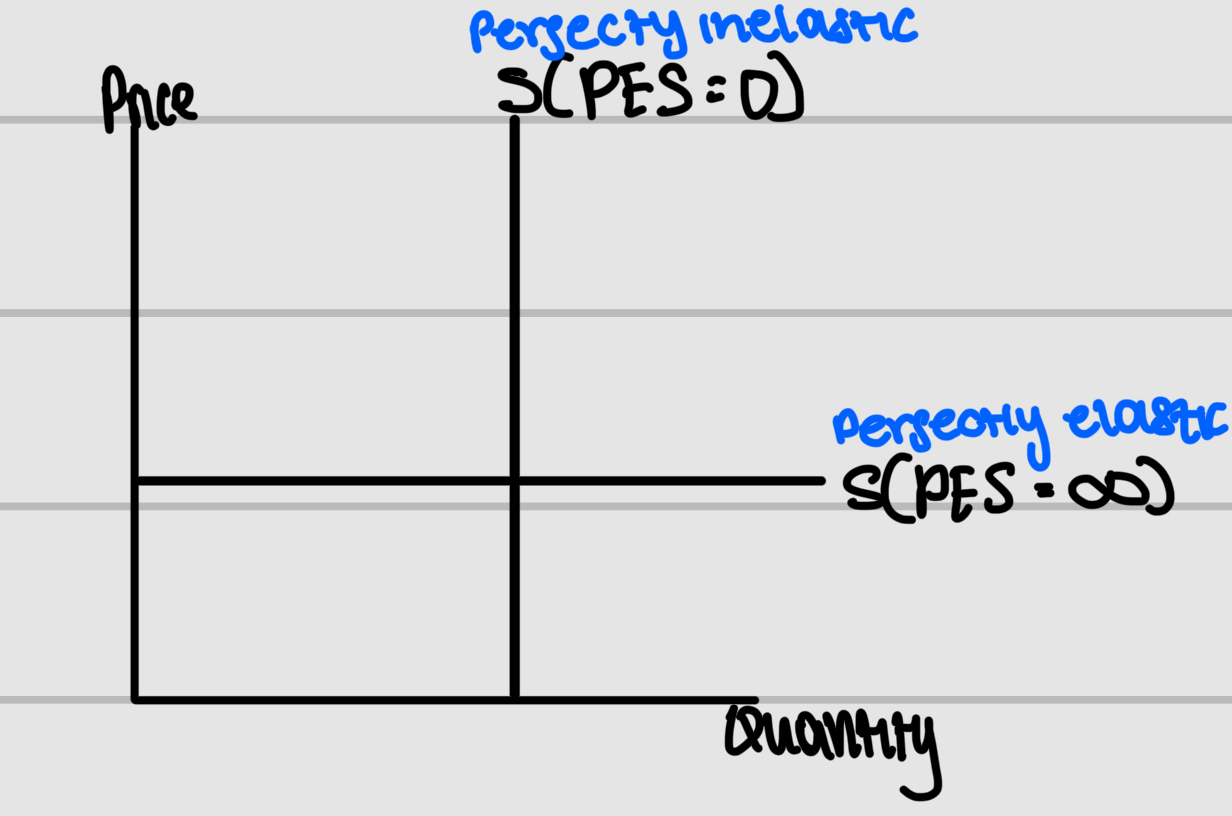
PES = infinity
Supply is perfectly price elastic
PES = 0
Supply is perfectly price inelastic
PES = 1
Supply is unitary/unit price elastic
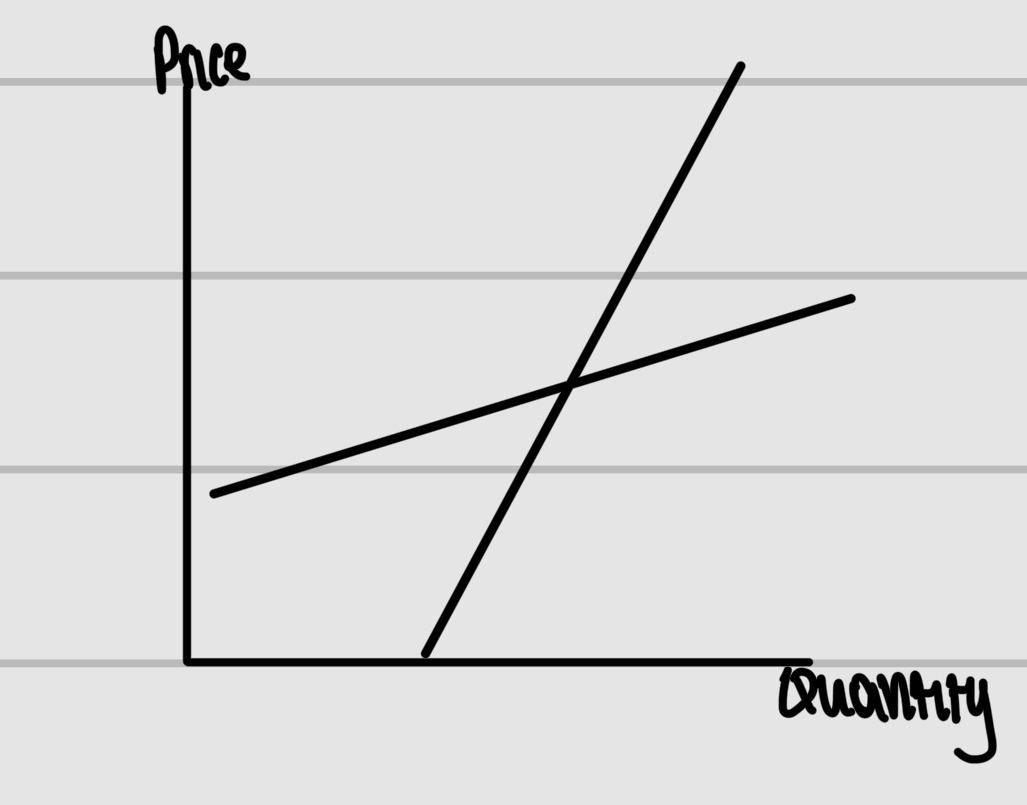
Label the type of elasticity of the supply curves and what their PES would be
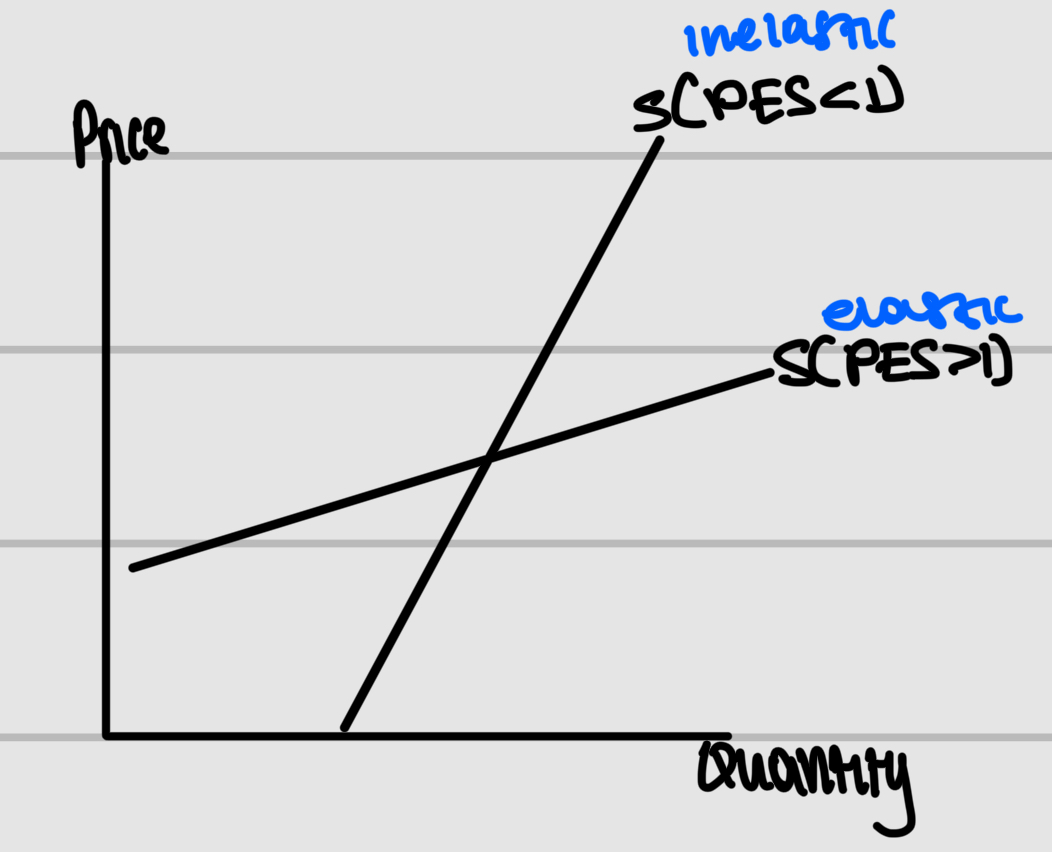
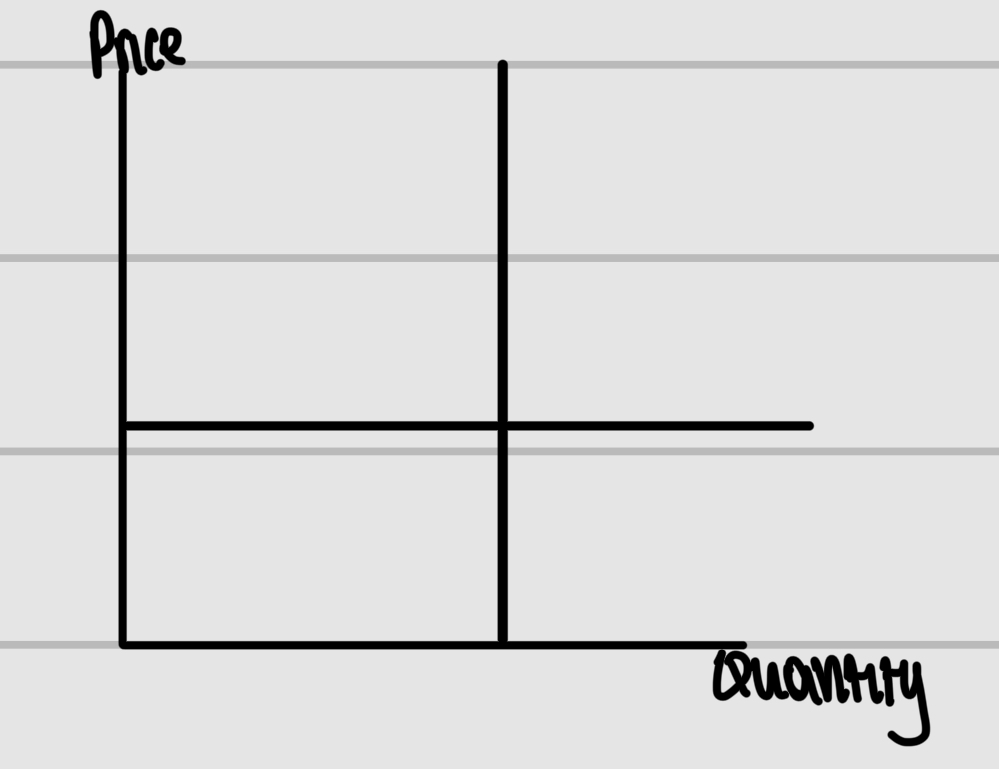
Label the type of elasticity of the supply curves and what their PES would be
Features affecting PES
Production lag
Stocks
Spare capacity
Substitutability of F.O.Ps
Time
Problems with using elasticity when making decisions
Elasticity is only an estimate through surveys, competitors and past data
Elasticity assumes ceteris paribus meaning that other factors are ignored
PED varies along the demand curve
Direct tax
Tax on income that cannot be transferred
Indirect tax
Expenditure tax that increases the costs of production for firms that can be then transferred onto consumers via higher prices
Two types of indirect tax
Specific and AD valorem
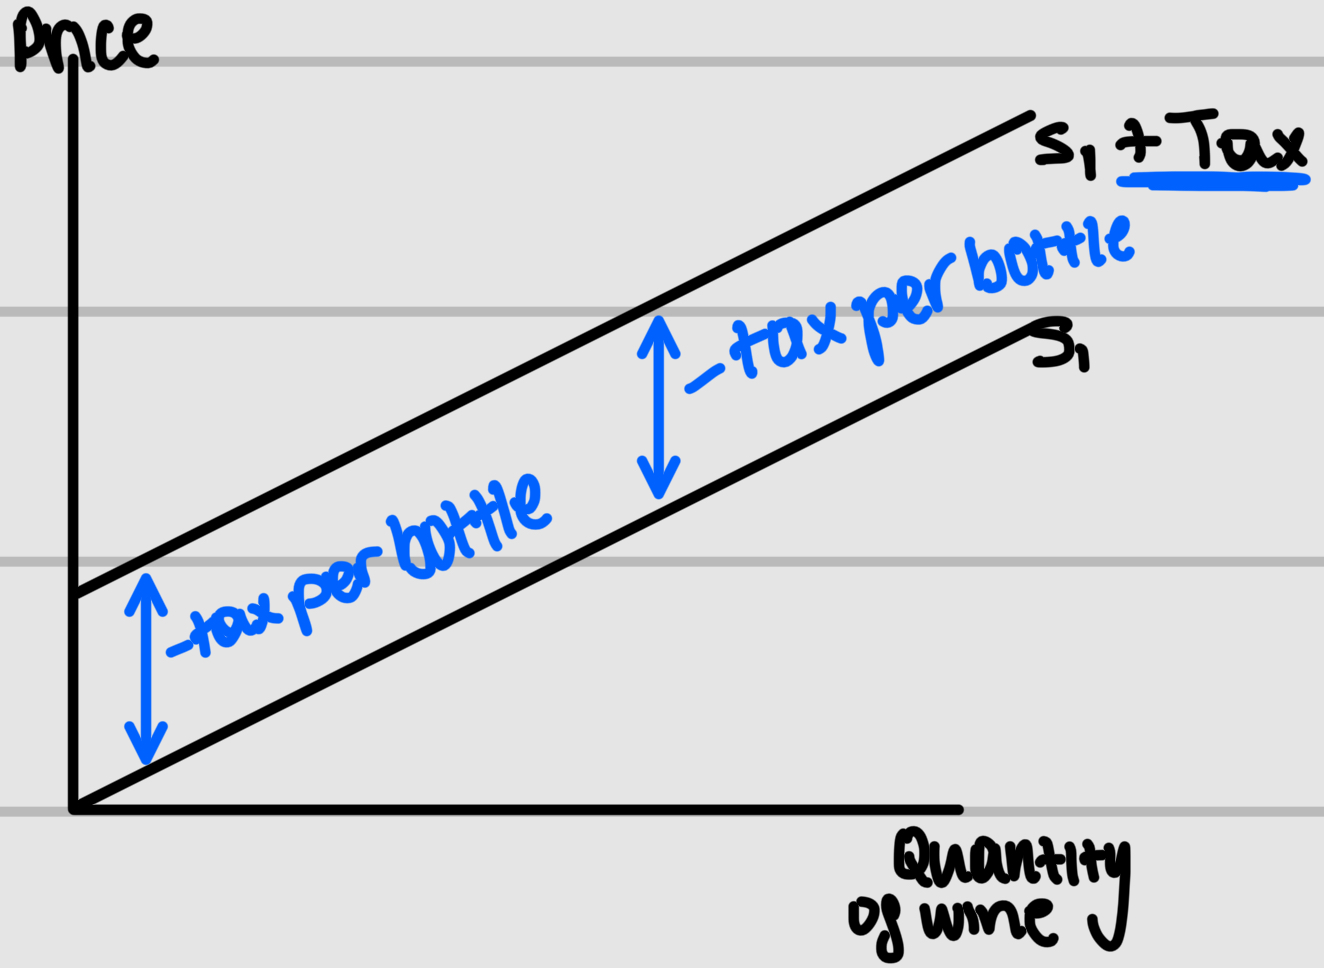
Specific indirect tax
Tax per unit
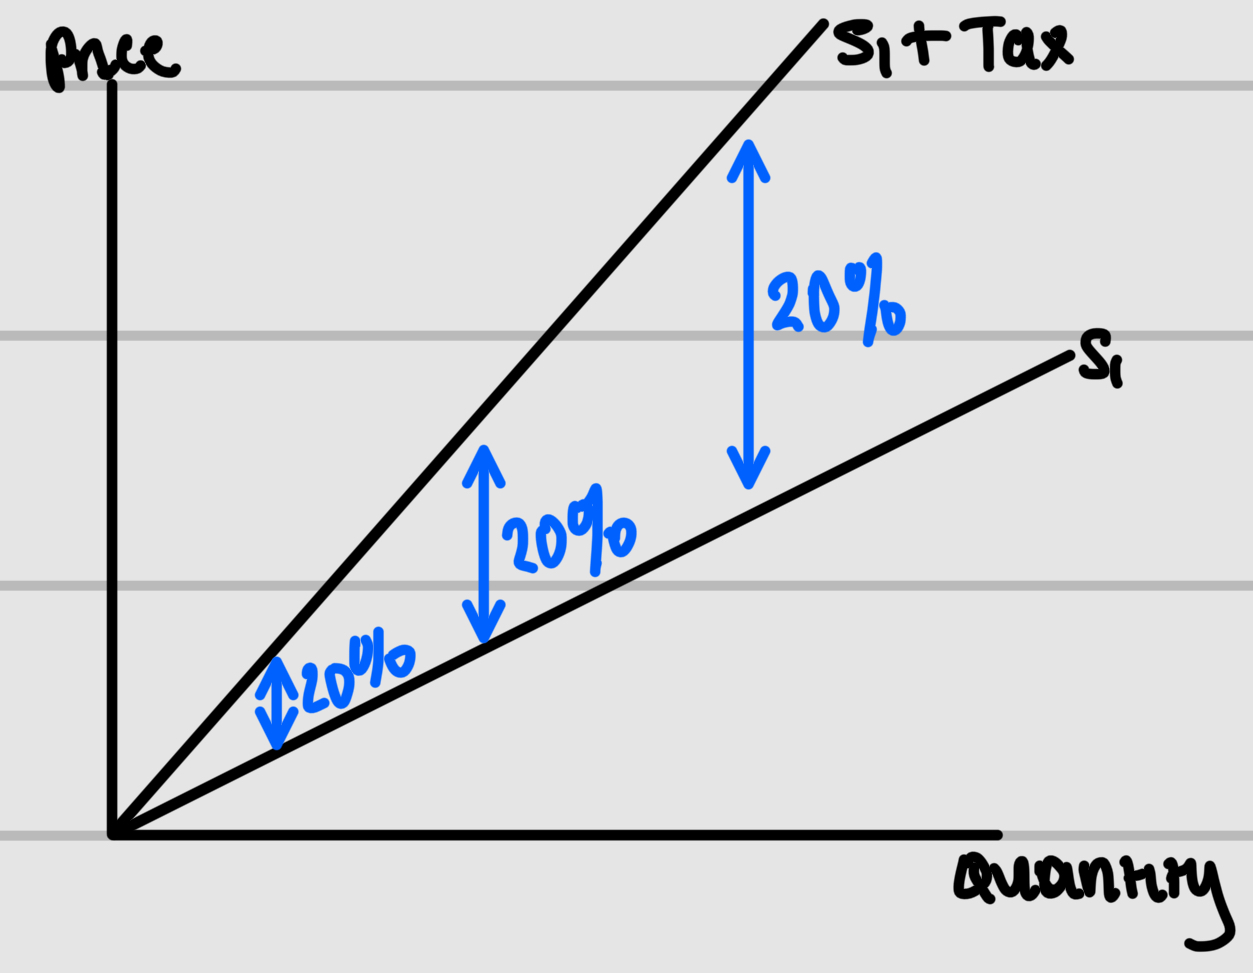
Ad valorem
Tax as a percentage of the price being charged
Identify the type of indirect tax this is and add necessary labels
Specific indirect tax
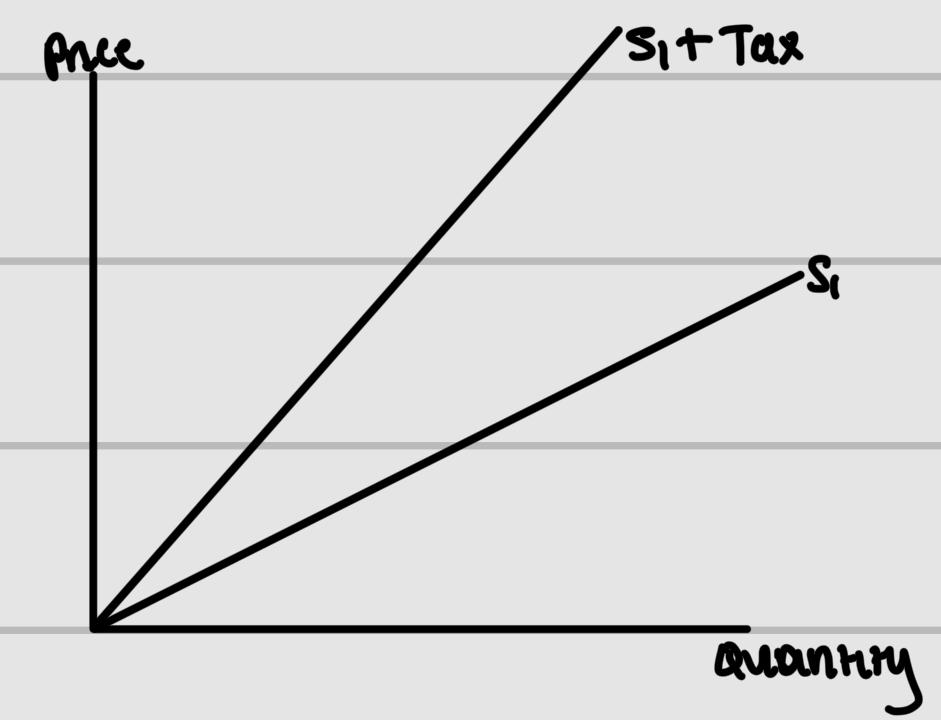
Identify the type of indirect tax this is and add necessary labels
Ad valorem tax
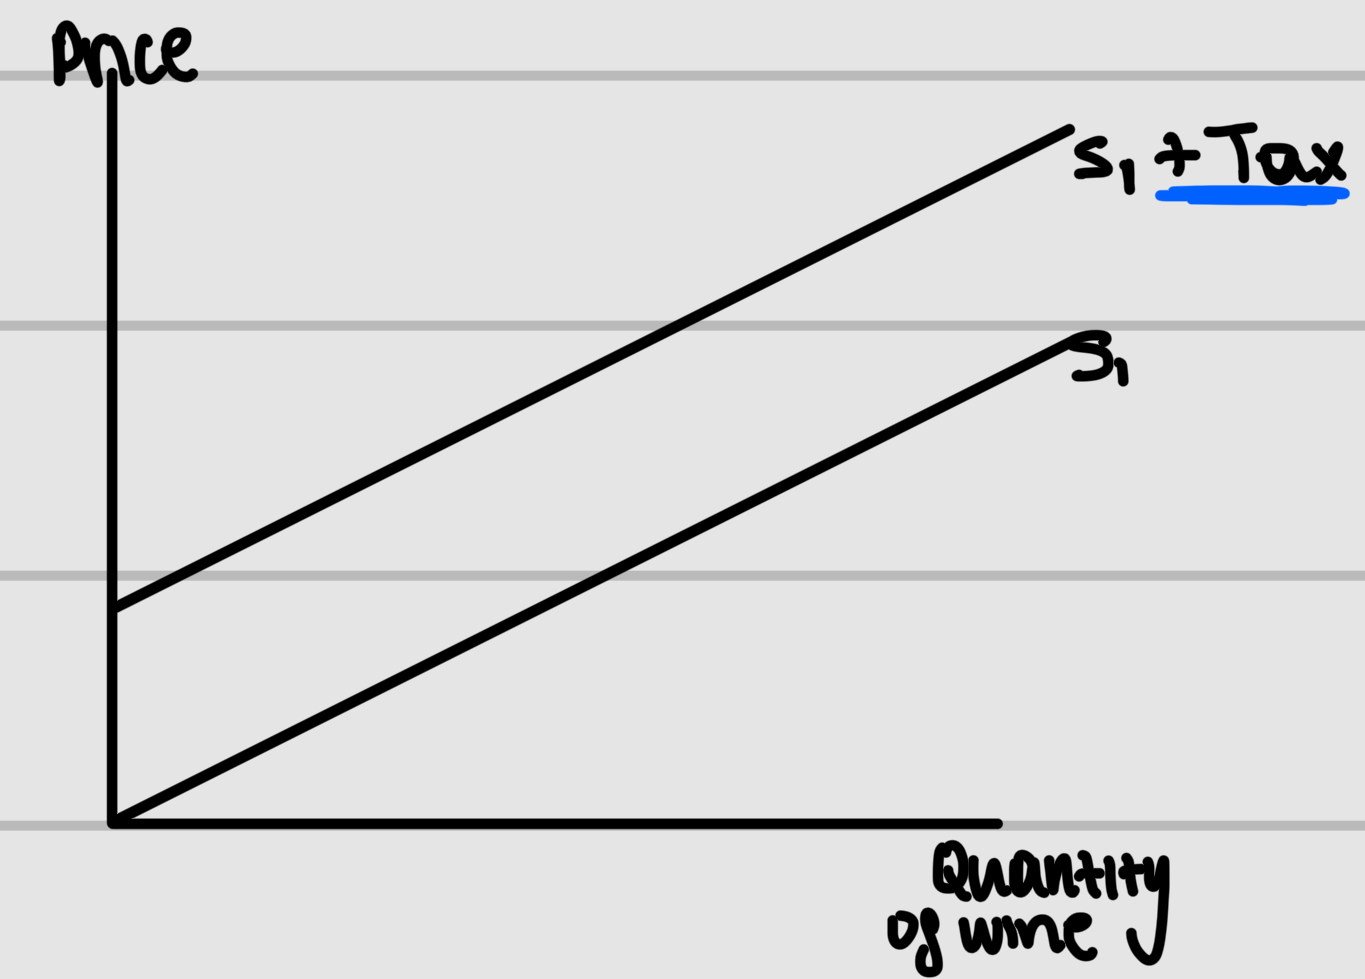
Impact of indirect tax on the supply curve
Shifts upwards
Impact of indirect tax on price and quantity
Price increases and quantity decreases
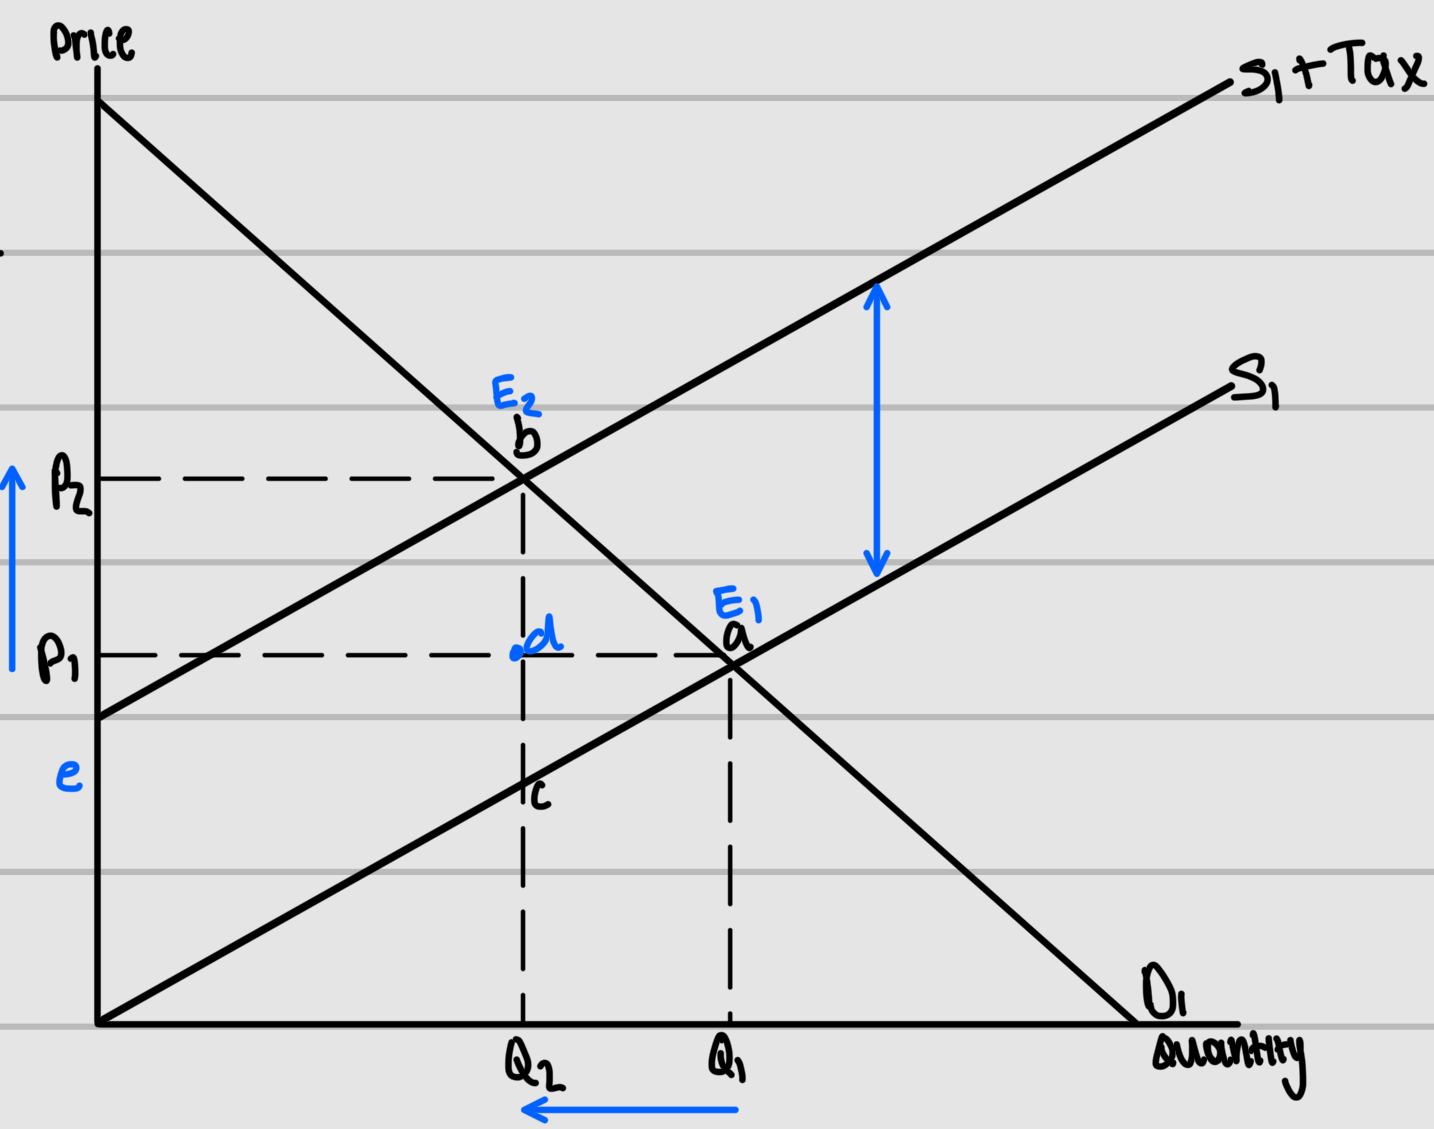
Fully label this graph
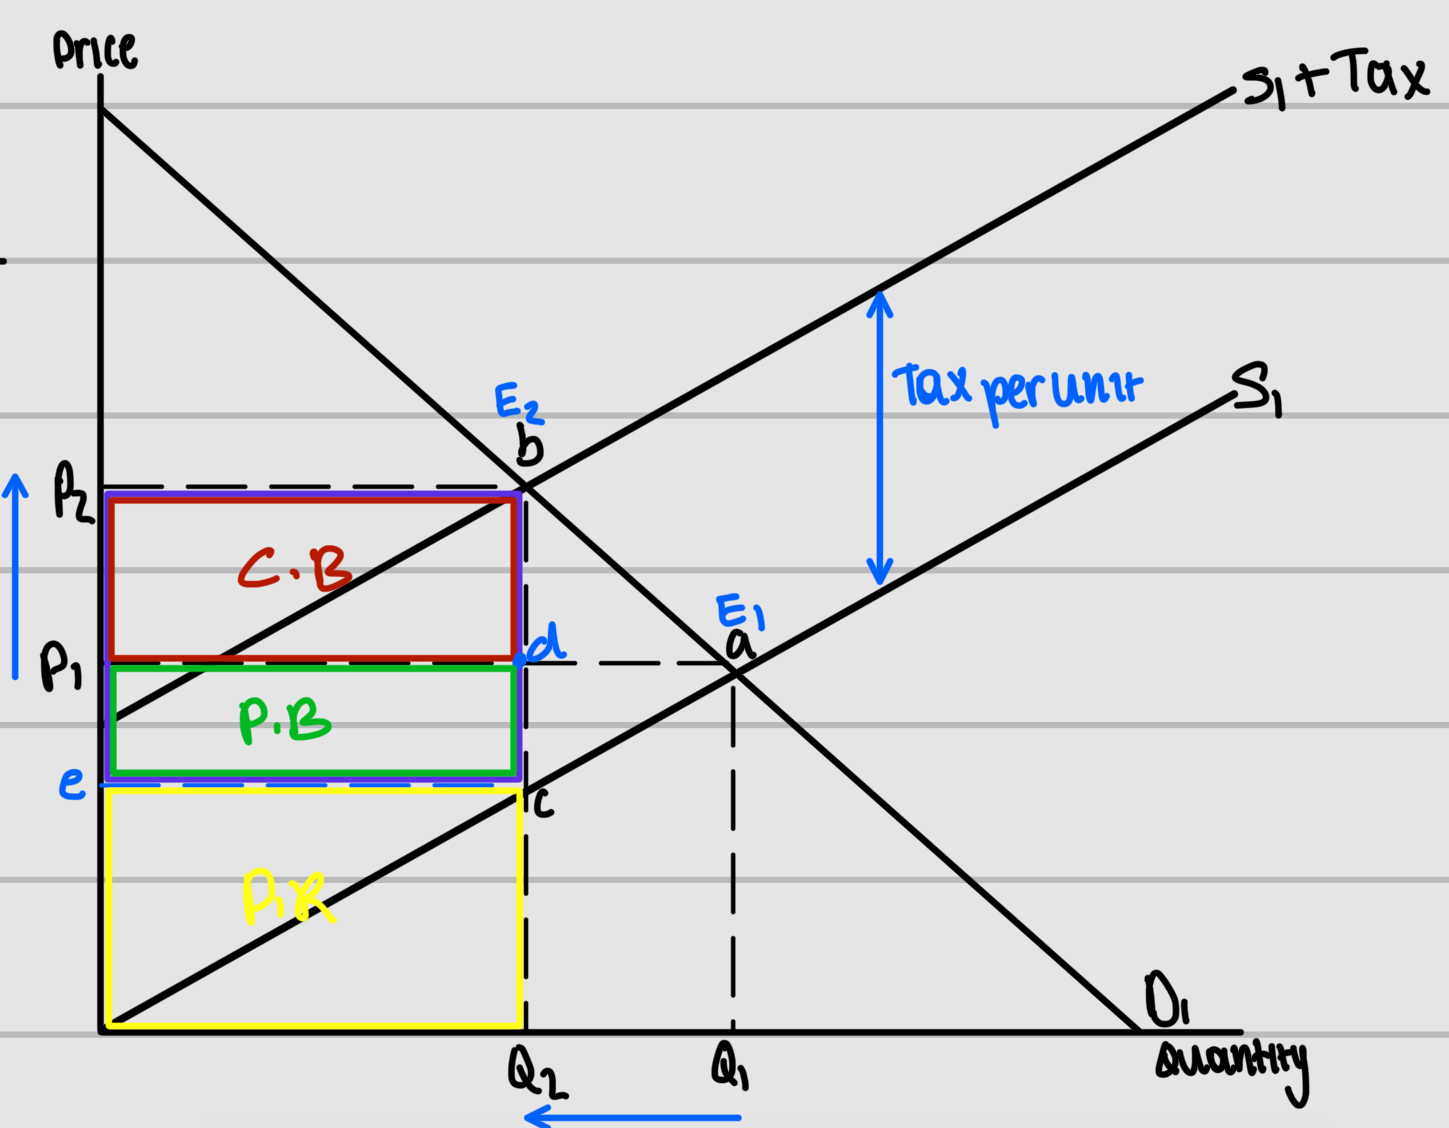
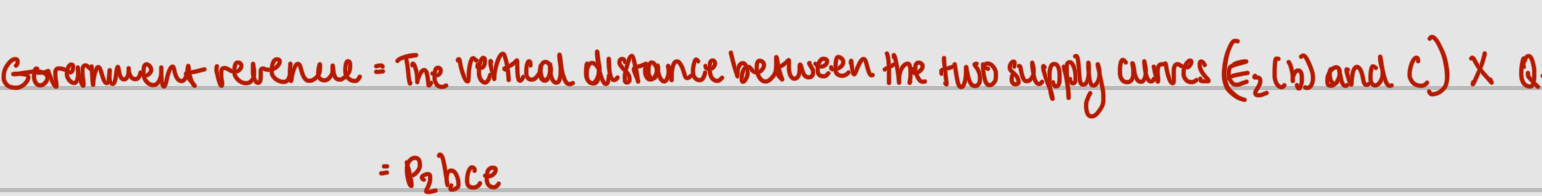
Working out government revenue from supply and demand graph
Consumer burden
The amount of government tax revenue that is received by the government from consumers
Producer burden
The amount of government tax revenue that is received from producers
Calculating producer revenue from supply and demand graph

Consumer burden when producing a price elastic good with tax compared to producing a price inelastic good
Consumer burden is Lower
Producer burden when producing a demand price elastic good with tax compared to producing a demand price inelastic good
Producer burden is higher
Government revenue when producing a demand price elastic good with tax compared to producing a demand price inelastic good
Government revenue is lower
Consumer burden when producing a supply price elastic good with tax compared to producing a supply price inelastic good
Consumer burden is higher
Producer burden when producing a supply price elastic good with tax compared to producing a supply price inelastic good
Producer burden is lower
Subsidy
A money grant to firms given by the government to reduce cost of production and encourage an increase in output