Financial Math - Graph Reading
0.0(0)
Studied by 0 peopleCard Sorting
1/9
There's no tags or description
Looks like no tags are added yet.
Last updated 2:35 PM on 6/3/26
Name | Mastery | Learn | Test | Matching | Spaced | Call with Kai |
|---|
No analytics yet
Send a link to your students to track their progress
10 Terms
1
New cards
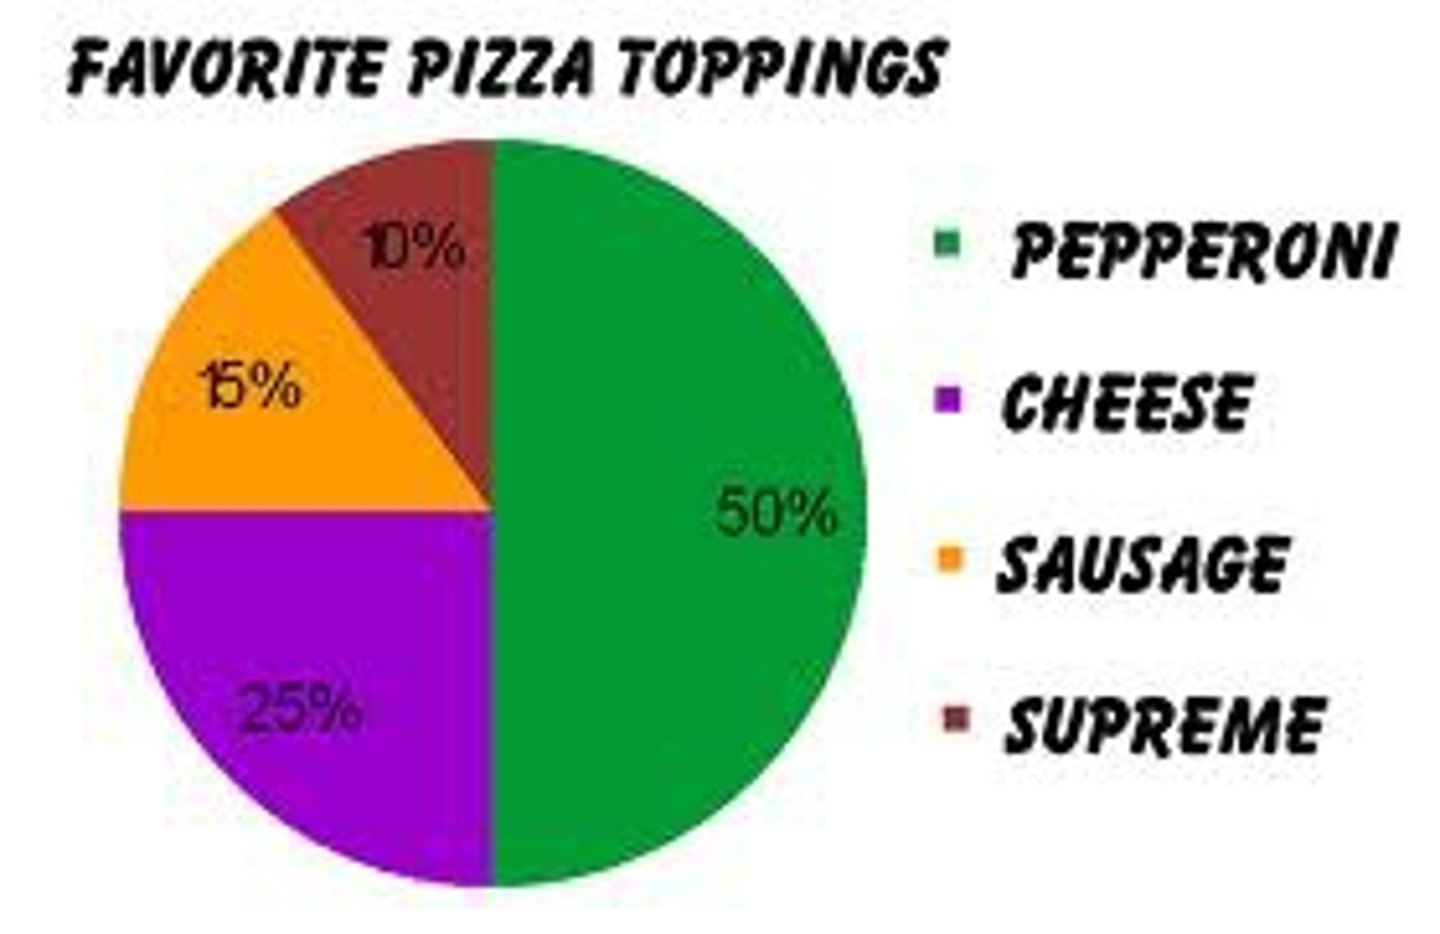
Pie graph
a graph that shows circles that are "sliced" apart to represent percentages of the total "pie" for particular groups or categories
2
New cards
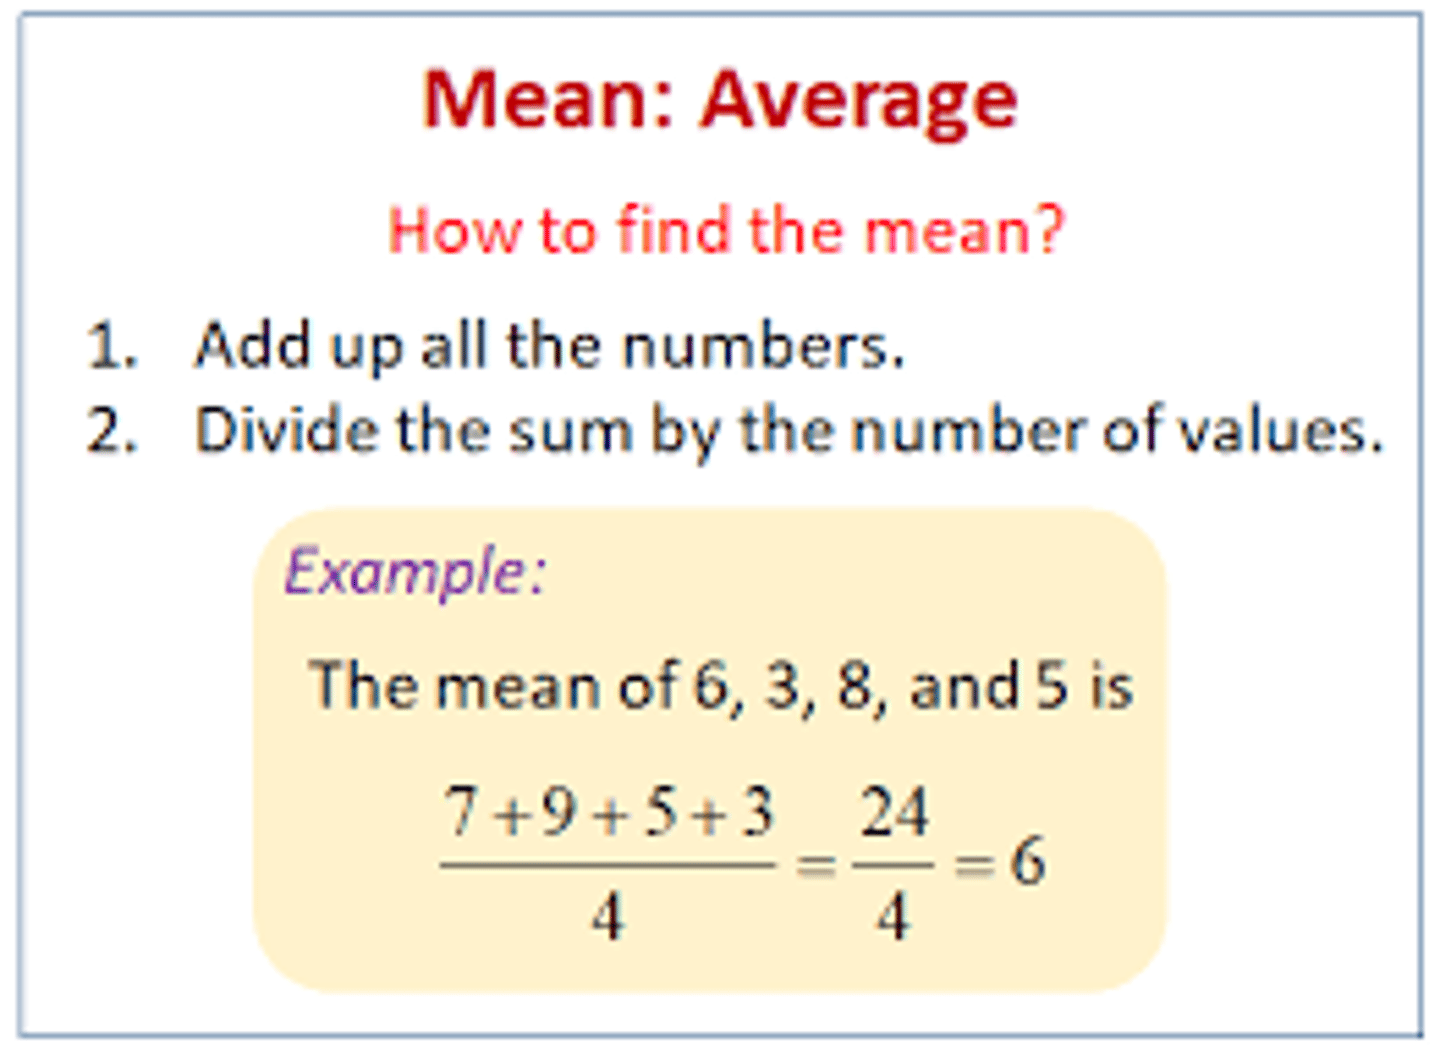
Mean
average
3
New cards
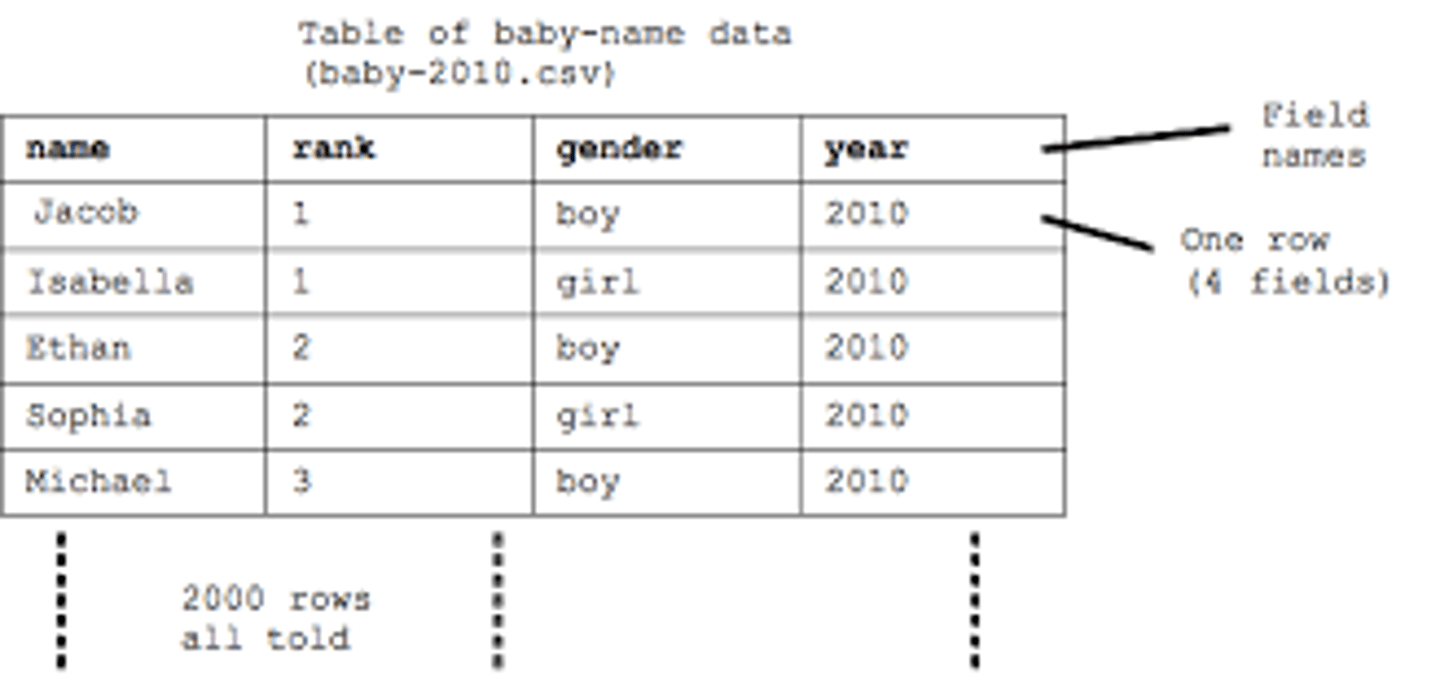
Table
An arrangement of data made up of horizontal rows and vertical columns.
4
New cards
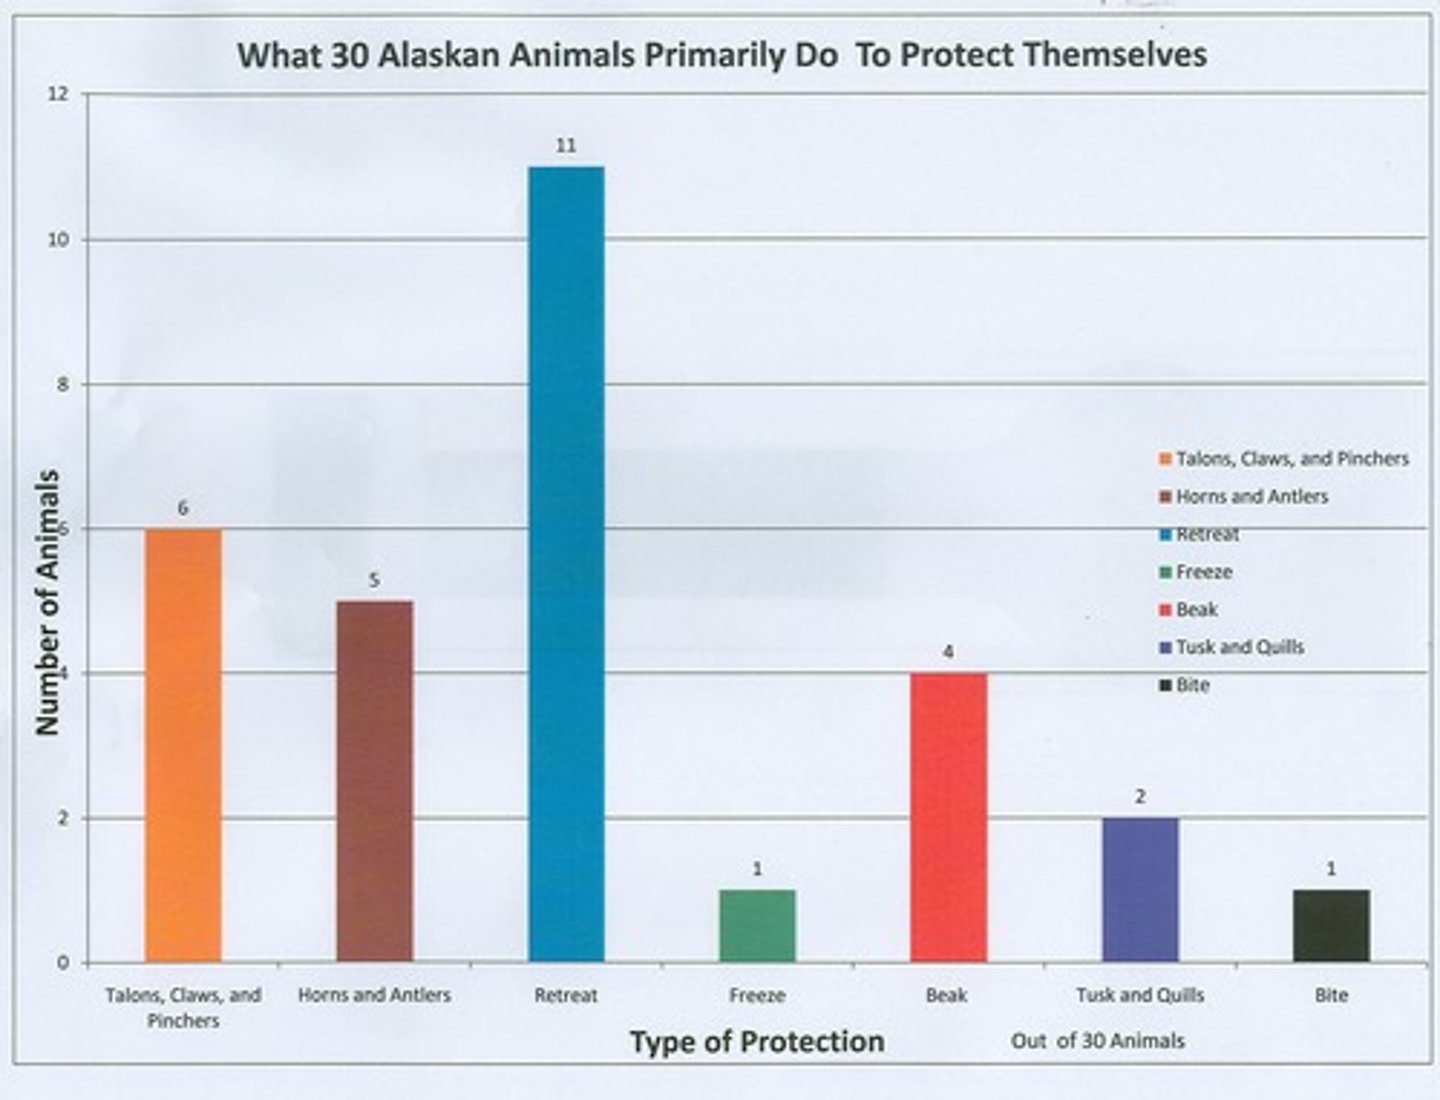
Bar graph
A graph that uses horizontal or vertical bars to display data
5
New cards
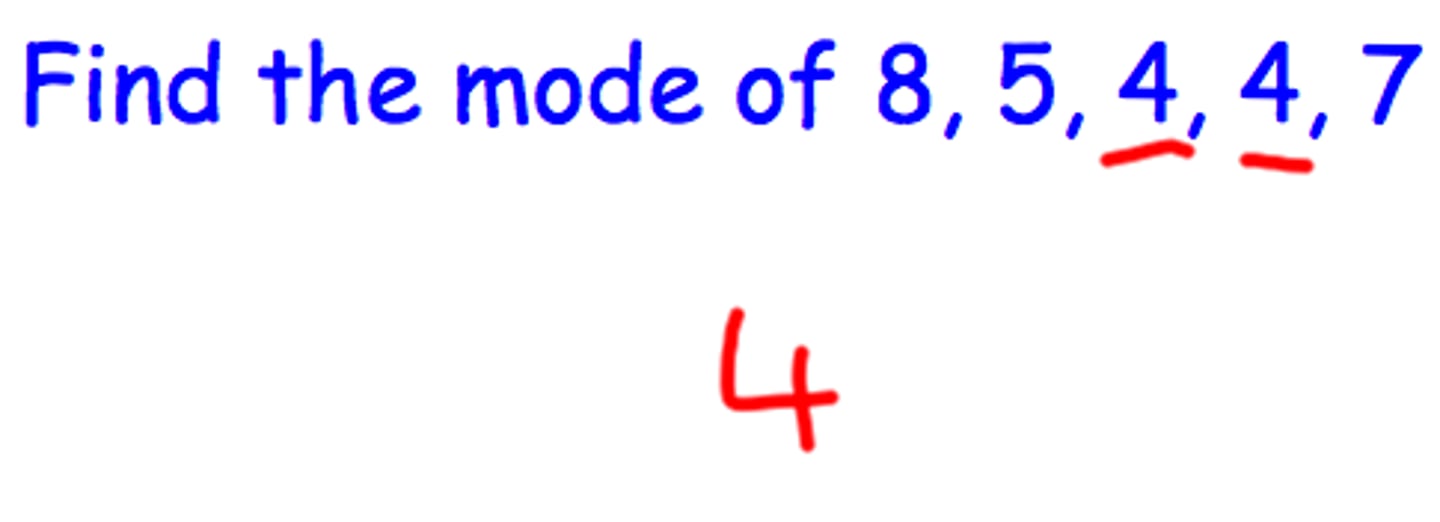
Mode
The value that occurs most frequently in a given data set.
6
New cards
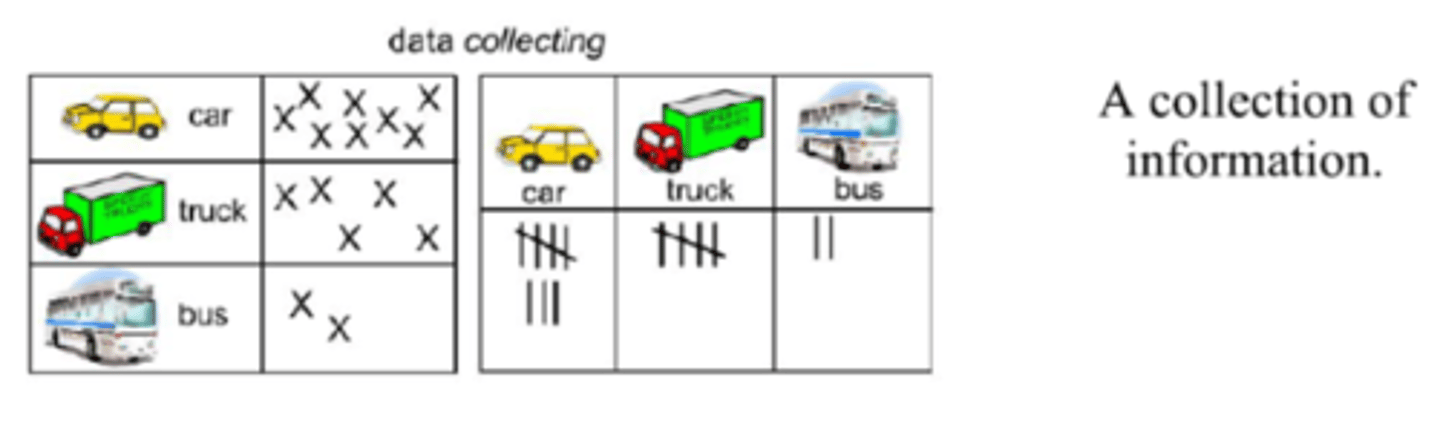
Data
Facts and statistics collected together for reference or analysis
7
New cards
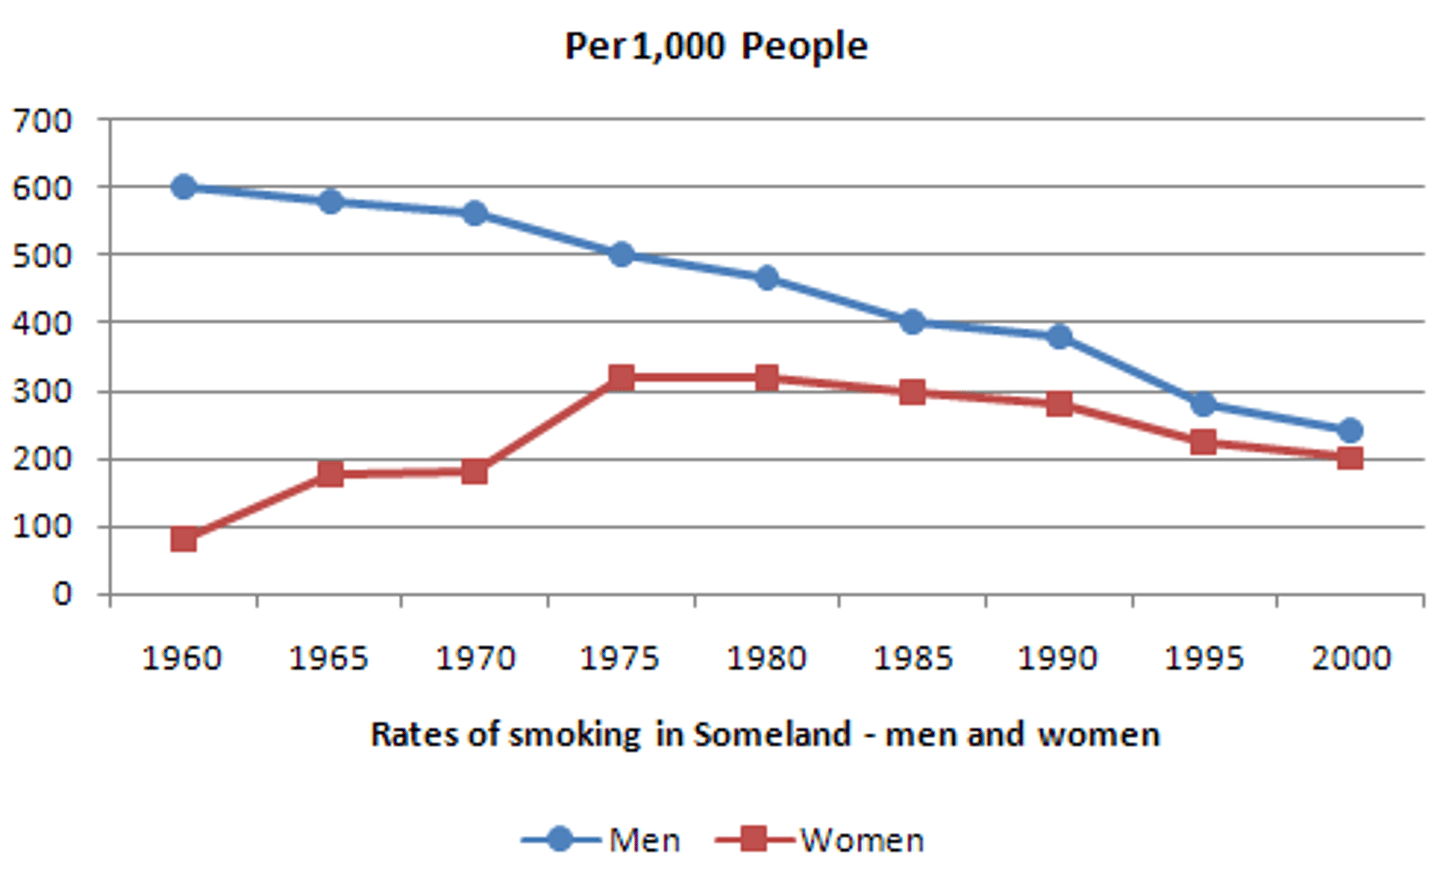
Line graph
a graph that uses one or more lines to show changes in statistics over time or space
8
New cards
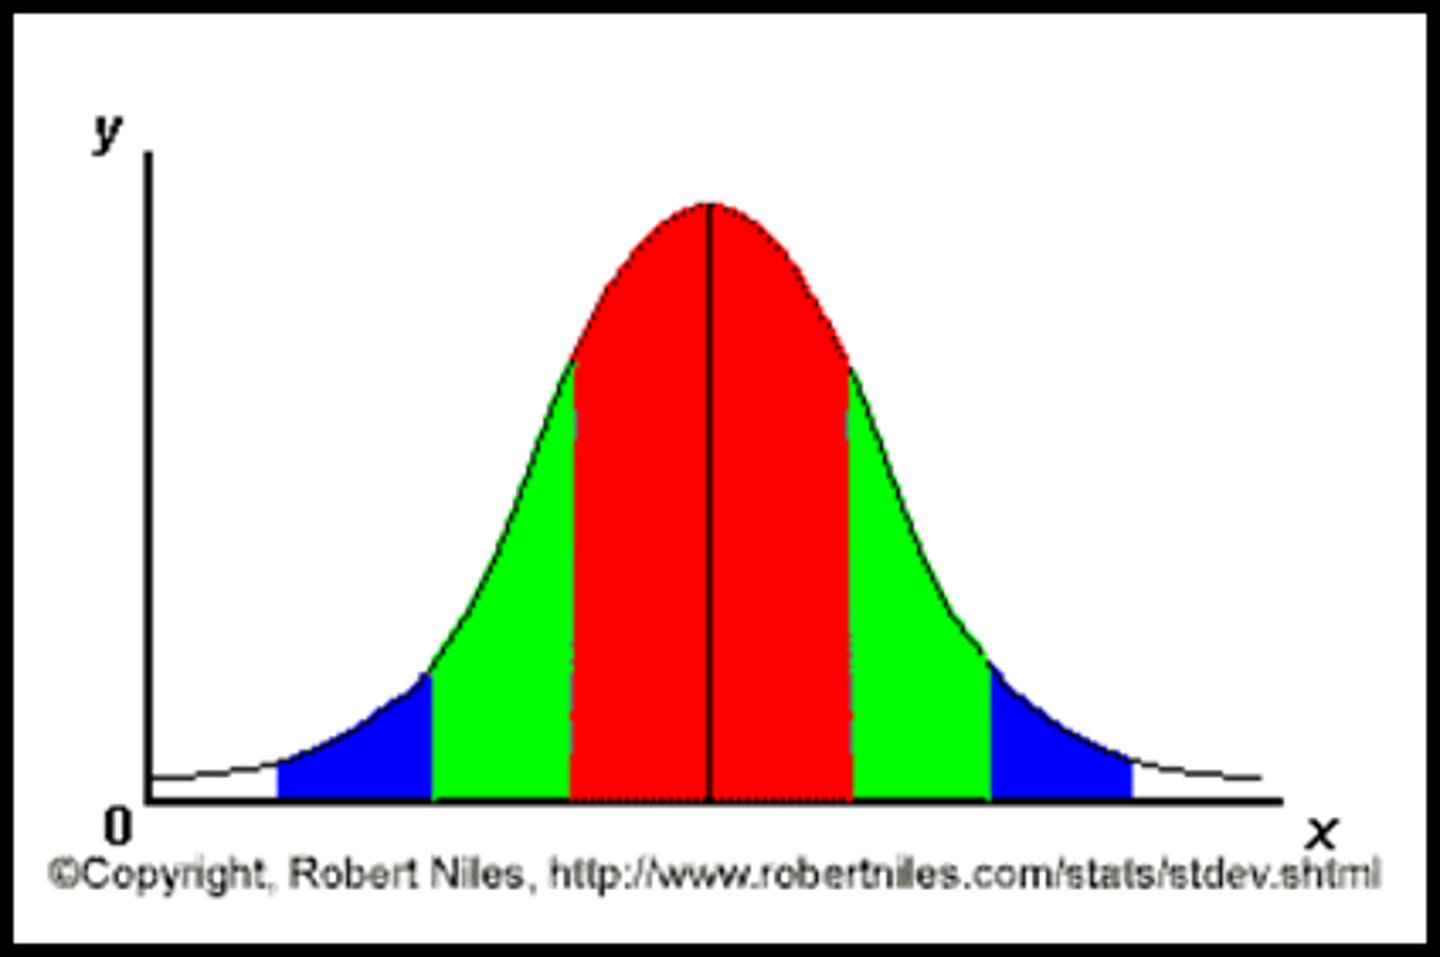
data distribution
How data values are arranged.
9
New cards
Average
mean
10
New cards
relative data
Compare data to each other