The Capitalist Revolution
1/3
Earn XP
Description and Tags
1.1: Income Inequality of The Economy & from the Economy #1
Name | Mastery | Learn | Test | Matching | Spaced | Call with Kai |
|---|
No analytics yet
Send a link to your students to track their progress
4 Terms
Economically Speaking, what did the world look like 1000 years ago?
-Flat basically. Not a whole lot of differences in Income between regions of the world when compared to today. This is due to everyone across the globe being equally poor, living off subsistence means
-However, measures of Inequality within nations and communities still existed due to Feudalism. That could lead to brutal levels of inequality
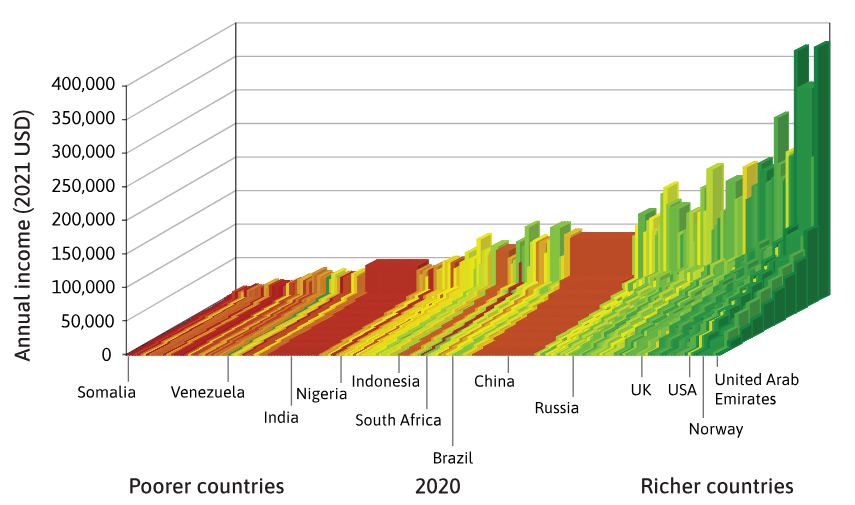
Very briefly, draw and describe what the World Income Distribution roughly looks like. How does it relate to Ibn Battuta?
-The rich have much more than the poor in every nation
-The gap between some nations is astonishing - Average Income in Norway is 7x that of Average Income in Nigeria. This would go against what Ibn Battuta’s Journey found - where inequality between nations was relatively low during the 14th Century.
What is the Rich/Poor Ratio? Use Norway, America and Botswana as an example
-A Measure of Income Inequality that measures the Richest Group in a Population to the Poorest Group.
-For example, comparing the richest 10% to the poorest 10% [10:10] leads to measures for these nations as such:
Norway: 66
USA: 244
Botswana: 489
What are the advantages and limitations of using a Rich/Poor Ratio?
🙂 Simple and Easy to Understand and Calculate - making it accessible
🙂 Easy to compare across Nations and over Time
🙂 Gives a quick snapshot of the Extremes of Inequality
😩 Fails to capture what is occurring in the middle of the distribution. 2 Nations can have the same ratio, but have widely different distributions
☹ Depending on which percentile is cut off, the stories shown can be very different, meaning you can be misled
☹ No account of the cost of living differences between nations, which would impact standards of living. Also no indication of why inequality actually exists in the first place
☹ Can get skewed by extreme outliers - on both sides