HS300 Exam 3
1/40
There's no tags or description
Looks like no tags are added yet.
Name | Mastery | Learn | Test | Matching | Spaced | Call with Kai |
|---|
No analytics yet
Send a link to your students to track their progress
41 Terms
Prevention
If prevention is not possible, then the next best strategy is early detection of disease in pre-symptomatic stage
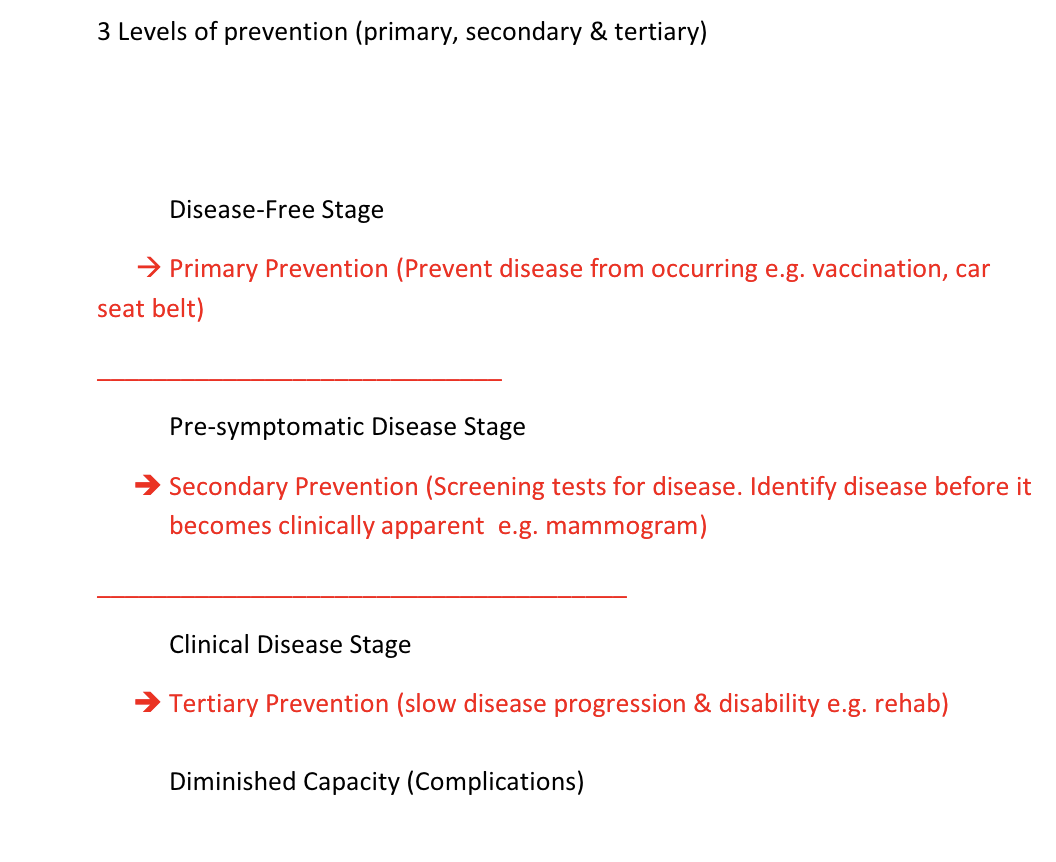
➢Primary – to remove or avoid a risk
factor before disease develops
(vaccination)
➢Secondary - detect a disease when it
is pre-symptomatic (screening test –
mammogram, cholesterol, infant screenings(multiphasic, lead, PKU), vision and hearing) for morbidity and morality
➢Tertiary – interventions to minimize
disability (rehab)
Screening tests are not diagnostic
Example Diabetes
• Fasting blood glucose or screening test
• Hemoglobin A1C- (normal <5.7%) or
Glucose tolerance test- diagnostic
test
A good screening tests is….
!!Simple, rapid, inexpensive, safe, and acceptable
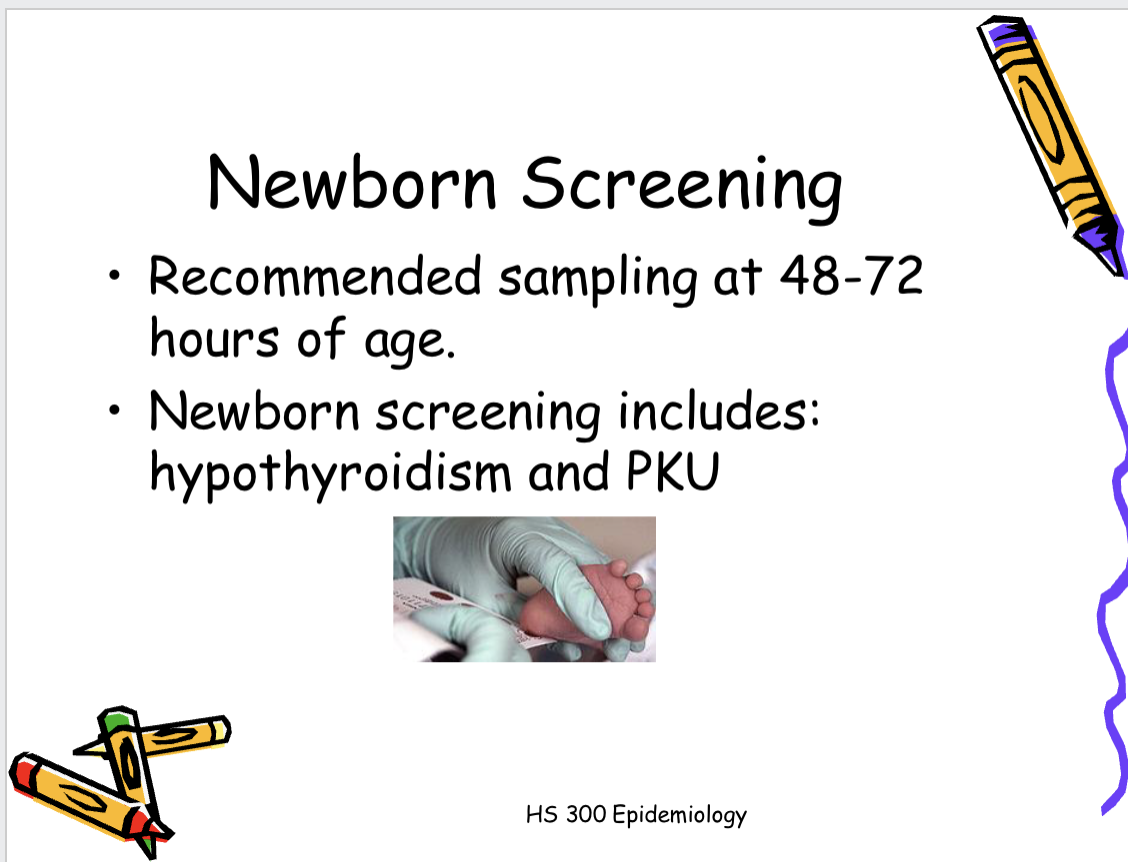
Mass screening - Population screening: the
screening on a large scale of total population
groups e.g. all newborns screened for hypothyroidism and PKU, childhood screening for scoliosis, anticipated a low yield, cheap and non-invasive test
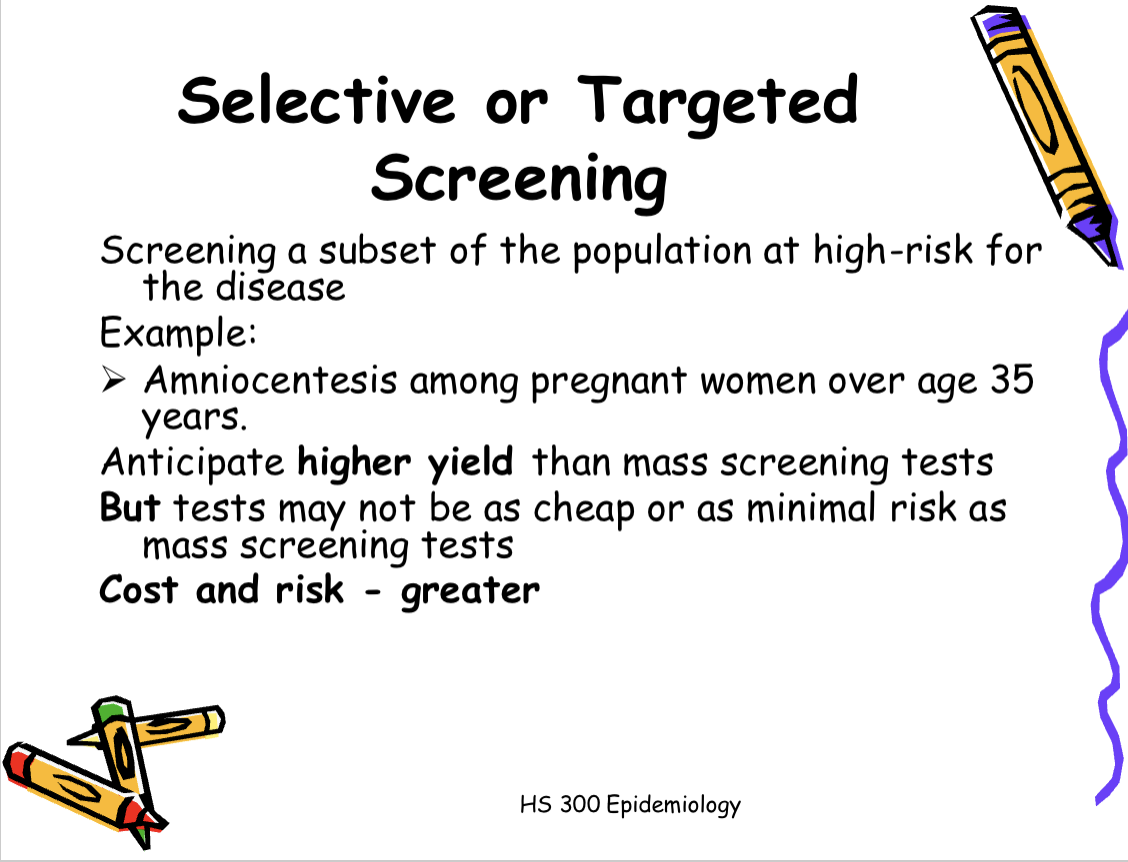
• Selective or targeted screening: screening a
subset of the population at high-risk for the
disease, e.g. Tay-Sachs disease in Jewish
populations of eastern European extraction.
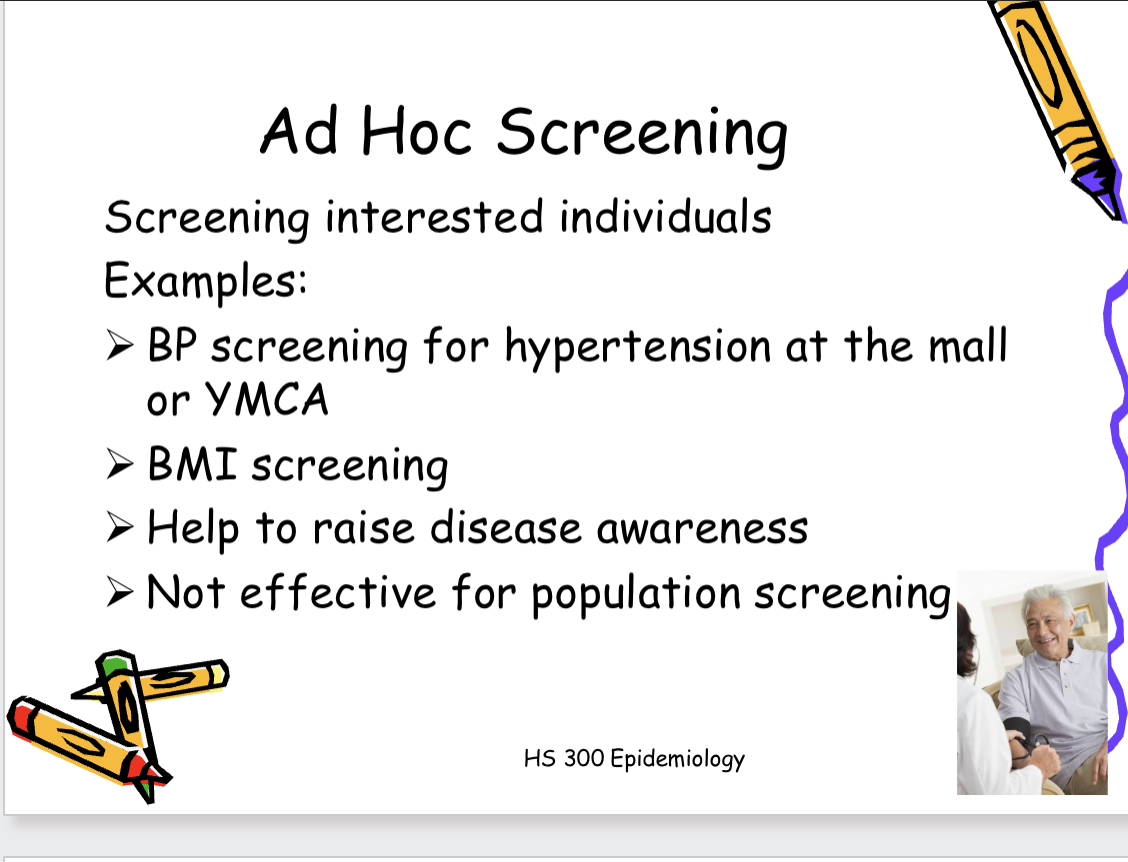
• Ad hoc screening: screening interested
individuals, e.g. BP screening for hypertension at
the mall or YMCA
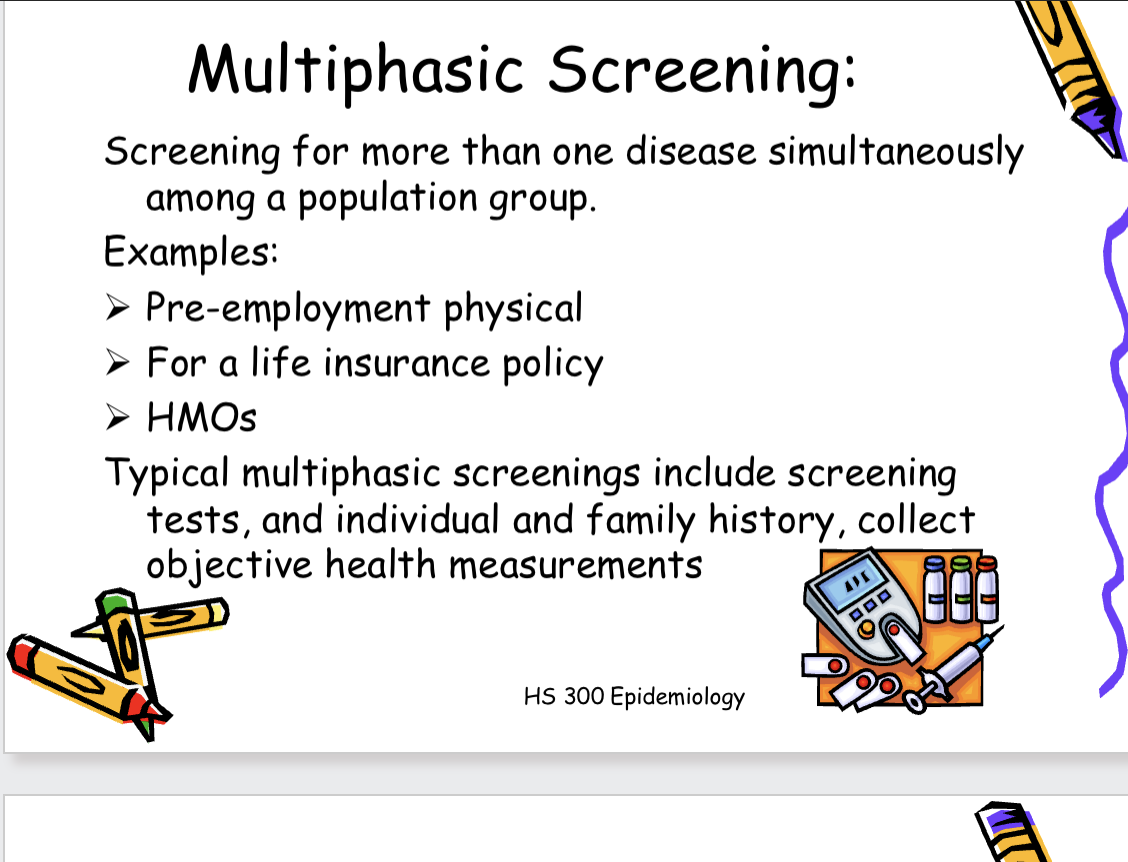
• Multiphasic screening: screening for more than
one disease simultaneously
!!Wilson and Jungner’s Screening Criteria
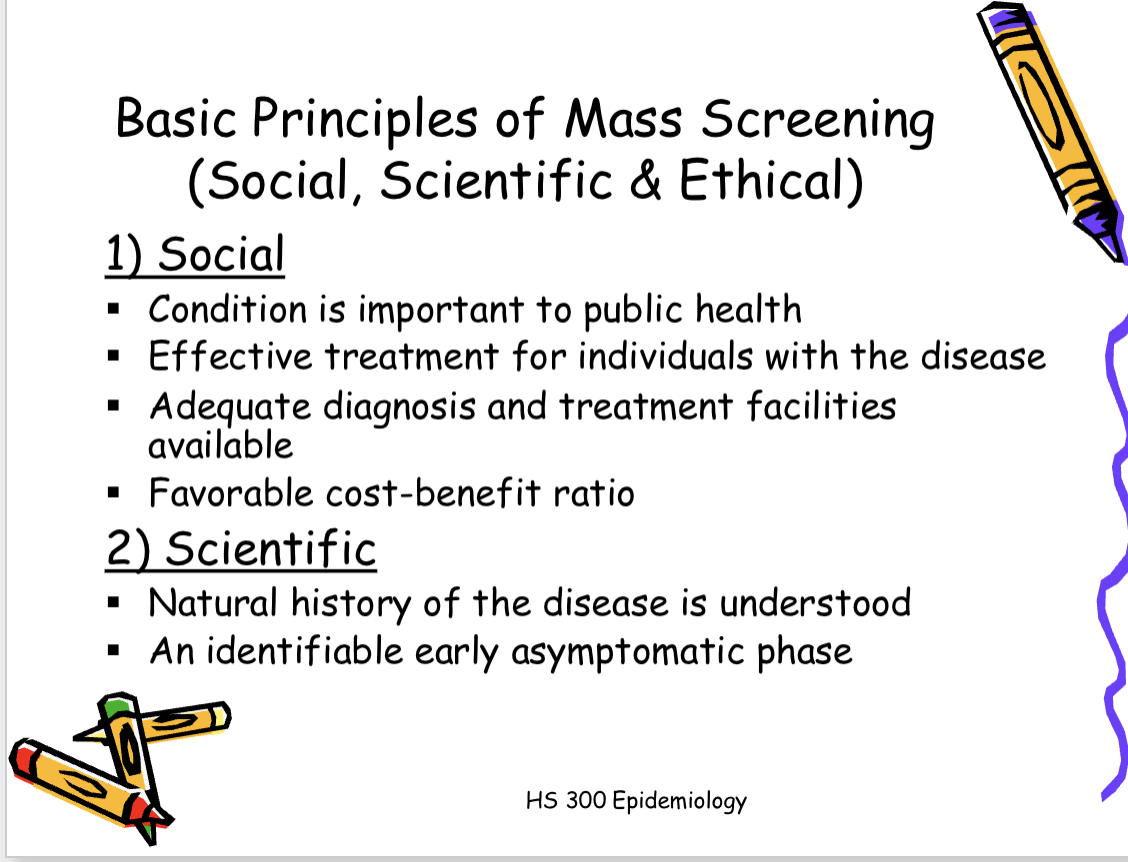
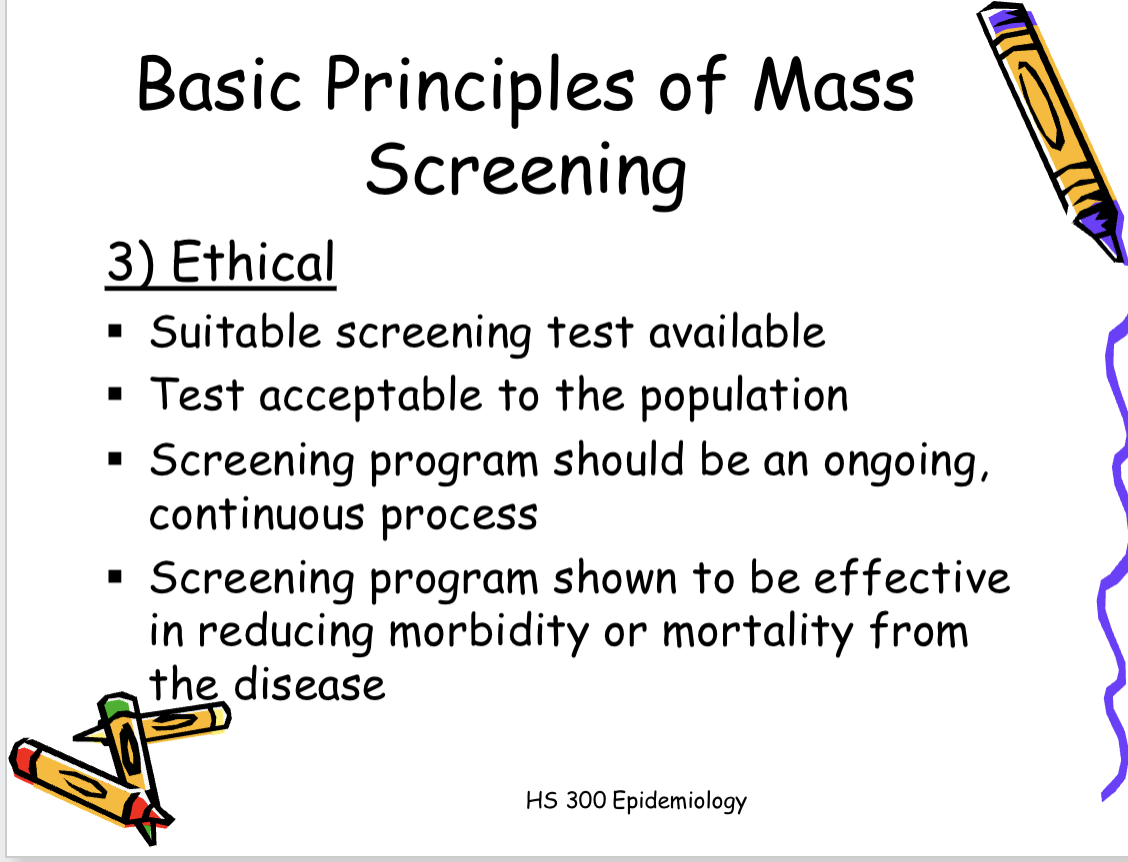
1) The condition being screened for should be an important
health problem.
2) The natural history of the condition should be well
understood.
3) There should be a detectable early stage.
4) Treatment at an early stage should be of more benefit
than at a later stage.
5) A suitable test should be devised for the early stage.
6) The test should be acceptable to patient.
7) Adequate health service provision for the extra clinical
workload.
8) The costs should be balanced against the benefits
Recap: types of screening - Mass, Targeted, Ad hoc, and all of these can be a single test or multiphasic
Evaluation of screening tests
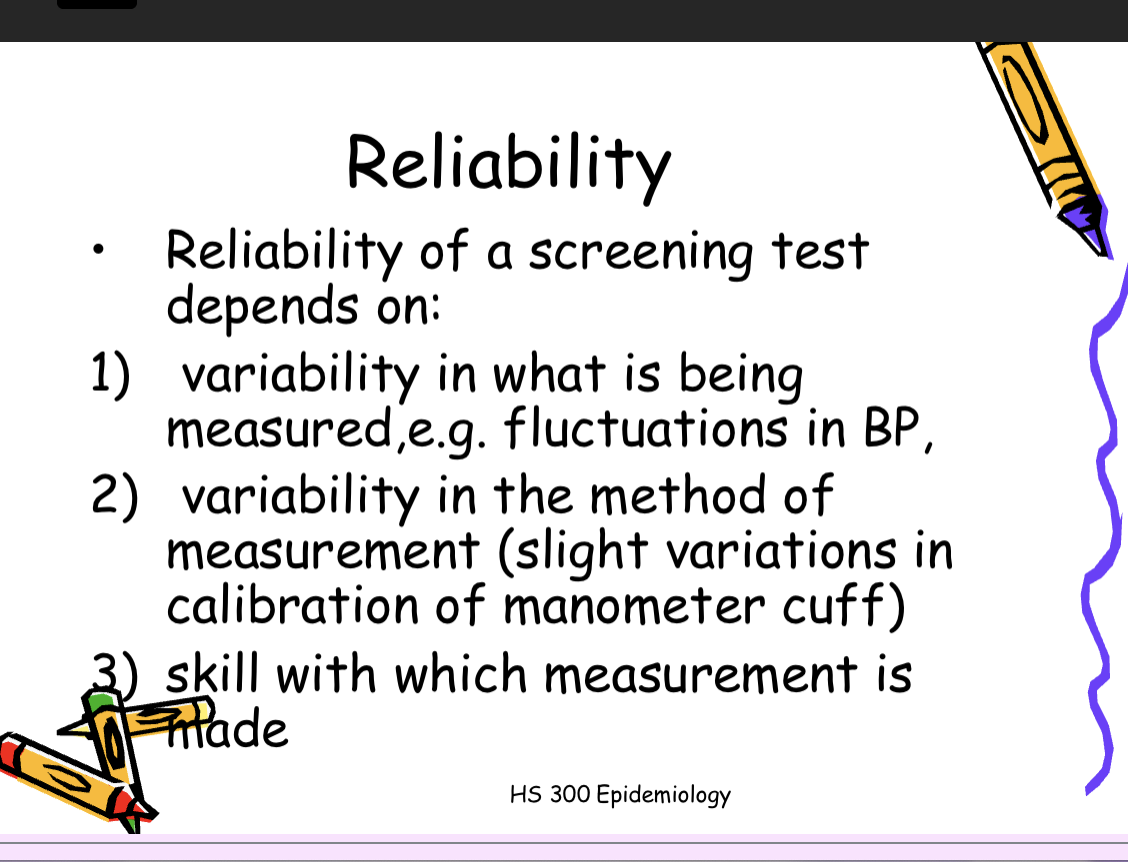
Reliability: ability of the test to give consistent results on repeated trials (whether correct or not)
depends on variability in what is being measured ex: fluctuations in BP and variability in the method of measurement (slight variations in calibration of manometer cuff) and skill in which measurement is made
Validity (accuracy): ability of a measuring instrument to give true measures
only be evaluated if an accepted and independent method of confirming the test measurement (gold standard) exists
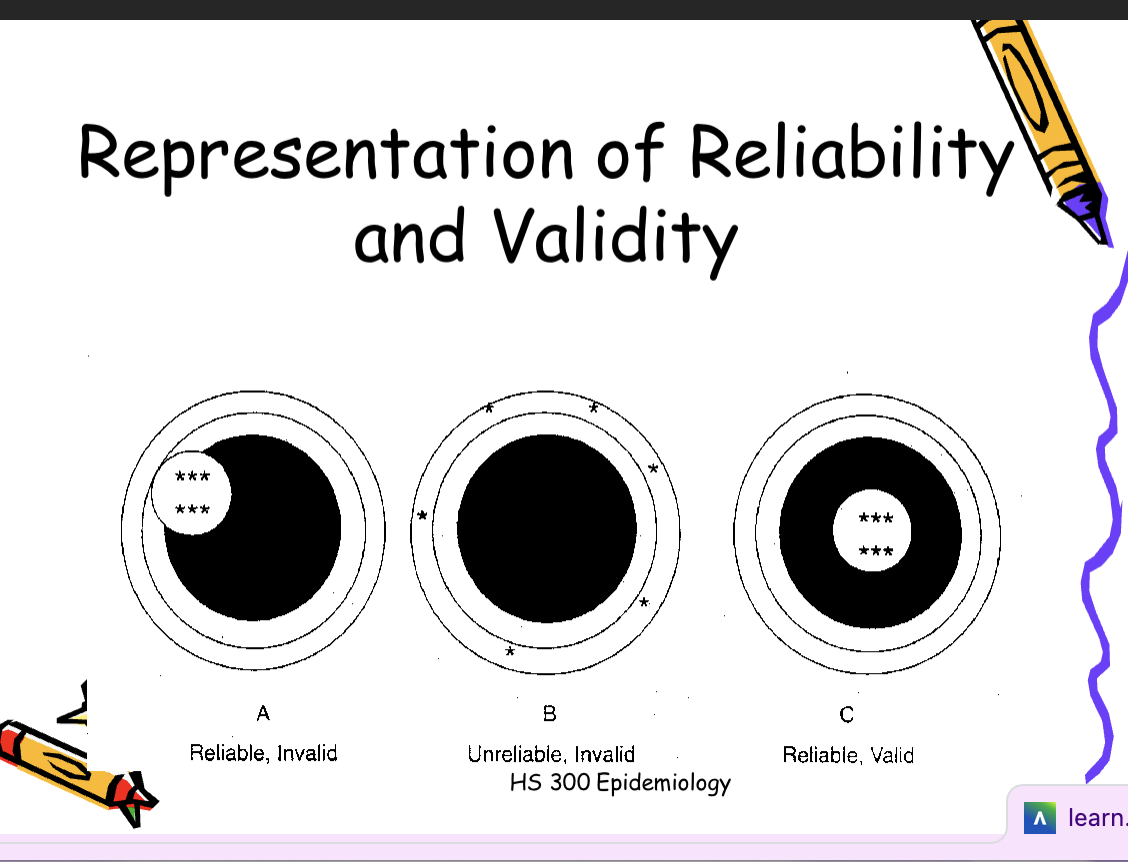
Interrelationship between reliability and validity
it is possible for a measure to be: reliable, but invalid, unreliable and invalid, reliable and valid, !!!it is NOT possible for a measure to be valid but unreliable
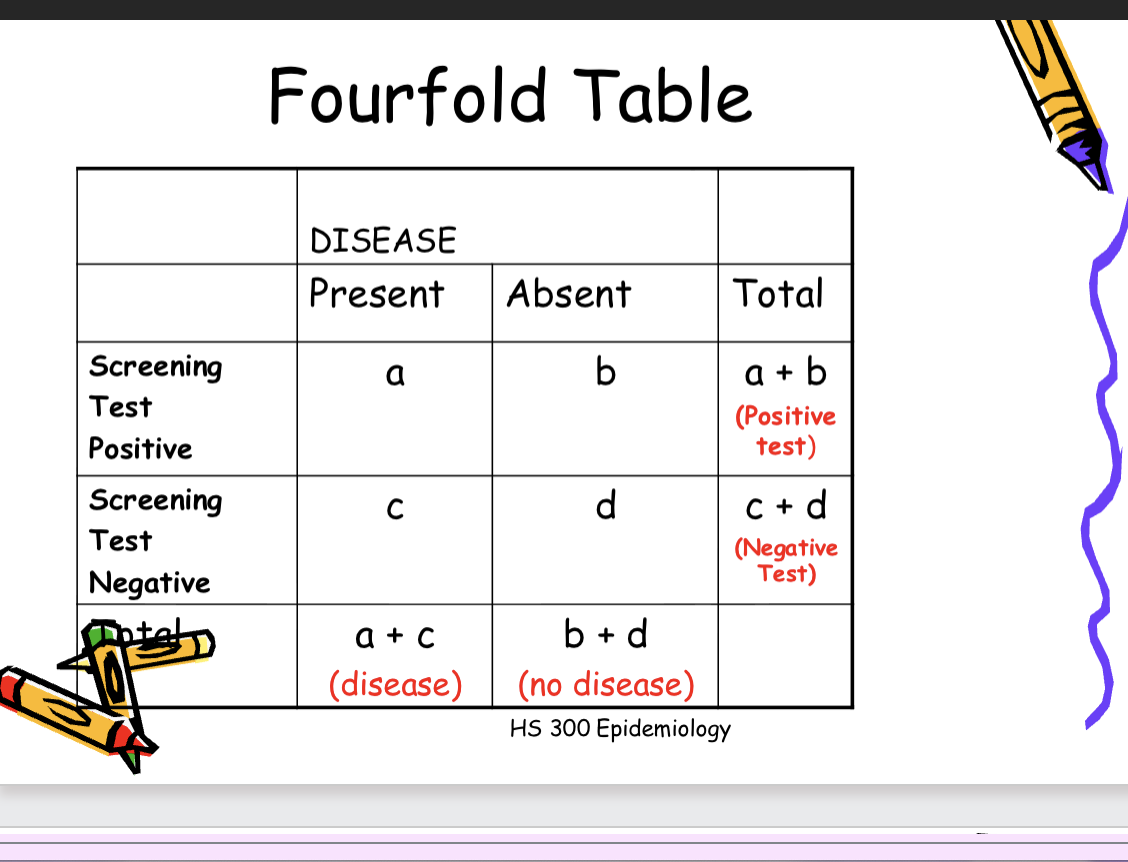
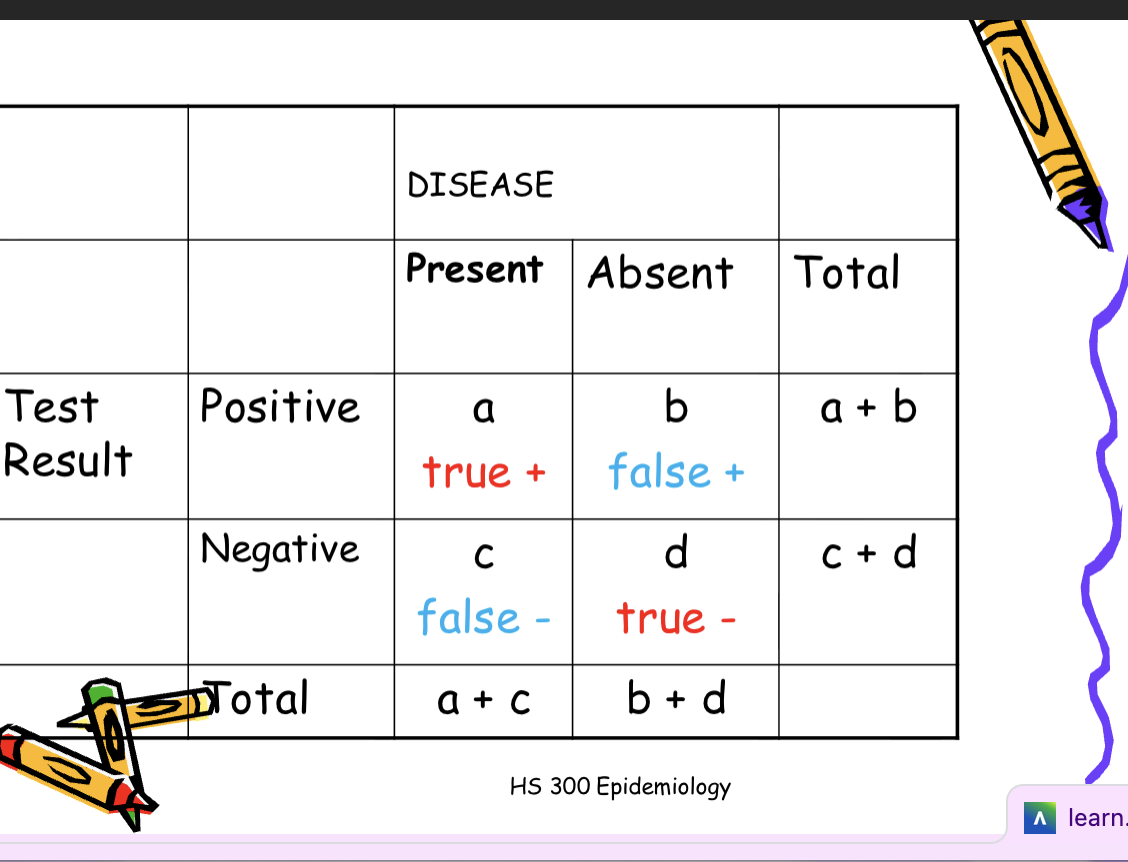
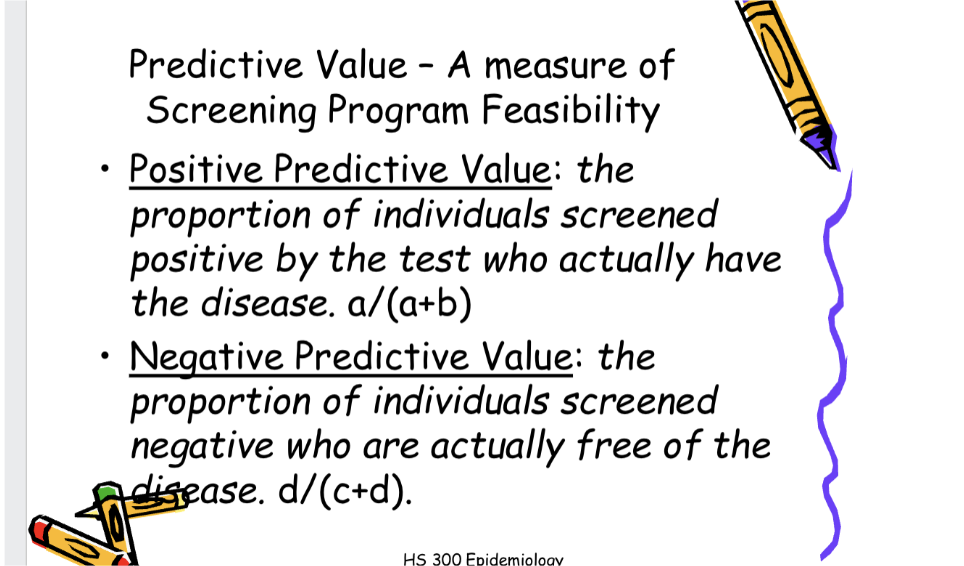
Measures of validity of screening tests
Sensitivity: the extent to which a
test identifies as positive all
individuals who have a given disease.
a/(a+c)
Specificity: the extent to which a
test identifies as negative all
individuals who are free of a given
disease. d/(b+d)
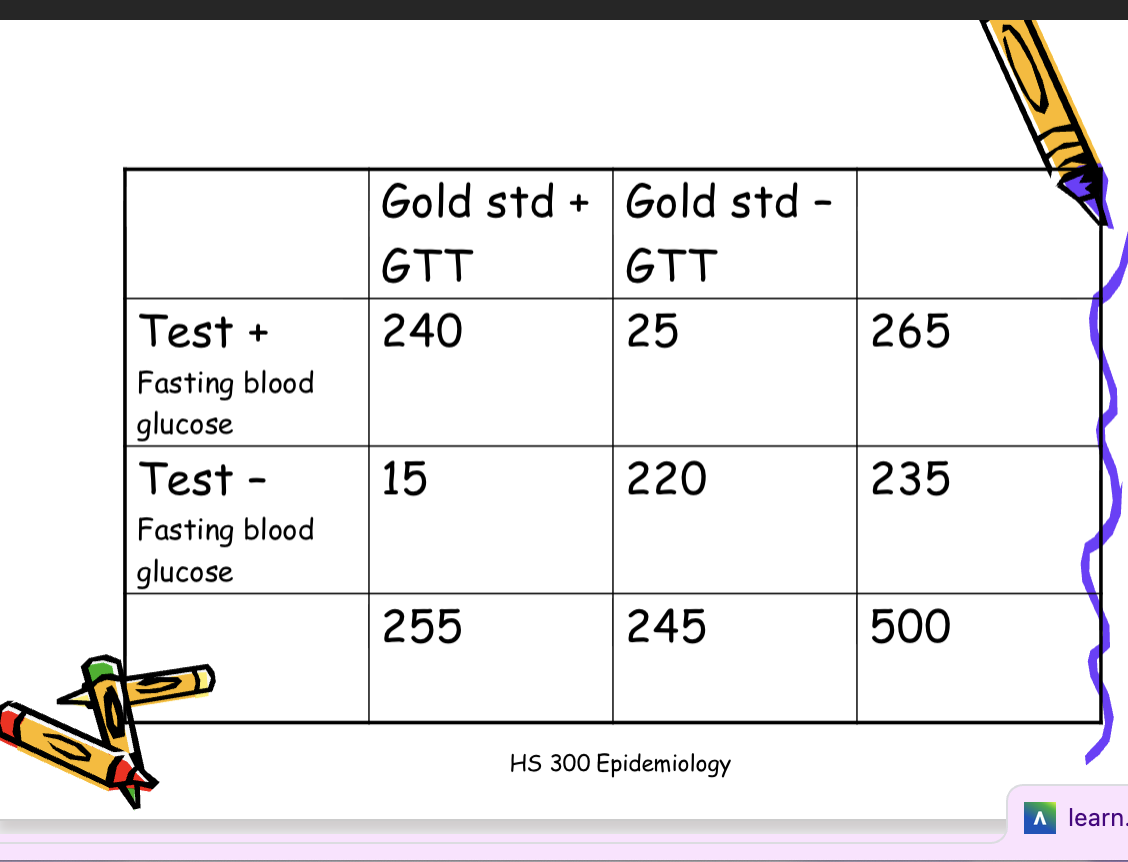
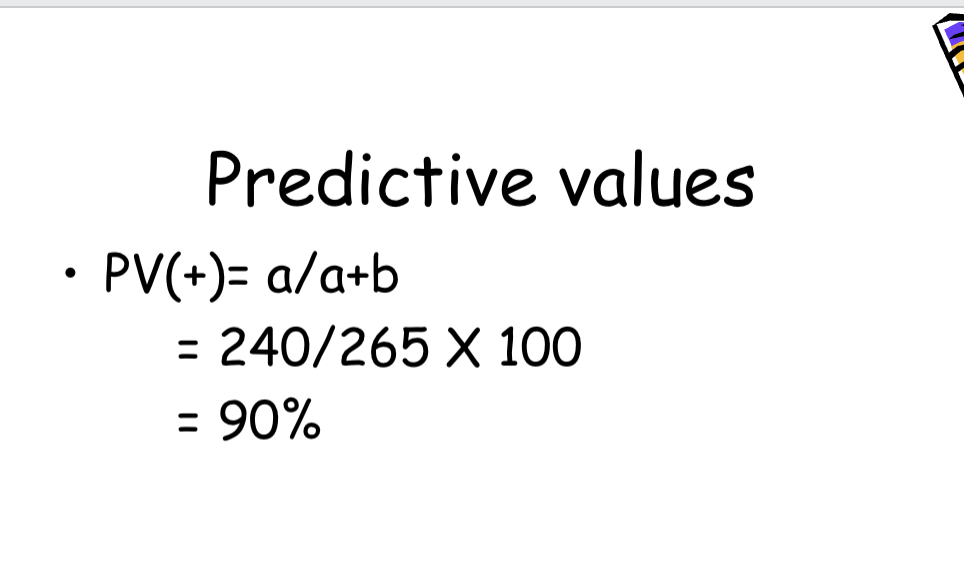
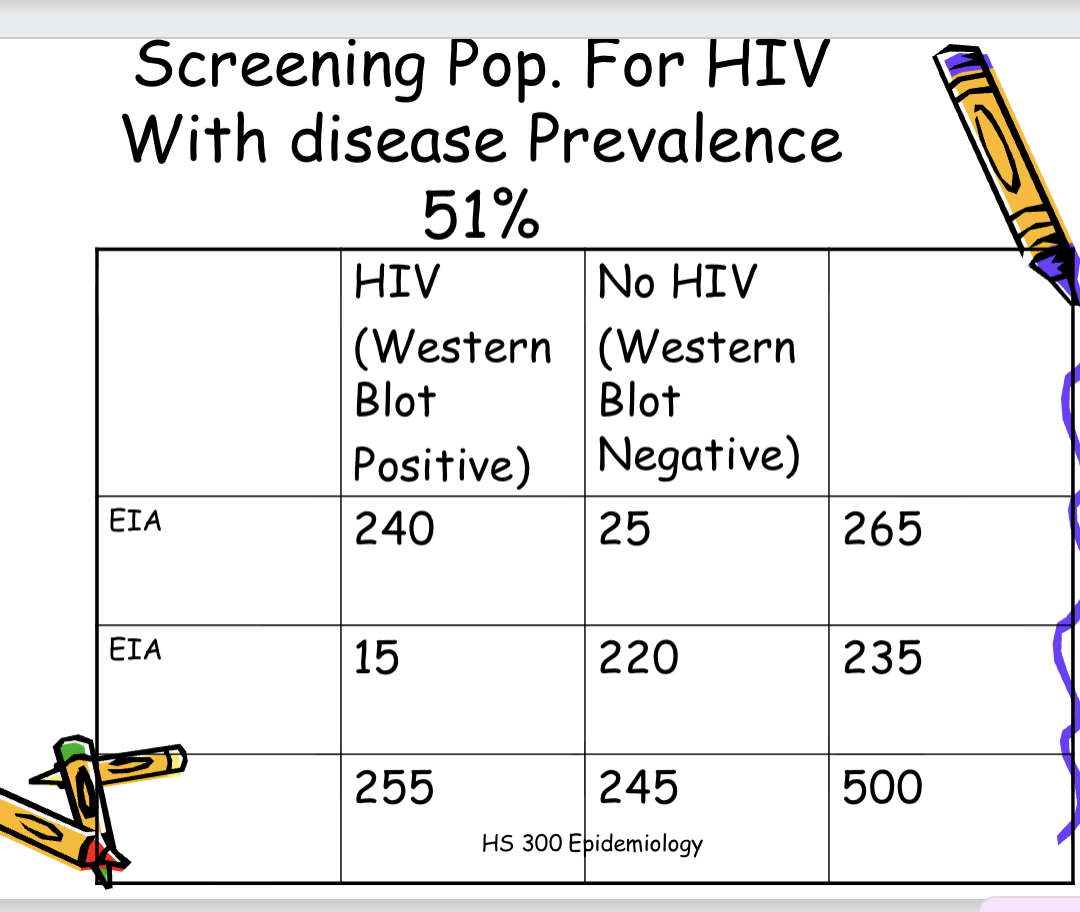
Example
500 individuals, aged 70 years+ are
screened for diabetes with a fasting
blood glucose. 265 screened positive.
The 265 positive screened then
underwent a glucose tolerance test
(GTT) and 240 were positive. The
235 who screened negative
underwent GTT and 15 tested
positive.
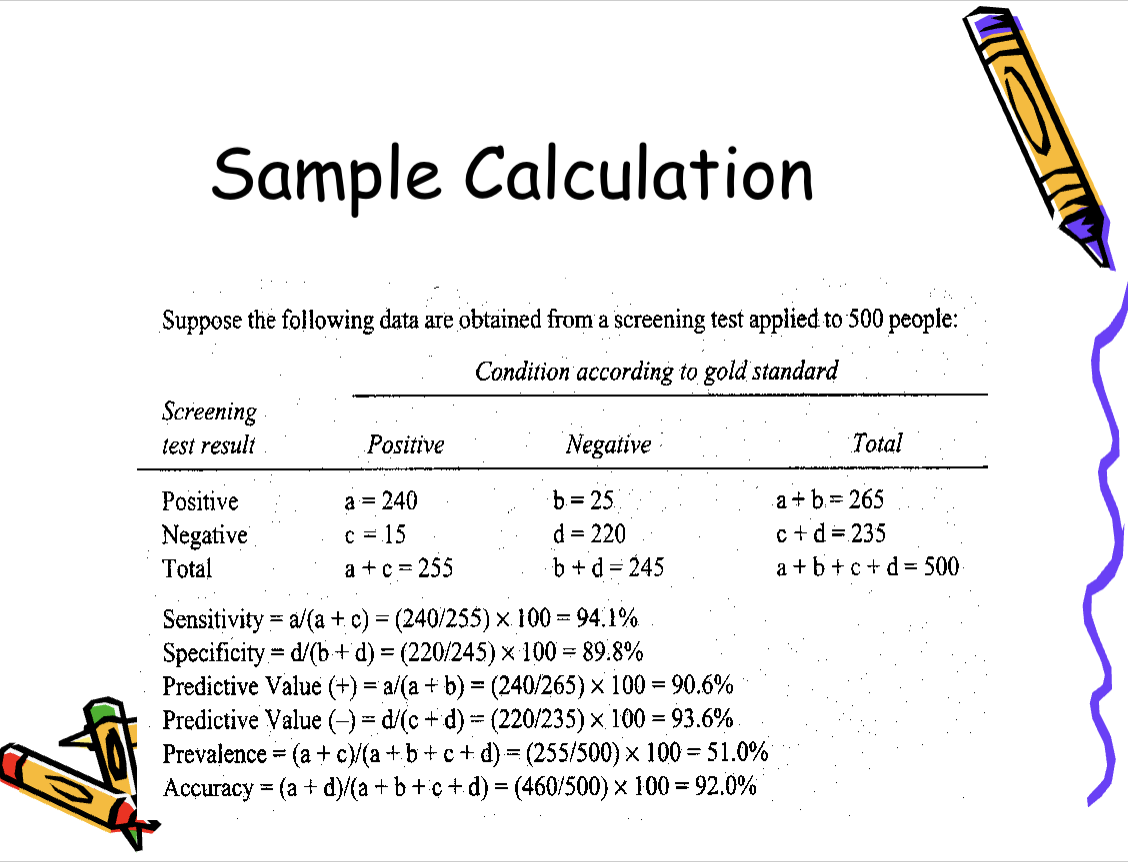
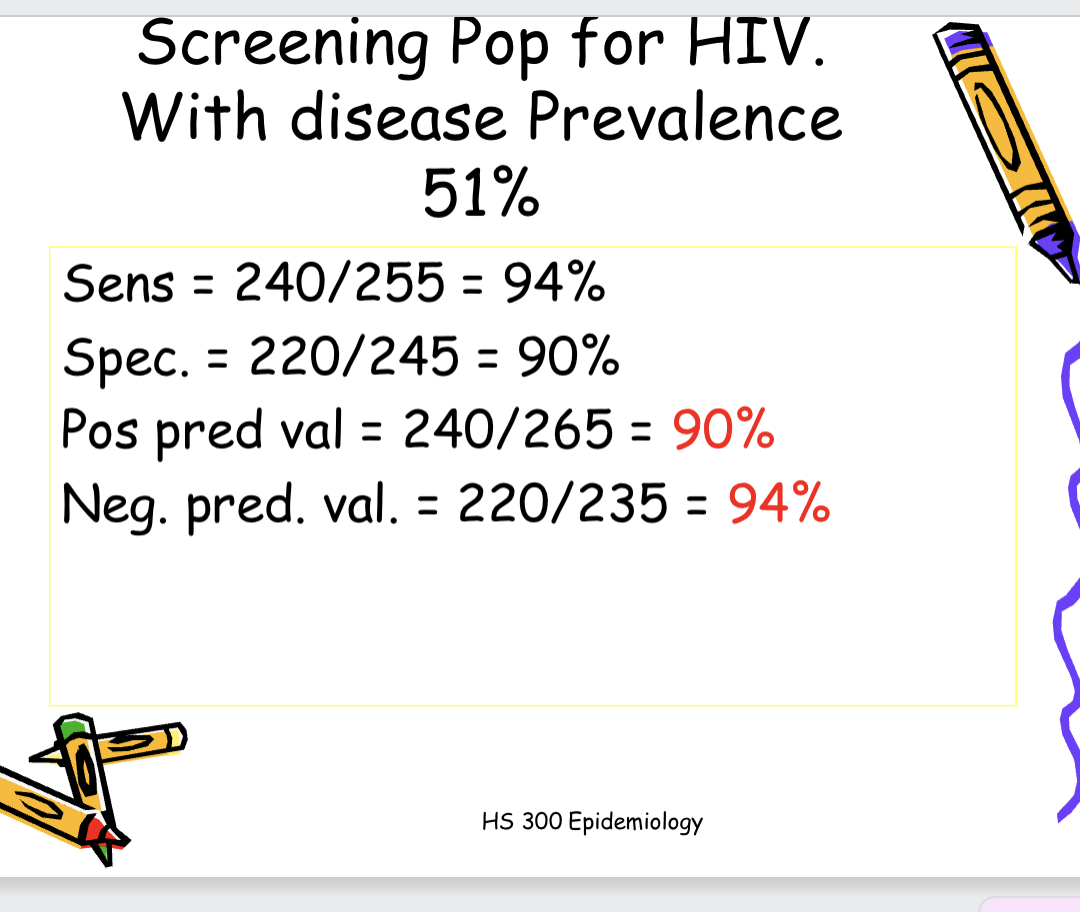
Calculate sensitivity (a/a+c): Among those tested, 94.1% of persons with diabetes screened positive by fasting blood
glucose screening test.
and specificity (d/b+d): Among those tested, 89.8% of those
without diabetes screen negative by
fasting blood glucose screening test
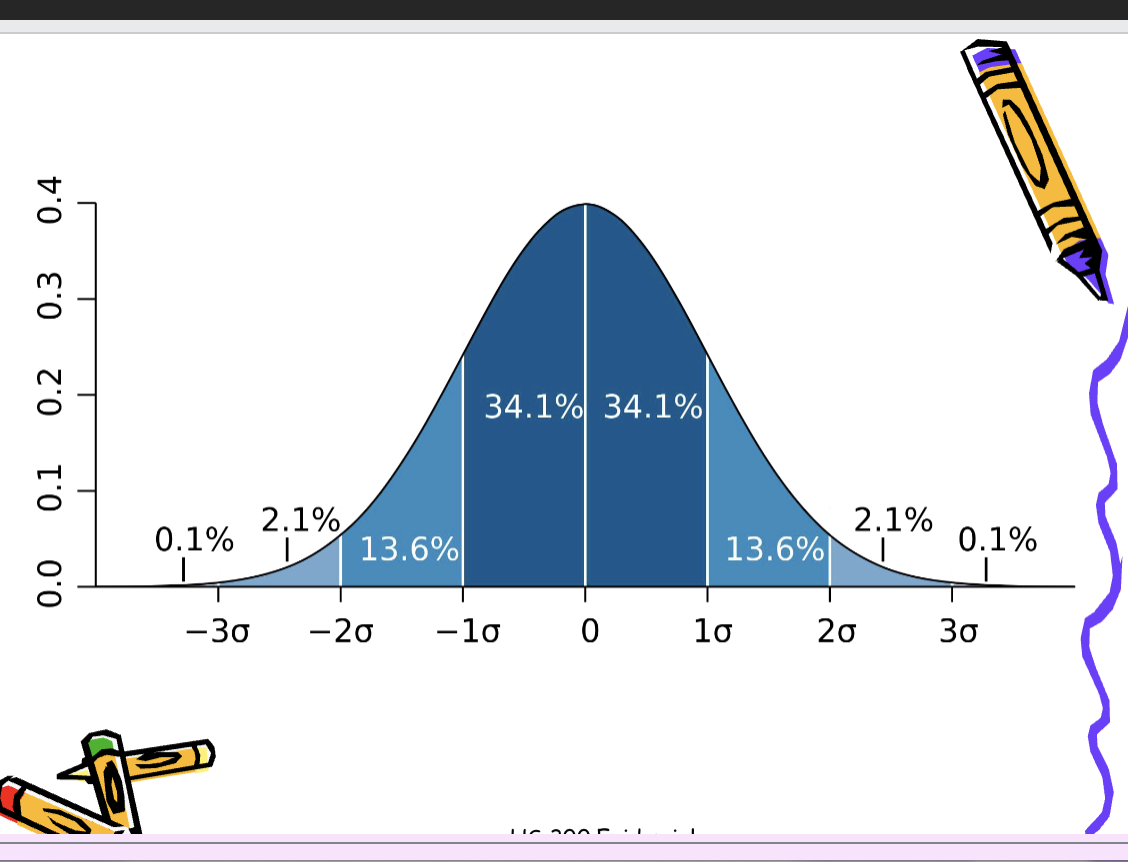
Normal Range
• Test results and measurements have
a ‘normal range’
• Fasting blood glucose:
82-110mg/dl - a range
• How is this decided?
• 2 standard deviations from the mean
• Includes 95% of asymptomatic
population (1 in 20 outside range)
HS 300 Epidemiology
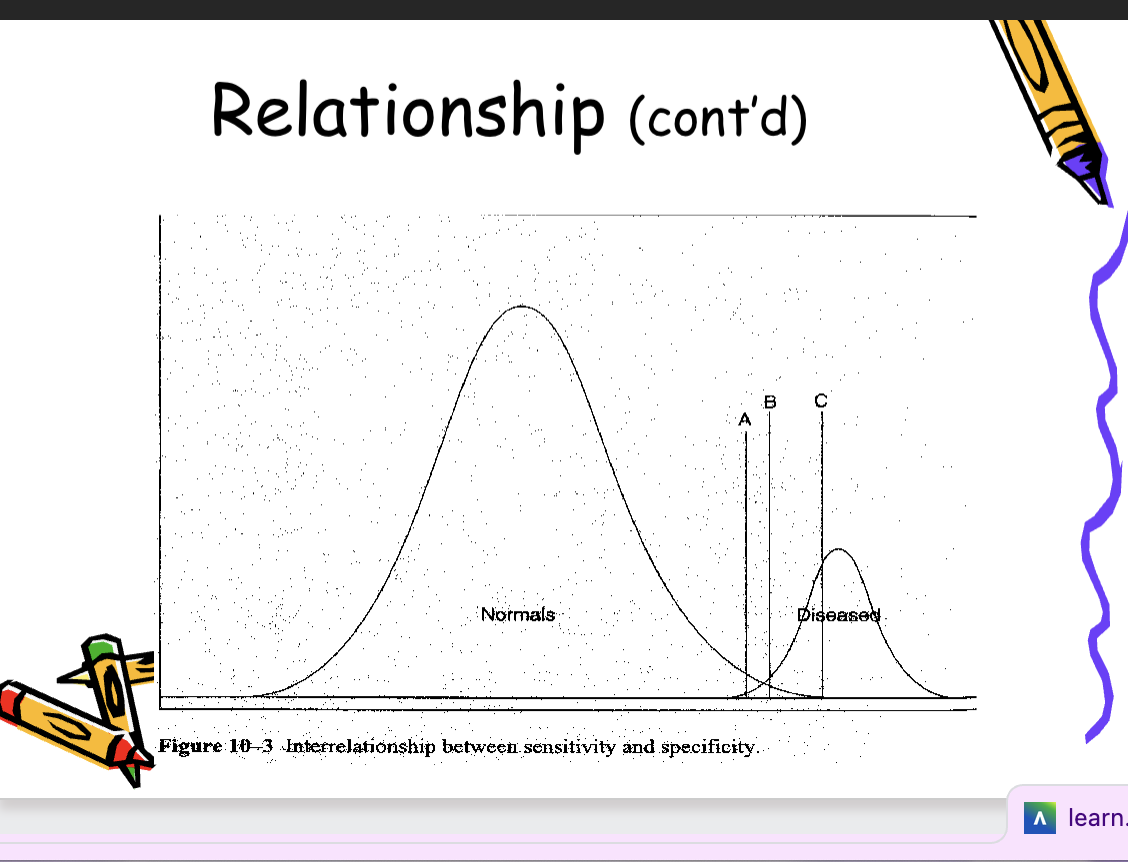
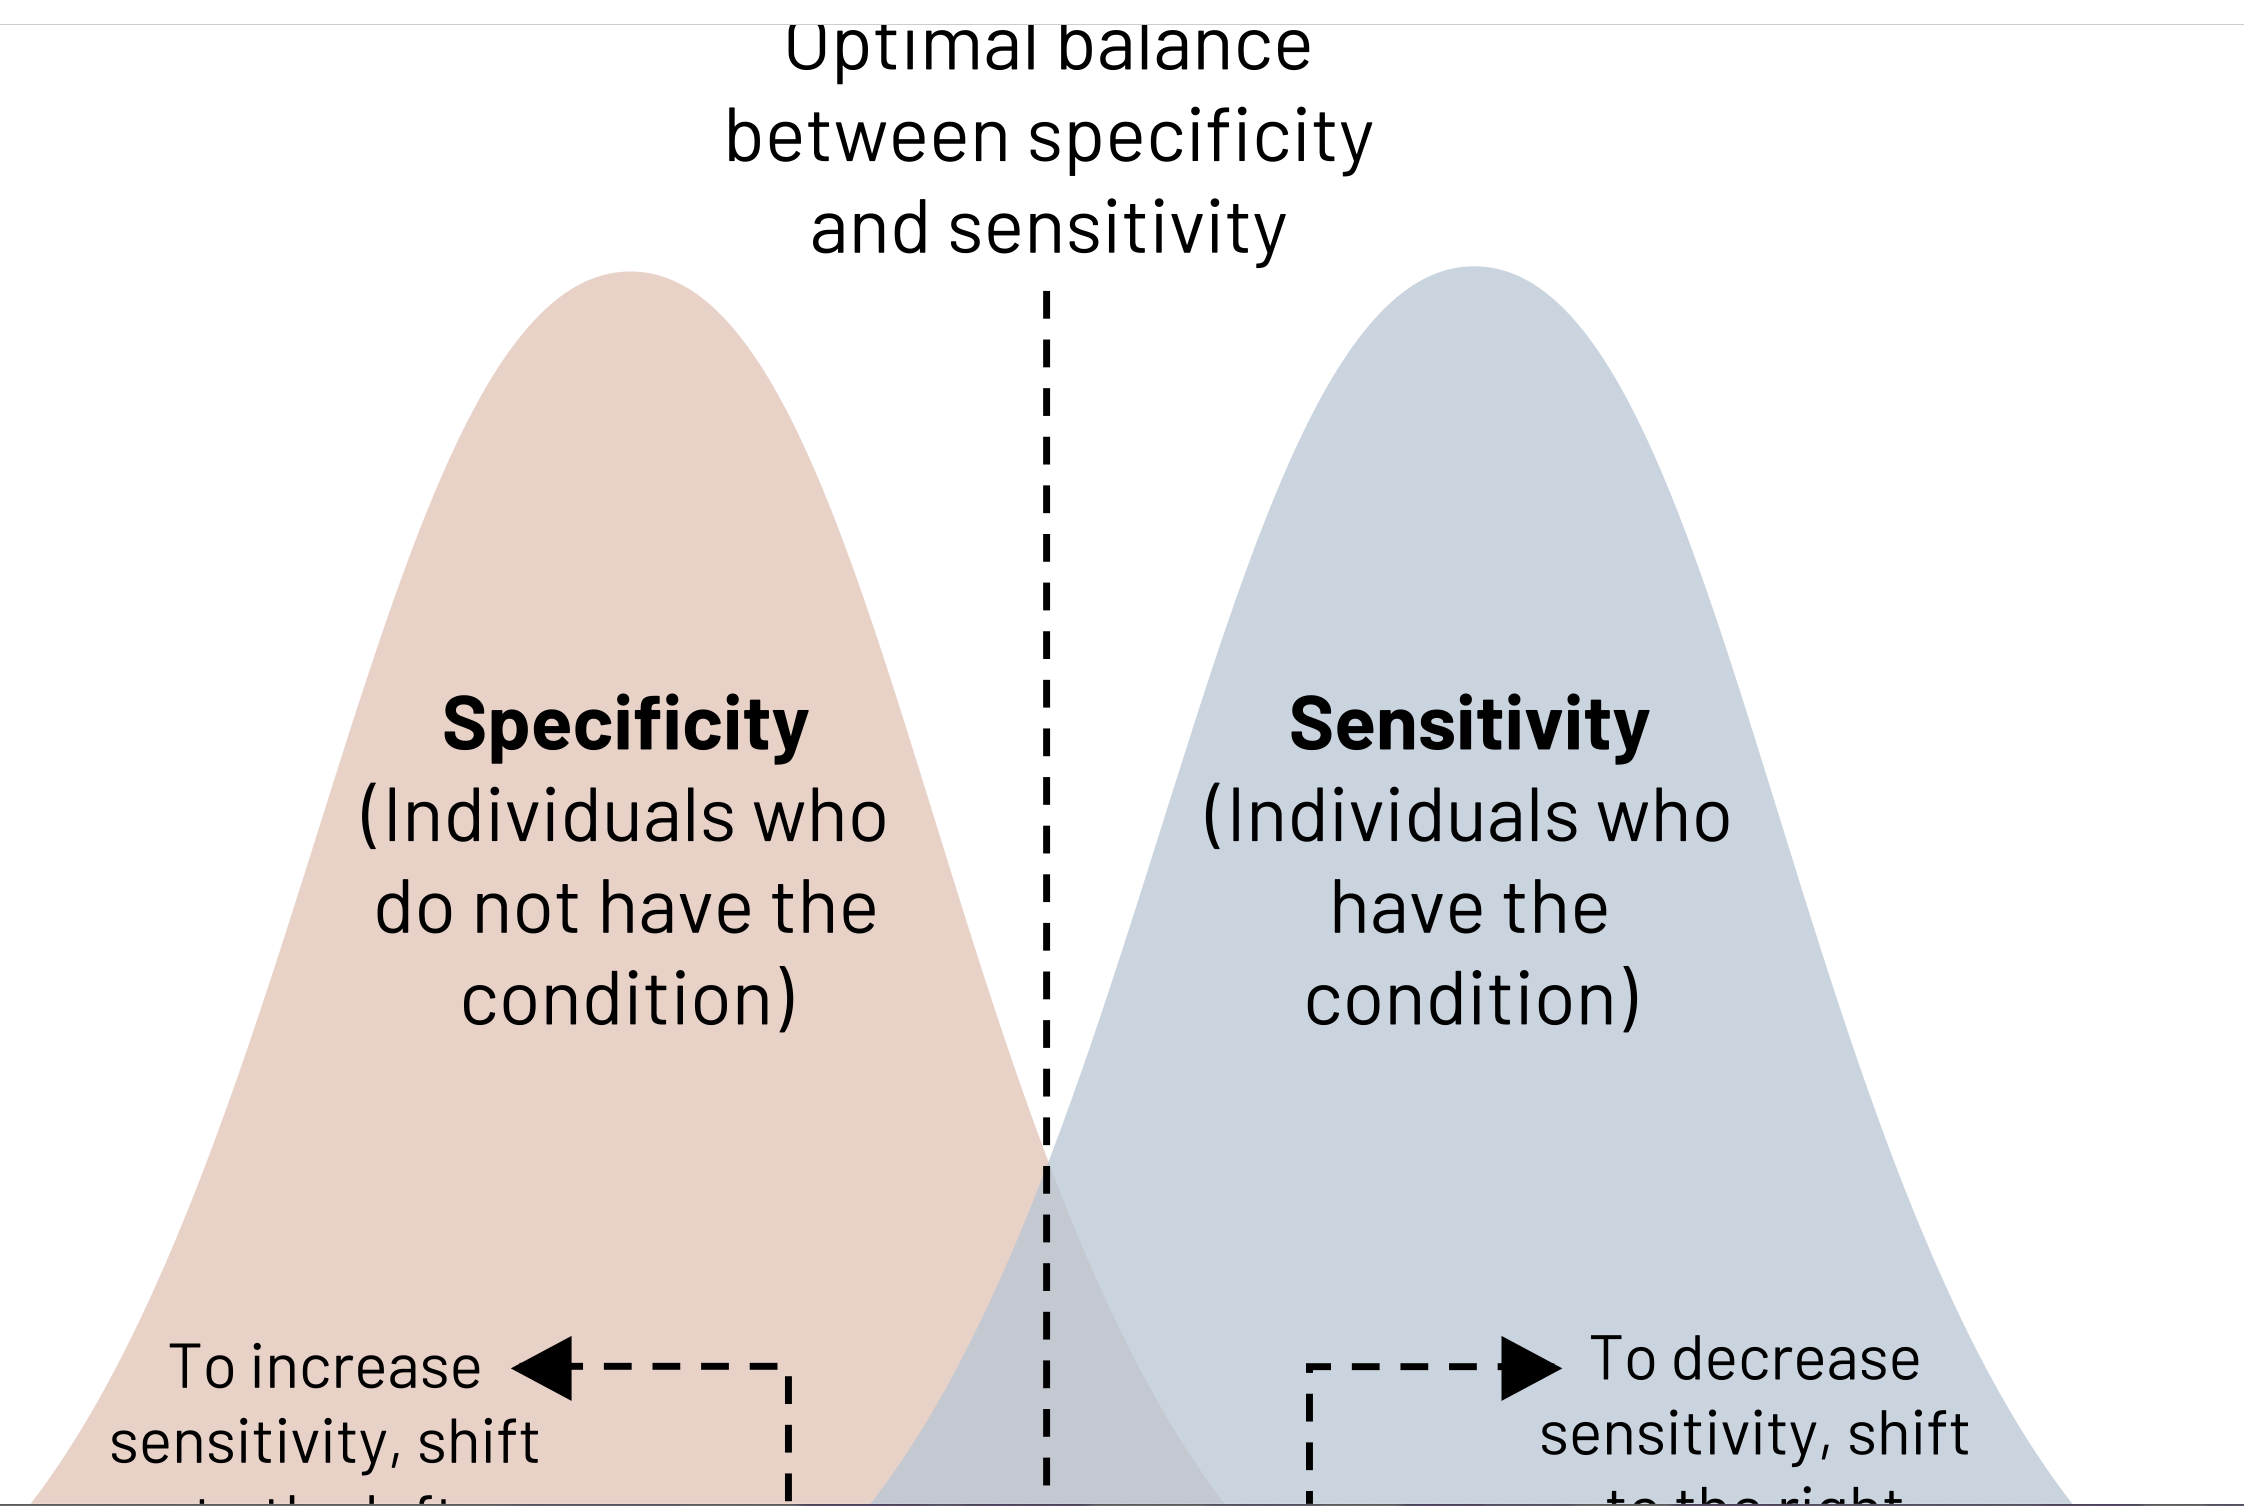
Relationship between sensitivity and specificity
• To improve sensitivity, the cut point used to classify
individuals as diseased should be moved farther in
the range of the non-diseased (normals). (A)
• To improve specificity, the cut point should be
moved farther in the range typically associated
with the disease . (C)
A successful screening test will
balance cut point criteria so that
both overreferrals and
underreferrals for diagnostic te
sts
are minimized.
!!1Effects of prevalence on disease on screening test results
Sensitivity and specificity
Stable properties of screening tests, unaffected by prevalence of the disease
If you want to know who actually has the disease, you look at the gold standard rather than the screening test is saying
Predicitve value (+) interpretation: among this screened population, 90% of those who screened positive for diabetets by fasting blood glucose screening test truly have diabetes
!!!Effects of Prevalence of
Disease on Screening Test
Results conti…
5. How might one improve the positive predictive value of this screening test?
Screen a population with a higher prevalence of colon cancer
• When the prevalence of a disease
falls, the positive predictive value
falls, and the negative predictive
value rises
!!When the prevalece of a disease in the screened population rises, the positive predicitive value of the screening test will also rise
ex: screening for HIV in high disease prevalence and in low disease prevalence populations
PPV: among those screened, 90% of those who screen positive truly have HIV
!!!Screening program feasibility
Once acceptable sensitivity and
specificity levels of screening test
are attained
➢The test’s predictive value is the
main way to measure a screening
program’s feasibility
Screening program feasibility - predicitve value
Its is a program, more than just a test
Screening test itself - include validity
Is there treatment available for individuals who screen positive
Follow-up of positive screened cases
Success of a program will also depend on the population to which the screening program is applied - predictive value
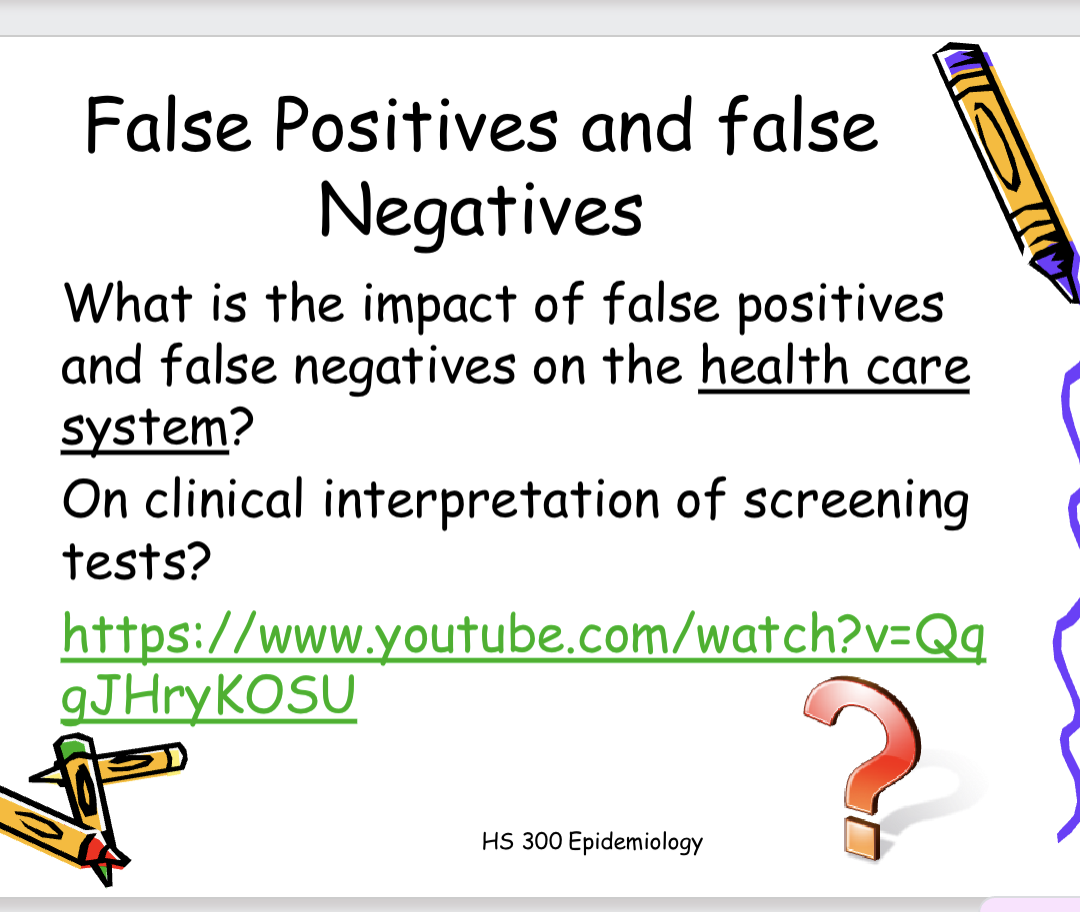
implications of low positive predicitve value: any individual who screens positive will have a low probability of having the disease on diagnostic testing. Low positive predicitive value will get a high number of false positives. Low negative predicitive value will have a high number of false negatives

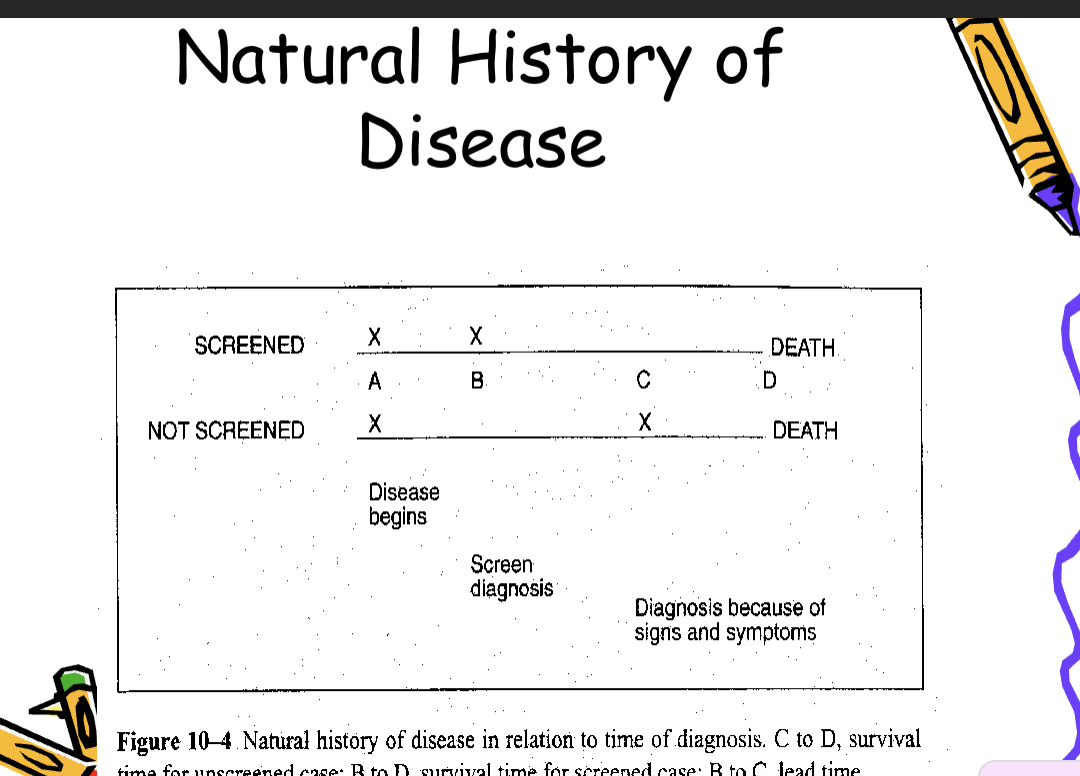
Screening Test Bias
• Lead time bias
– The perception that the screen-detected case
has longer survival because the disease was
identified early.
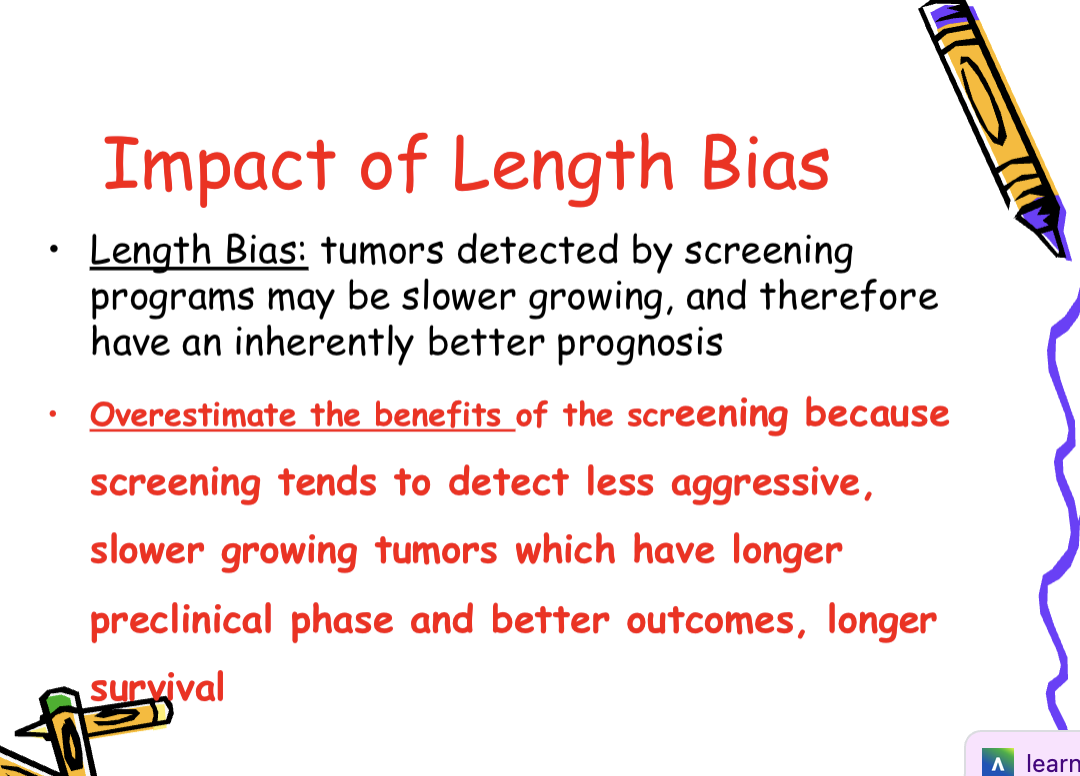
• Length bias
– Particularly relevant to cancer screening.
– Tumors identified by screening are slower
growing and have a better prognosis
impact of lead time bias:
the perception that screen detected cases survive longer simply because the disease was identified earlier
!!can overestimate the benefits of a screening program when survival is used as the measure
Selection bias
Motivated participants who
choose to participate may have a
different probability of disease than
do those who refuse to participate in
screeningimpact: individuals w/ this bias may have a diff probability of disease (as a result of healthier behaviors or positive family history) than individuals who do not participate. Can overestimate the benefits of a screening program
Evaluation of screening programs
Despite the intuitive appeal of screening programs, their utility and benefits should never be assumed
screening tests must be evaluated with the same scientific rigor as any other aspects of epidemiologic investigation
Randomized control trial - optimal
subjects receive either the new screening test or usual care
Ecological time trend studies
compare geogrpahic regions with screening programs to those without
Case control studies
cases - fatal cases of the disease, controls - nonfatal cases, exposure - screening program
Measures of disease outbreaks
Attack Rate:
With acute infectious disease outbreaks, the population-at-risk increases greatly over a short period of time
uses for attack rates: in practice, attack rates are commonly used to describe occurence of: food borne illness, infectious diseases, acute epidemics
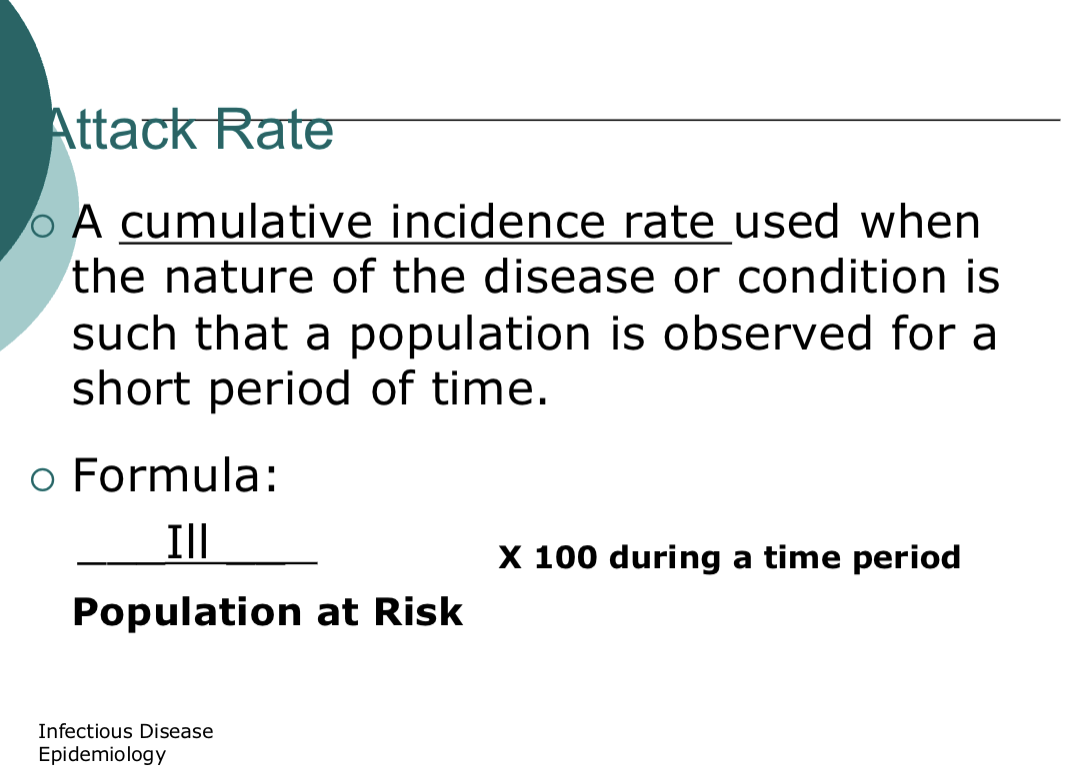
a cumulative incidence rate used when the nature of the disease or condition is such that a pop. is observed for a short period of time
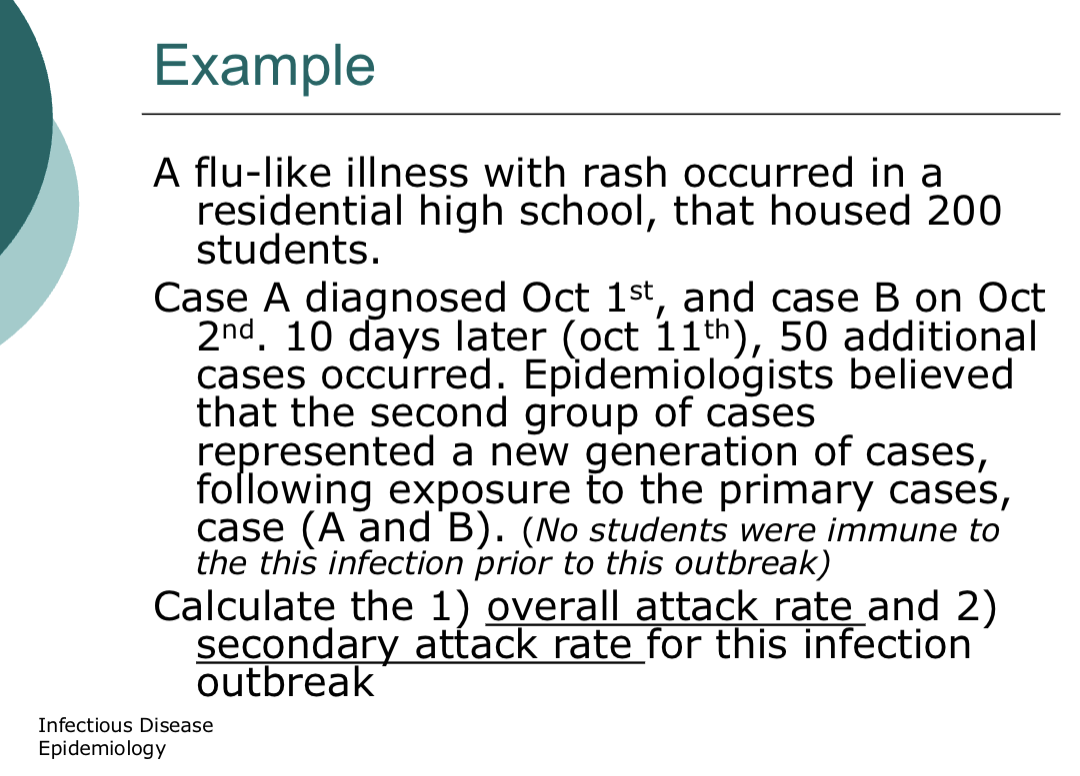
formula: sick/pop. at risk x 100 during time period
2+50/200 × 100=26%
primary attack rate formula:
2/200 × 100 =1%
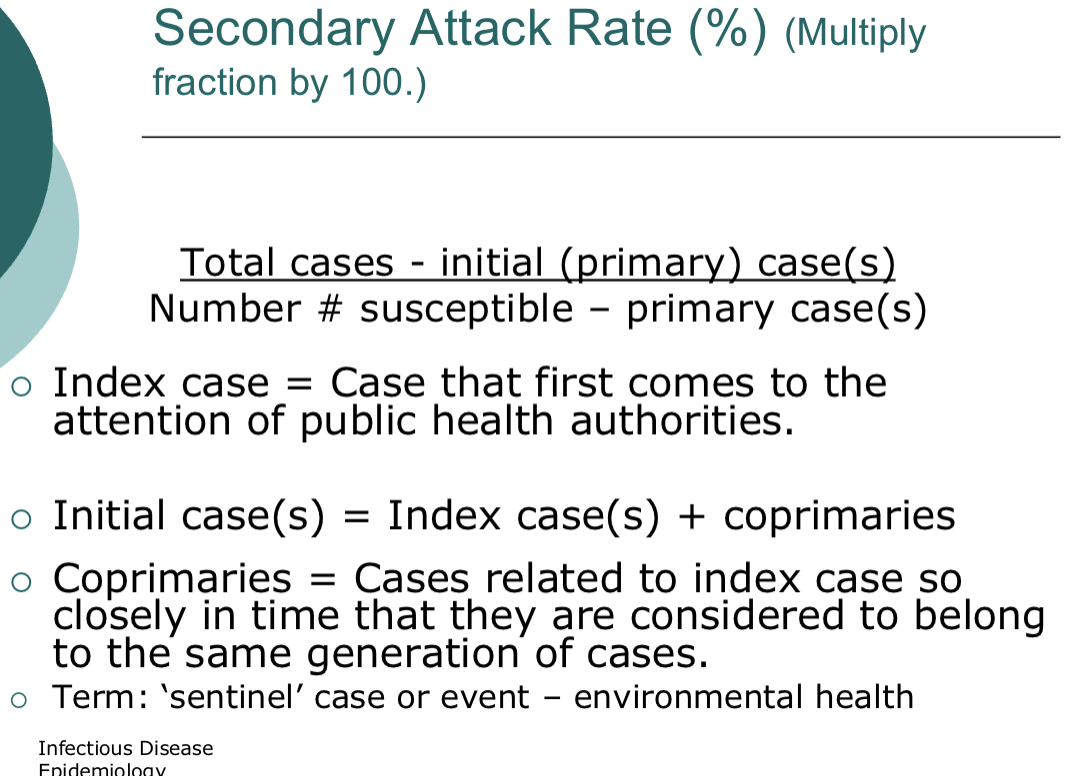
secondary attack rate:
total cases at secondary point, total pop. at risk - (initial case(s)
50/(200-2) x 100 = 24.2%
Case Fatality Rate (CFR)
The number of deaths caused by
the disease among those who have
the disease.
Number of deaths X 100
—————————-
Total Number of cases
Number of meningitis deaths X 100
————————————
Number of meningitis cases
Sample calculation:
Assume that an outbreak of meningitis occurs
in New South Wales. Health authorities record
98 cases of the disease, all of whom are
untreated. Among these, 60 deaths are
reported.
CFR = (60/98) x 100 = 61.2%
Interpretation: in a meningitis outbreak in New South Wales, the reported case fatality rate was 61.2%
-Emic terms
Endemic:
Usual level of disease occurrence in a population
Ex: flu rates during flu season spike
Epidemic:
Unusually high level of disease occurrence in a population in the light of past experience
Ex: Ebola (2014), Measles, Polio, and Smallpox.
Pandemic:
A worldwide epidemic
Ex: covid, swine flu, HIV/Aids
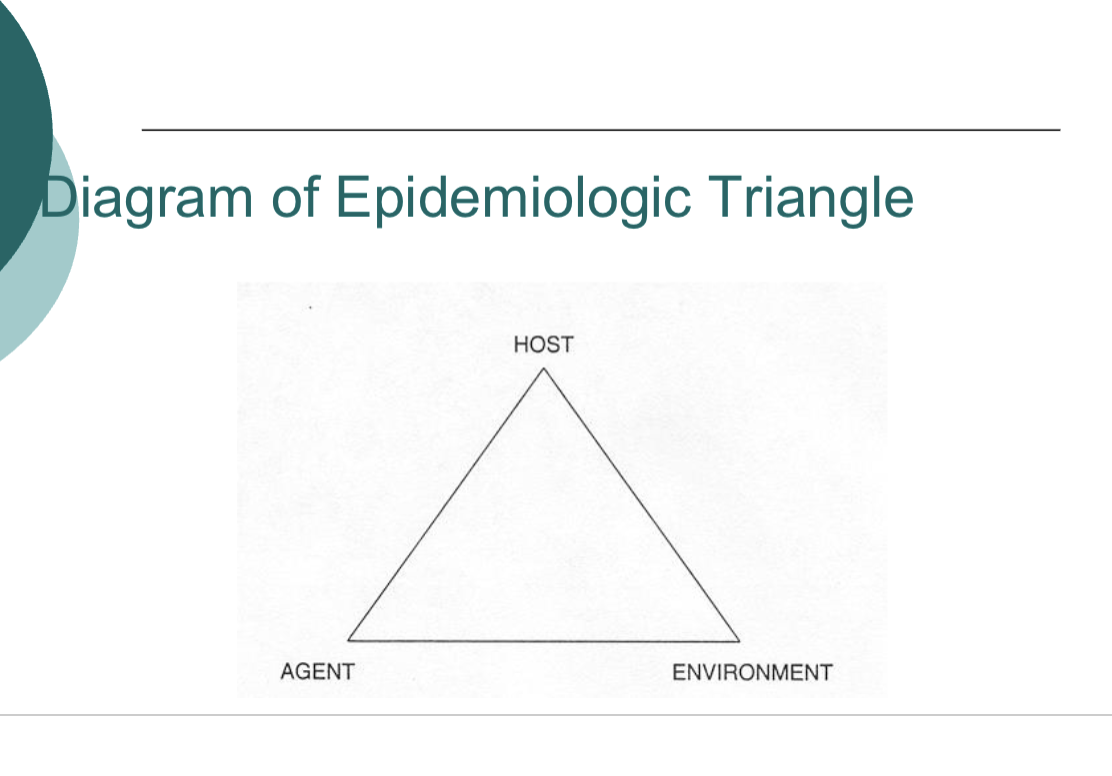
Diagram of epidemiologic triangle
agents:
Microbial agents of infectious disease
Bacteria (Strep)
Viruses (influenza)
Mycoses - fungal disease (athletets foot)
Protozoa (malaria)
Helminths (roundworm)
Characteristics of Infectious Disease Agents
Infectivity:
The capacity of an agent to enter and multiply
in susceptible host.
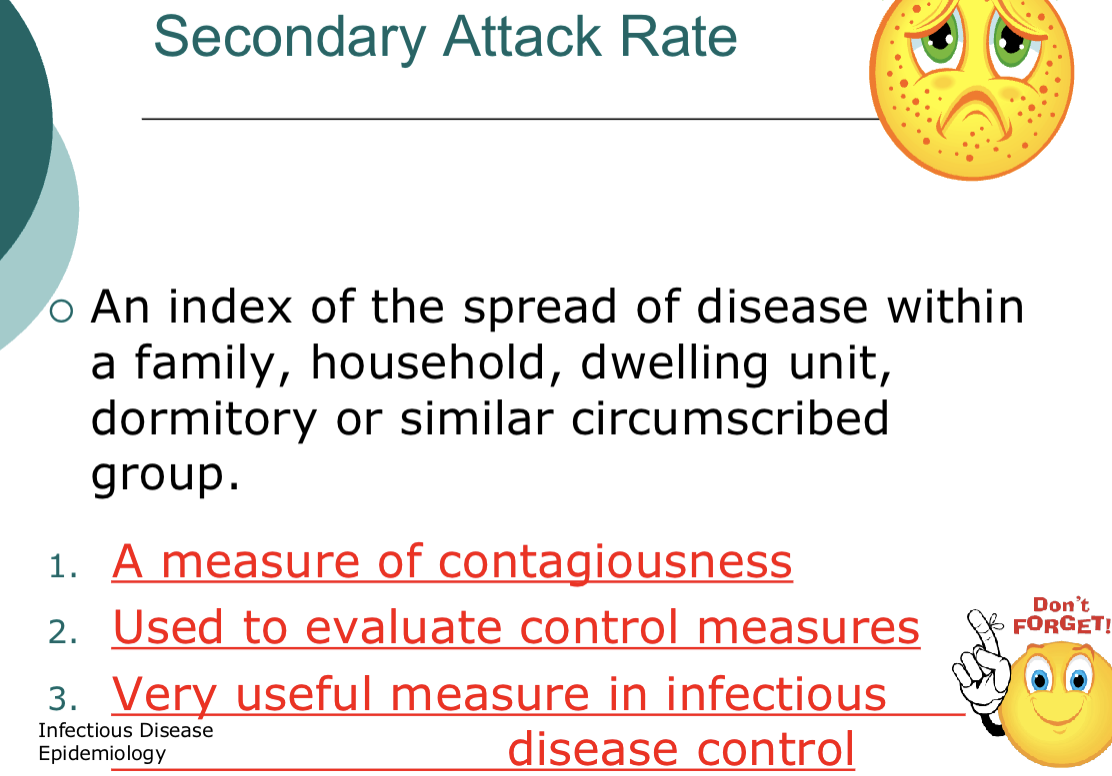
⚫ Measured by the attack rates, specifically
secondary attack rates
⚫ High infectivity = when secondary attack rate of a disease is high = measure of Contagiousness
Pathogenicity:
⚫ Capacity of the agent to cause disease in the infected host.
⚫ Measured by the proportion of infected individuals with clinically apparent disease
High levels= low rate of subclinical( disease not showing at clinical setting yet) cases among those infected ex: measles
Low levels: high rate of subclinical cases among those infected ex: polio
Virulence:
⚫ Refers to the severity of the disease.
⚫ Measured by the proportion of cases
that are severely ill cases.
Number of severe cases/Total Number of cases x 100
Vibrio cholera
An acute diarrheal illness
Caused by infection of the intestine with vibrio cholerae bacteria
Ppl can get sick when they swallow food or water contaminated with cholera bacteria, especially when travelling (Haiti)
The infection is often mild or without symptoms, but can sometimes be severe and life-threatening
Host
Once an angent infects the host, the degree and severity of the infection will depend on the host’s ability to fight off the infectious agent
Ex of a host is a human
Host defense mechanisms
Nonspecific (barriers): skin (protects against lots of things nothing specific), mucosal surfaces, tears, salvia, gastric juices
Specific: immune system, ex: T-cells focus on specific microorganisms
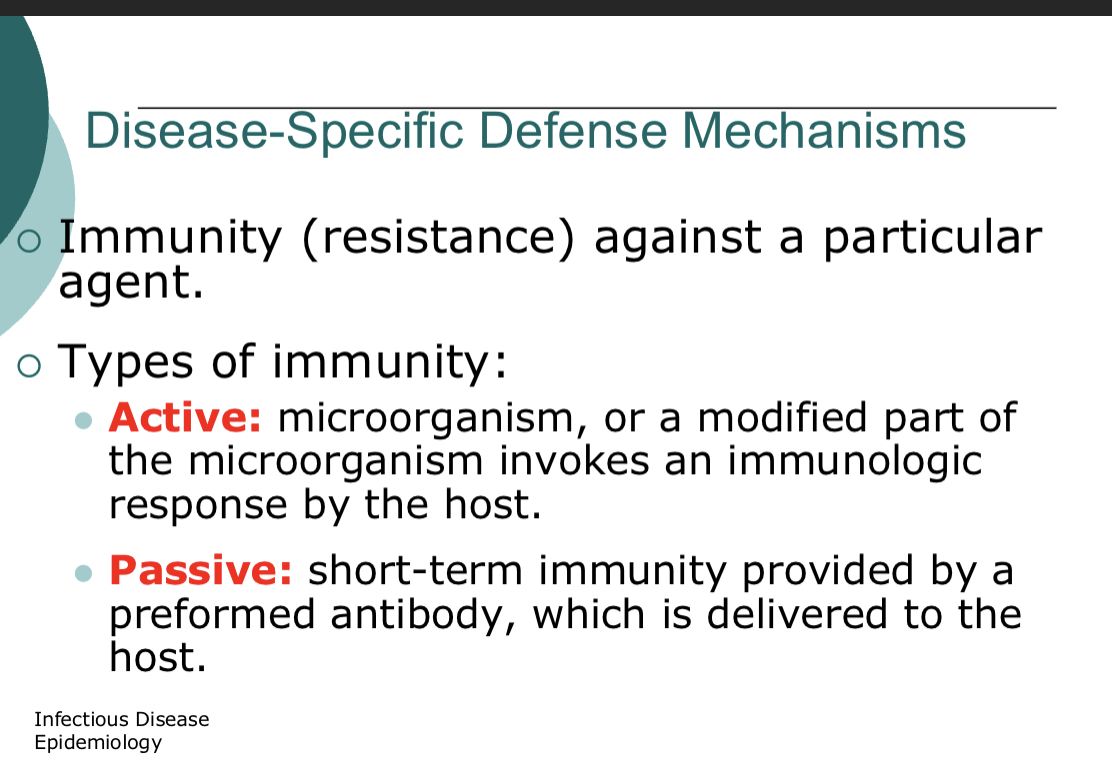
Disease-specific defence mechanisms
Immunity (resistance) against a particular agent
Types of immunity:
Active: microorganism or a modified part of microorganism invokes an immune response by the host
Passive: short-term immunity provided by a preformed antibody, which is delivered to the host
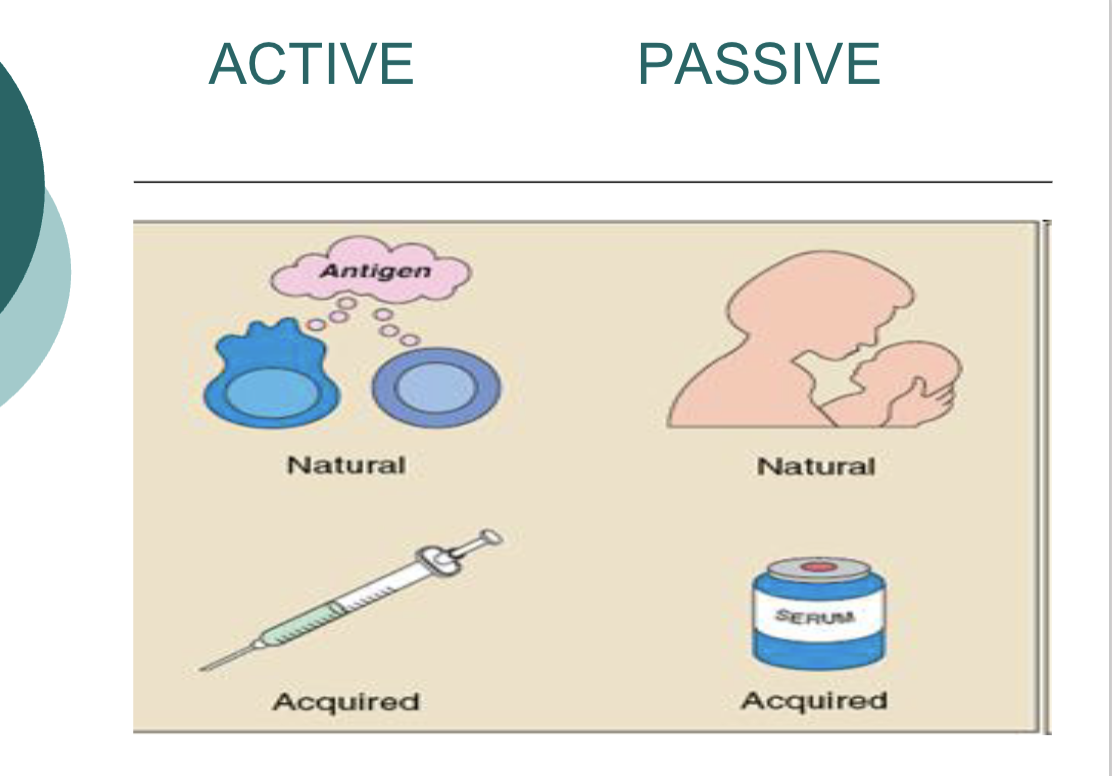
!!Active vs passive immune response
When the host makes the antibodies themself
=active immune response (vaccination—>activation of B + T cells—>forms memory)
When the host receives pre-formed antibodieds
=passive immune response (mother passing antibodies to her bby via placenta/breast milk—>use antibody instantaneously—>no memory cells)
Reservoirs of Infectious Diseases
The environment can act as a reservoir
that fosters the survival of infectious
agents.
Examples: contaminated water supplies
or food; soils; vertebrate animals
Direct transmission: spread of infection through person-to-person contact
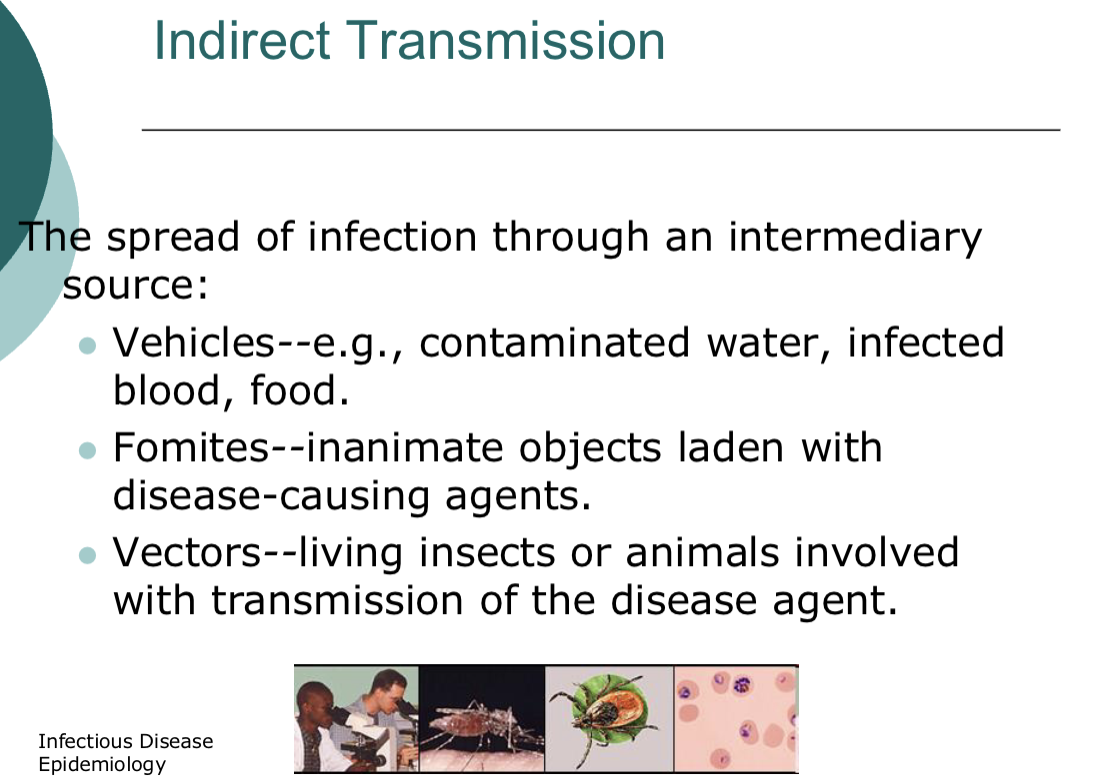
Indirect transmission: The spread of infection through an intermediary source:
⚫ Vehicles--e.g., contaminated water, infected
blood, food.
⚫ Fomites--inanimate objects laden with
disease-causing agents.
⚫ Vectors--living insects or animals involved
with transmission of the disease agent.
!!Inapparent / Subclinical Infection
No symptoms of infection present.
Important because disease can be transmitted
by infected but asymptomatic individuals
In asymptomatic individuals, clinicians can look
for serologic evidence of infection (blood test for antibodies).
⚫ Example: Increase in serum Hep A
antibodies in hepatitis A virus affected
individuals, whether symptomatic or not
!!Herd or group immunity
Immunity of a population, group, or
community against an infectious
disease when a large proportion of
individuals are immune either
through vaccinations or prior
infection. Produces antibodies in preparation of encountering a disease again
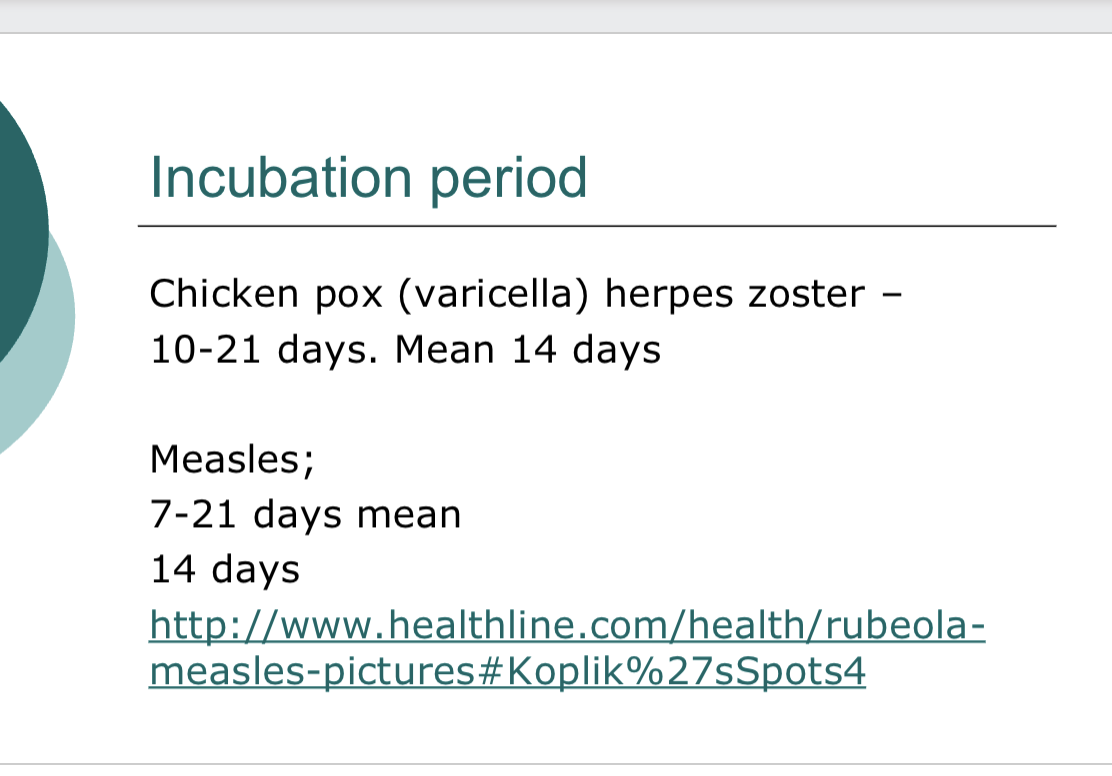
Incubation period: time from the infectious agent entering the body to development of signs and/or symptoms of the dieases in the host
Steps in investigating a disease outbreak
1. Verify that this is a disease outbreak
a) number of cases
b) confirm cases
2. Define a “case” - have a definition of a condition that is clear, you need an objective measure of the health state
3. Characterize cases by person, place, and time
4. Identify or hypothesize cause of outbreak
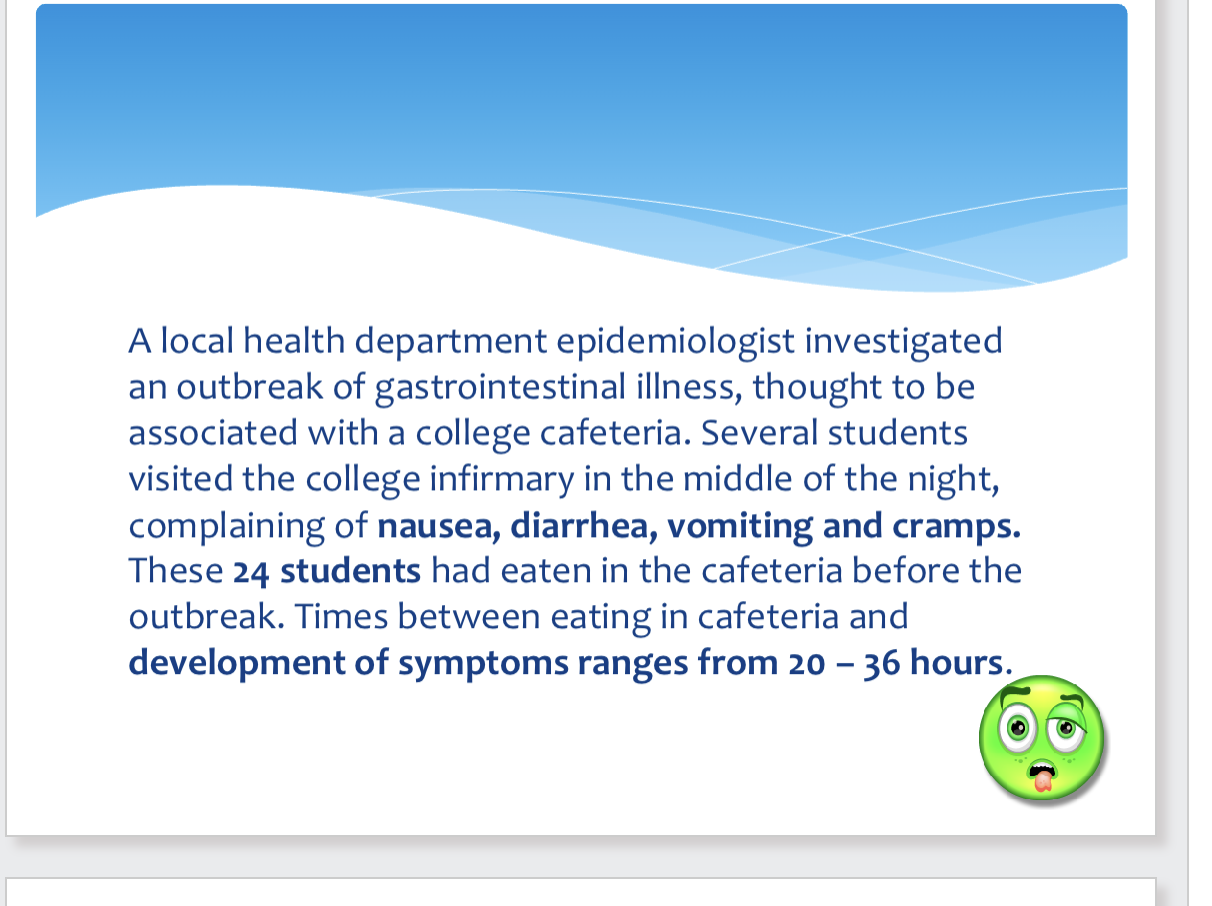
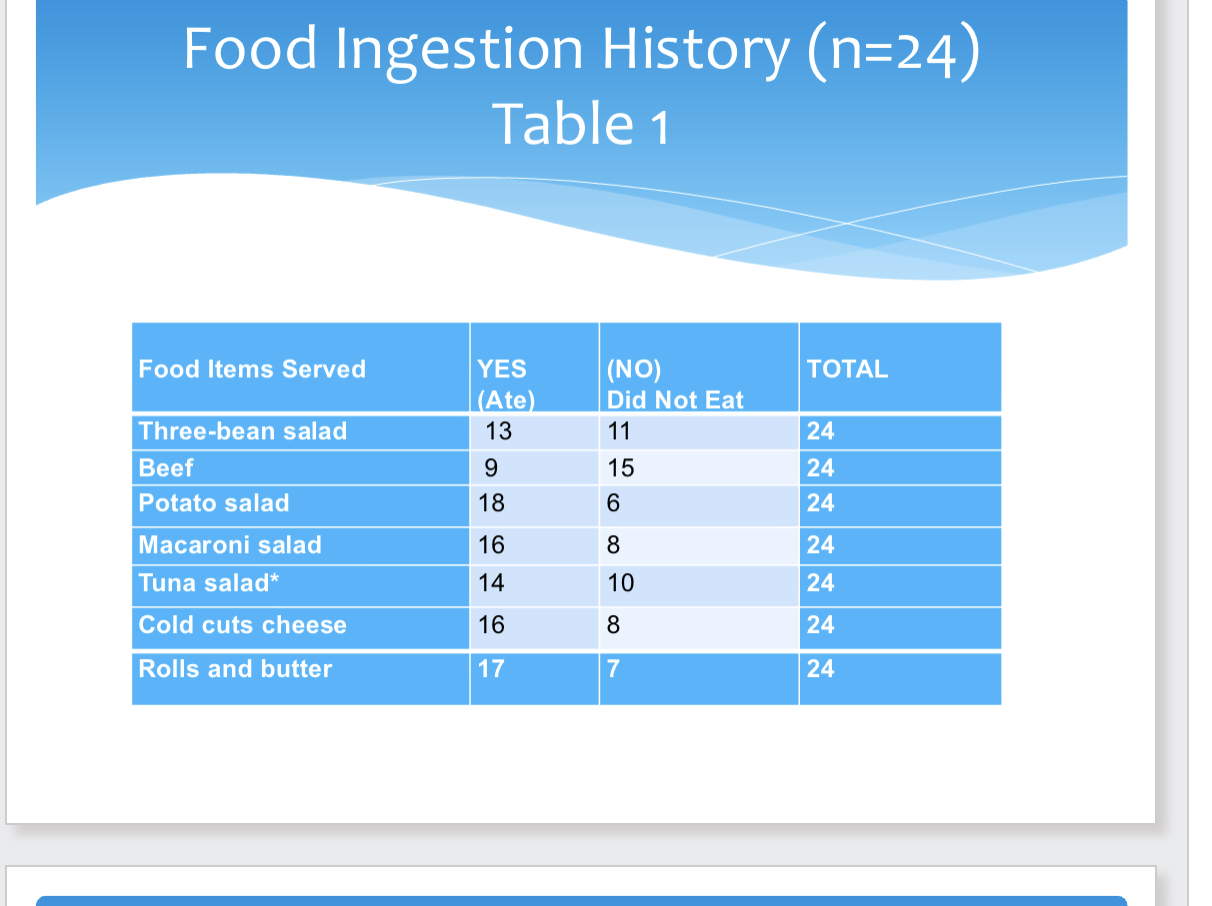
Food Ingestion History Example
think of epidemiological triangle
-host: student, agent: bacteria, environment: cafteria
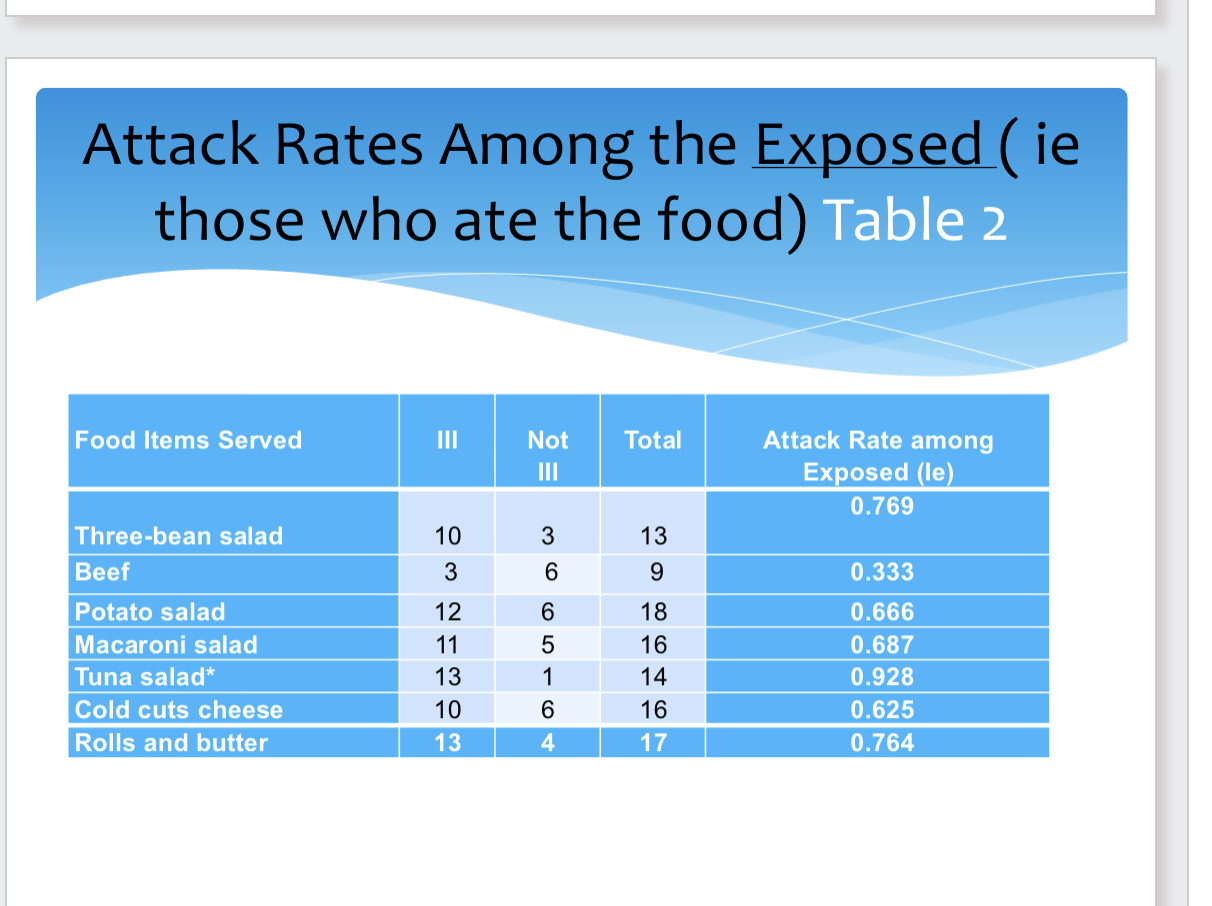
exposed: those who ate the food
attack rate: number of ppl who are ill/population at risk
three-bean salad ex: 10/13=0.769
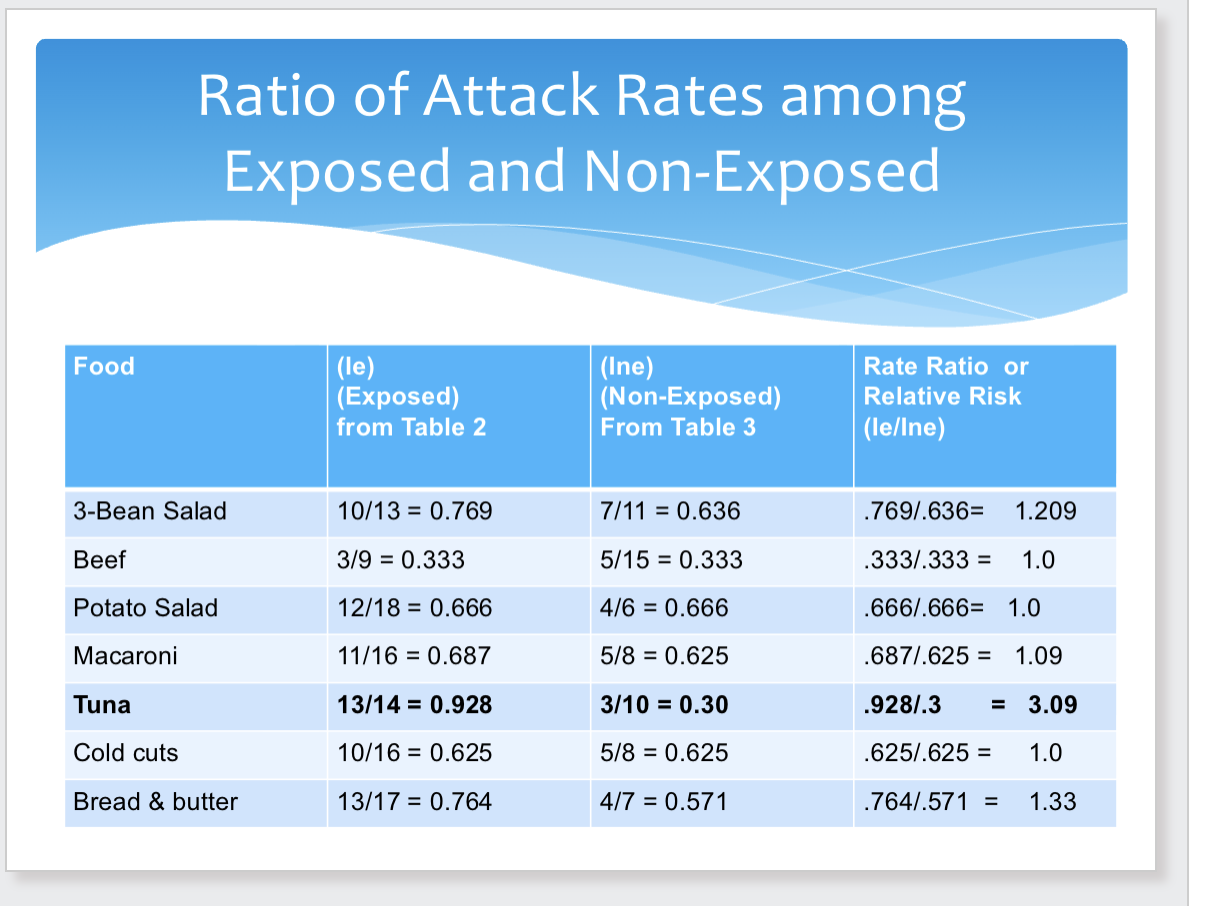
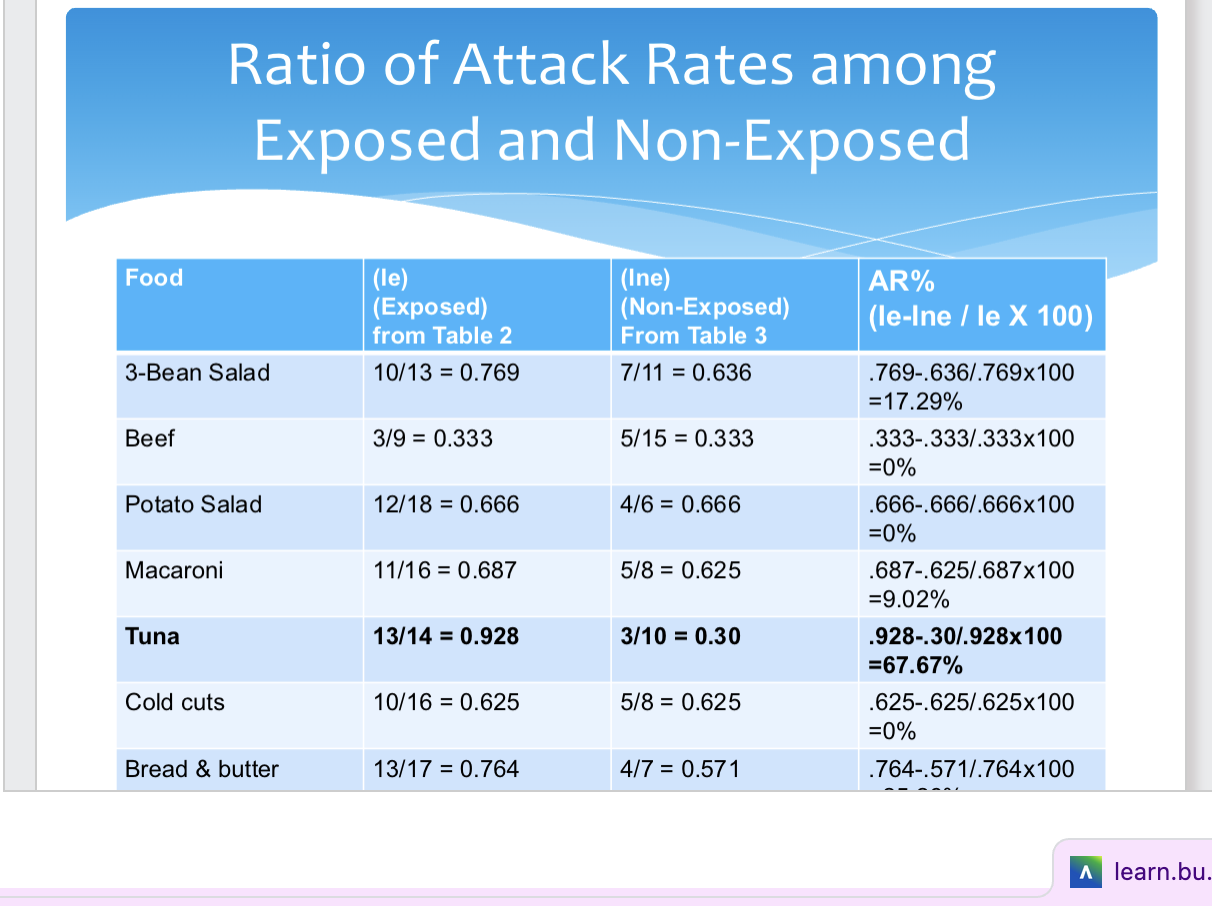
the 3-bean-salad and bread and butter have similar AR%
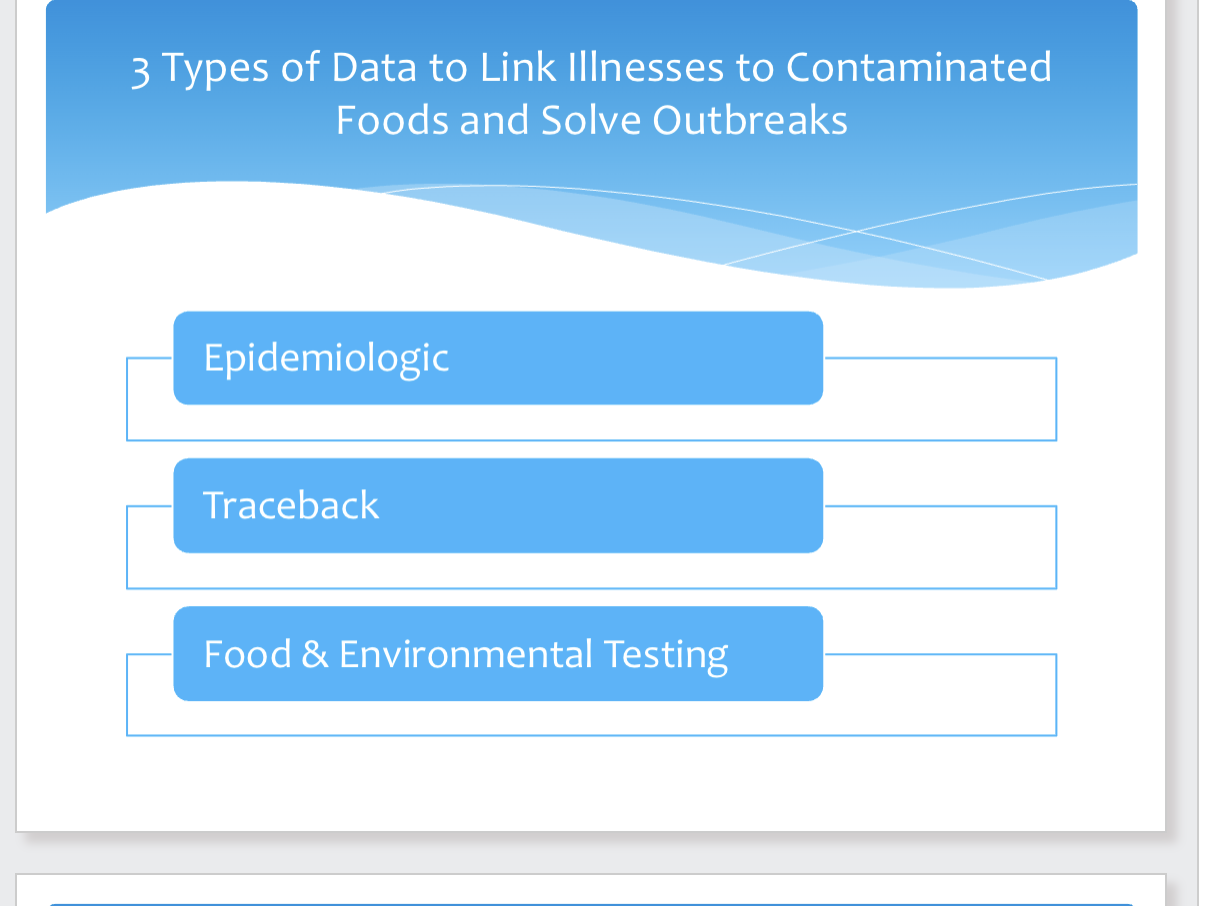
3 types of data link illnesses to contaminated foods and solve outbreaks
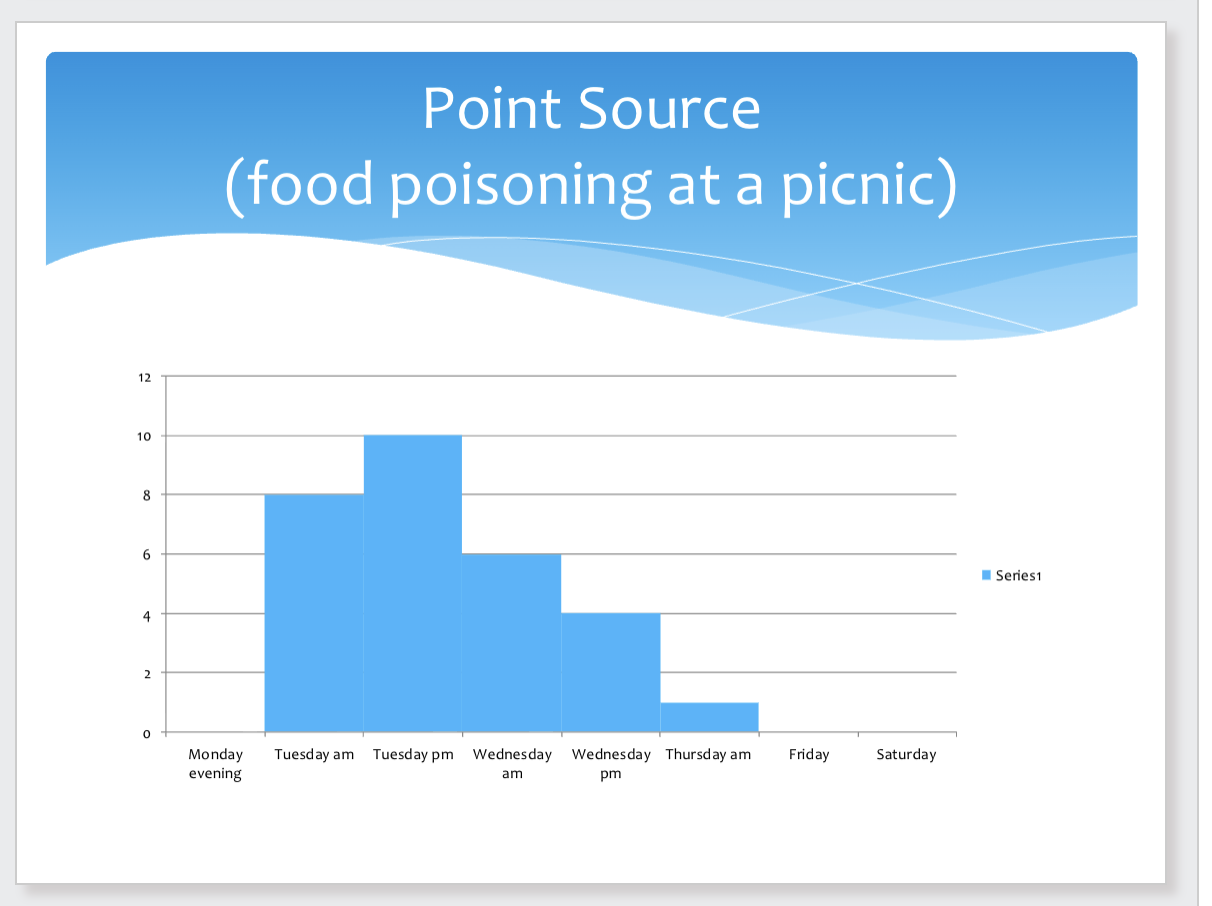
Point source:
rapid rise
peak
gradual decline
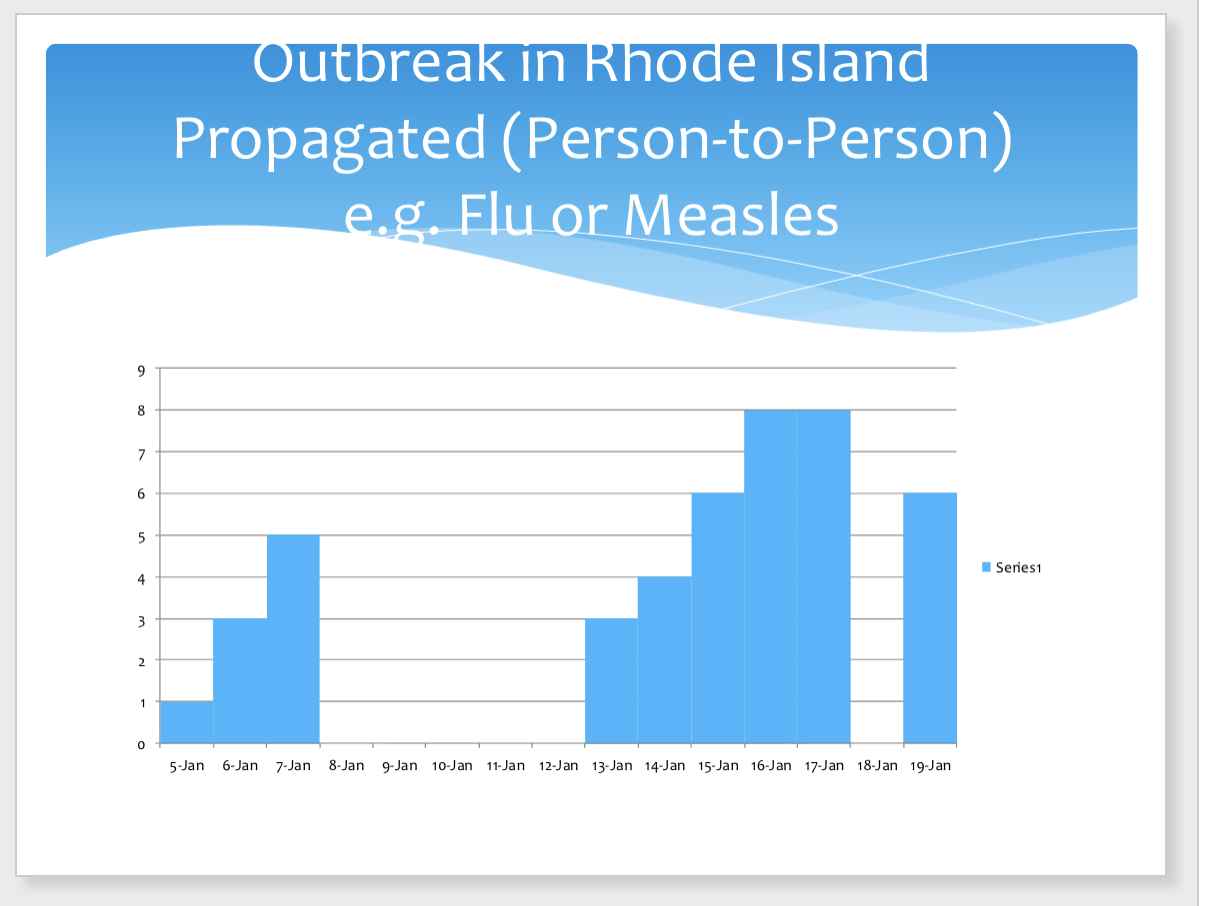
Propagated (person to person)
Characteristics
1. Gradual rise
2. More rapid decline
3. More than one peak, separated by average
incubation period for the diseas
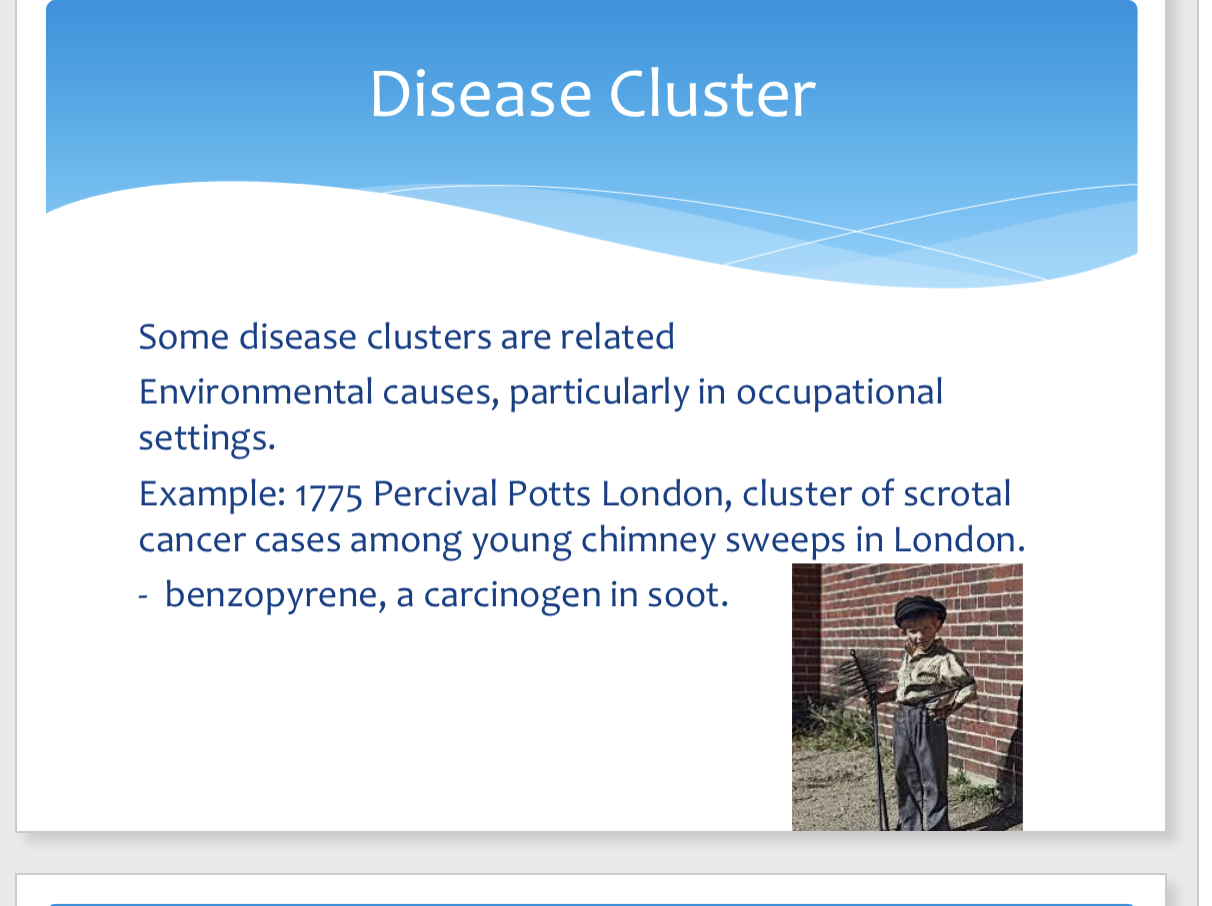
disease cluster: A group of cases of a disease, usually a relatively low prevalence disease in a geographic area or in time, whose distribution is believed not to be due to chance Example: leukemia cases, birth defects in a community
Isolation and quarantine
Isolation separates sick people with a contagious
disease from people who are not sick.
Quarantine separates and restricts the movement of
people who were exposed to contagious disease,
usually through a sick person, to see if they become
sick.
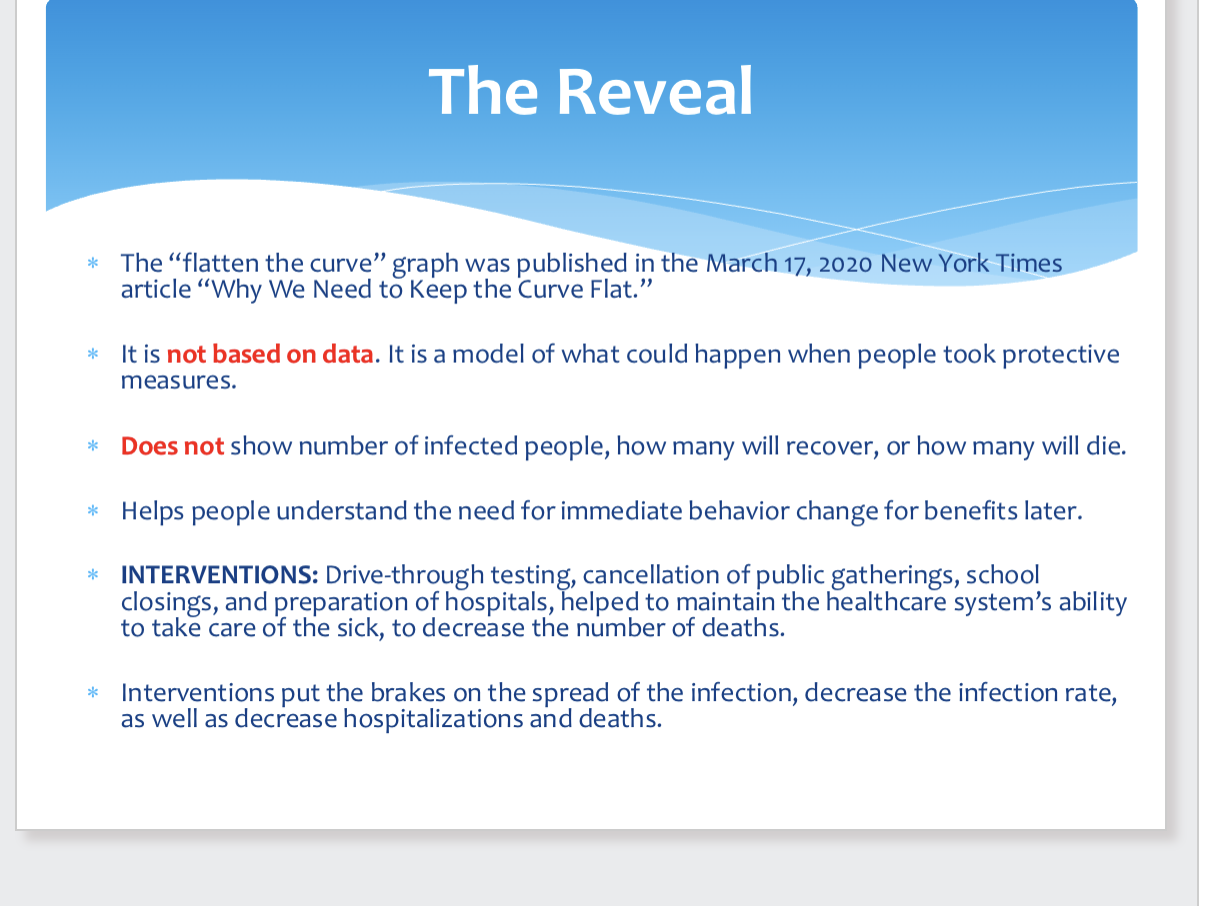
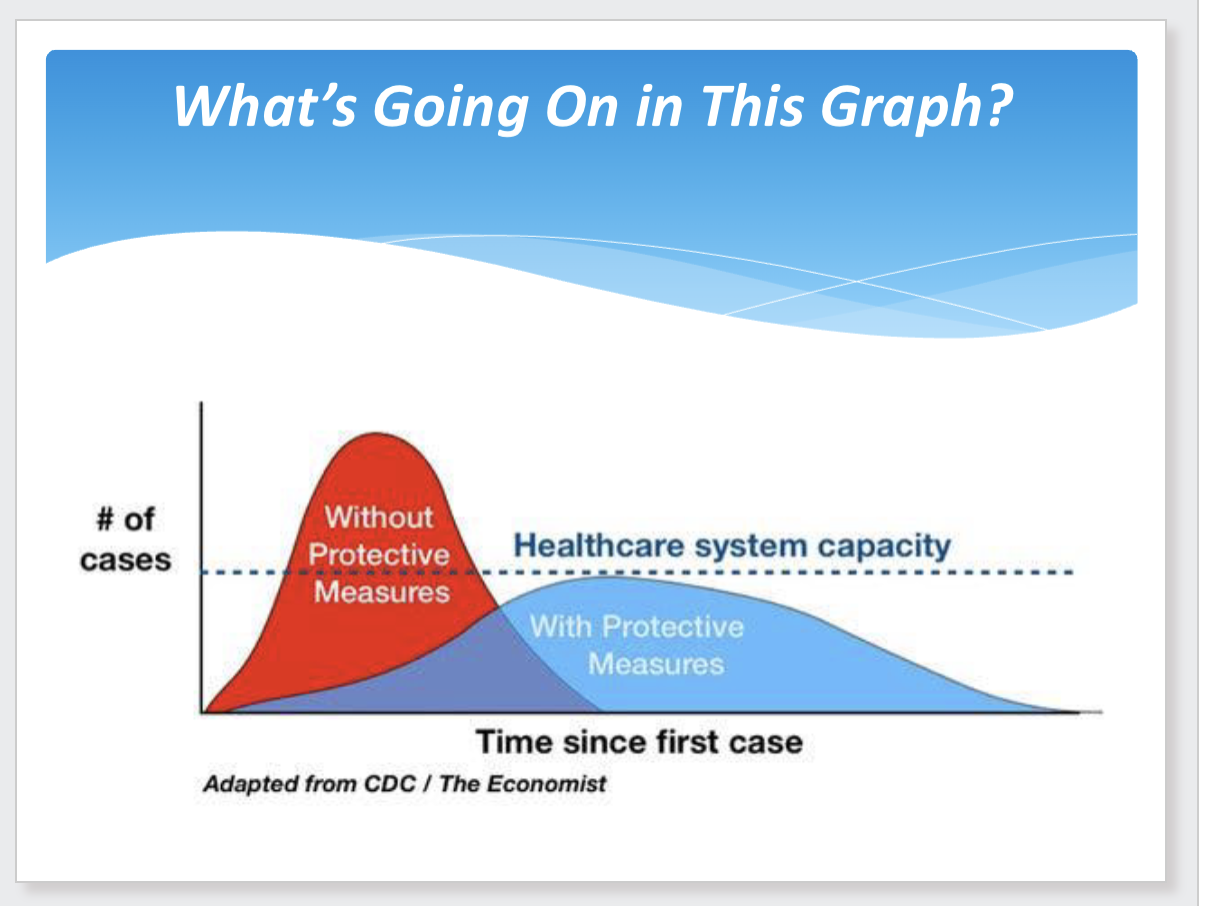
covid flattened the curve (?)