Ecology- Predation and Herbivory
1/17
There's no tags or description
Looks like no tags are added yet.
Name | Mastery | Learn | Test | Matching | Spaced | Call with Kai |
|---|
No analytics yet
Send a link to your students to track their progress
18 Terms
Predators and herbivores can limit the abundance of populations
Can be direct or indirect, artificial or natural
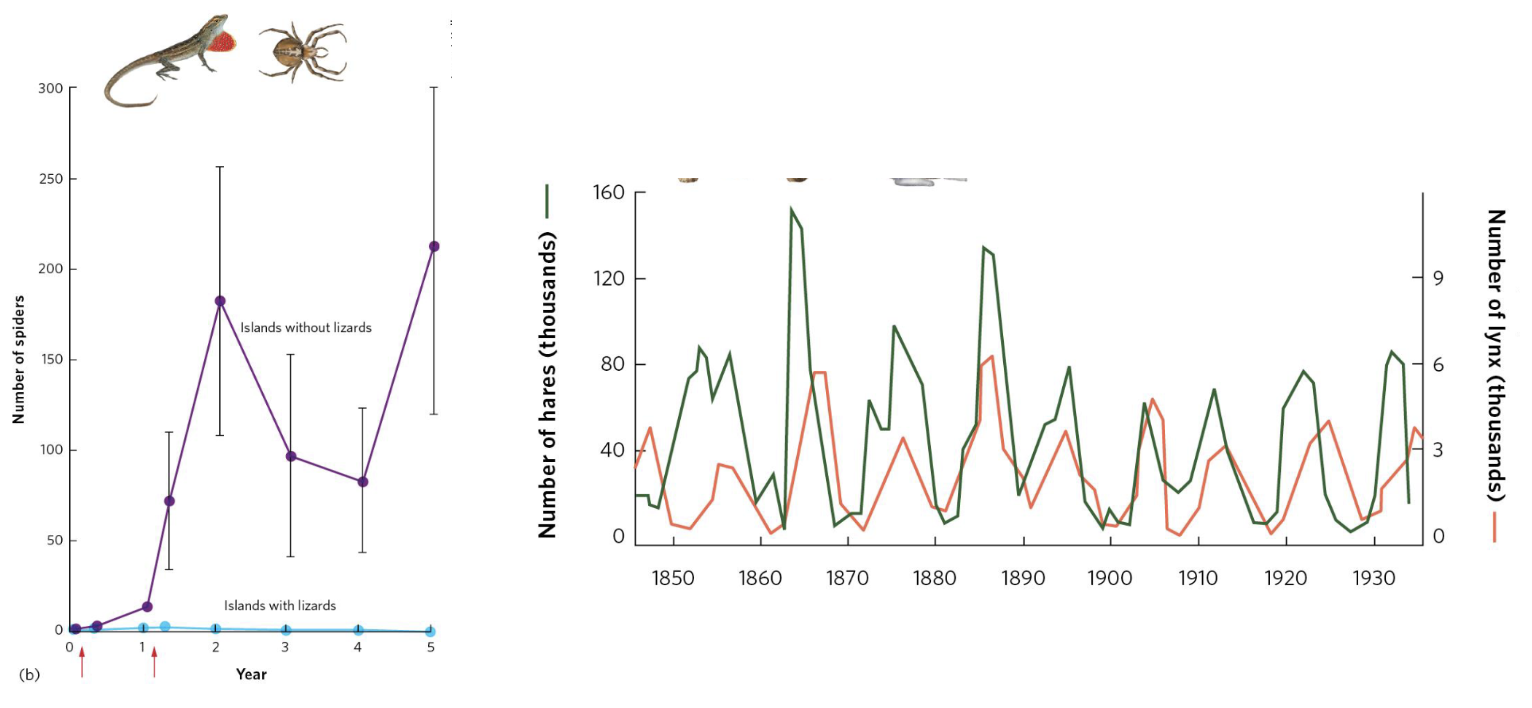
Ex. Lizard Predation on Spiders
Islands with predatory lizards had lower spider density
Islands without predatory lizard had much higher spider densities
Tested experimentally to verify this natural occurrence is caused by predation by lizards
Ex. Snowshoe Hares and Lynx
Major case study
Approximately 10 years cycles
Fluctuate closely- indication of predators impacting prey cycles very strongly
Biocontrol
Use biological agent to control another biological phenomenon
Commonly used for invasive species
Can backfire so must be done extremely carefully
Ex. Prickly Pear Cactus and Moths
Example of successful biocontrol
Brought in a moth that specialized in eating invasive prickly pear cactus
Ex. Brown Tree Snake and Poisoned Mice
Another example of successful biocontrol
Bring in prey species to control predator species
Created poison parachutes with dead baby mouse stuffed with acetaminophen (tylenol) to control invasive brown tree snake
Ex. Red Scale Insects and Parsitoid Wasps
Another successful biocontrol
Red scale insects are a nuisance that attach to citrus fruit trees
Parasitoid wasp introduced to control scale insects by laying eggs right underneath them and larva hatching and eating scale insects
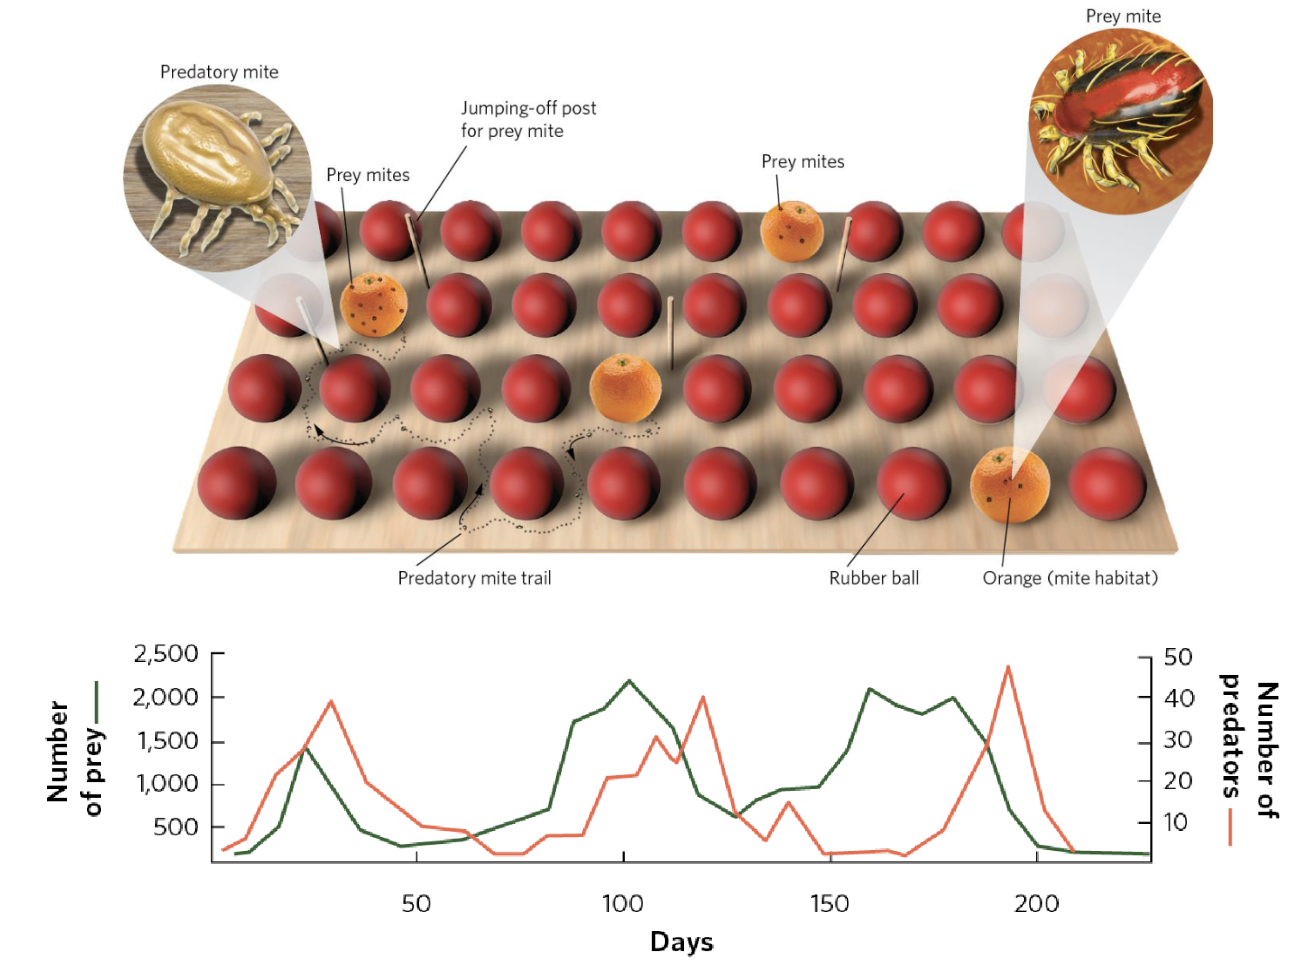
Huffaker’s Predator-Prey Lab Experiment
Initial set up:
Established populations of predator and prey mites on large trays that contained oranges and rubber balls
Varied the distribution on each tray
With this set up:
Without predators, prey population rapidly increased and leveled off
With predators, predator population rapidly increased and wiped out prey population, then predators went extinct without prey
Modified set up:
Vaseline- barrier to slow dispersal of walking predators
Vertical pegs- jumping- off points for prey to parachute off of prey and allowed prey to escape predators and find new orange to colonize
With modified set up:
Produced a series of 3 population cycles
Distribution of predators and prey throughout tray continually shifted over time
Created a metapopulation
Coevolution
2 or more species evolve in response to each other; can result in:
Behavioral Defenses
Structural Defenses
Crypsis/Camouflage
Chemical Defenses
Warning Coloration
Müllerian Mimicry
Batesian Mimicry
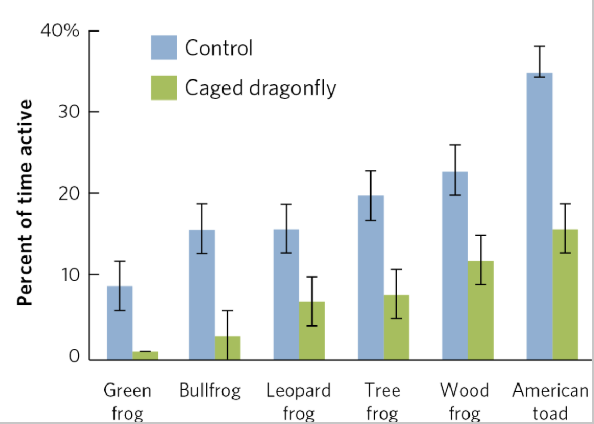
Behavioral Defenses
Ex. Dragonflies (predator) and Tadpoles (prey)
Control- tadpoles without dragonfly present
Dragonfly caged- unable to eat tadpoles, tadpoles knew dragonfly was present, tadpoles decreased activity
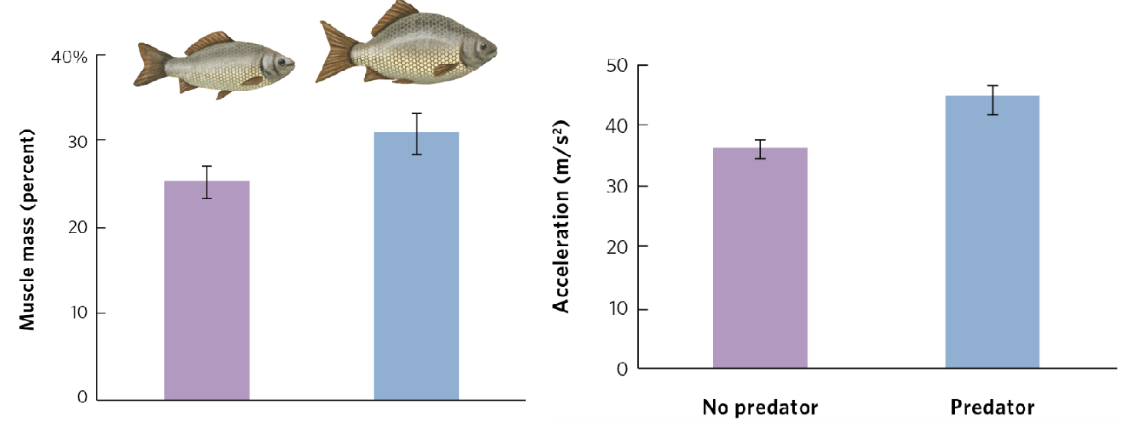
Structural Defenses
Ex. Carp
Grow larger with larger muscles to swim faster in the presence of predators
Gives them a higher chance to escape predation
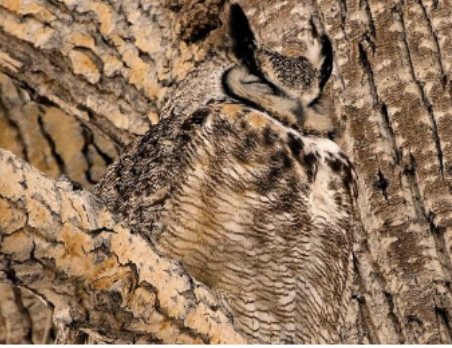
Crypsis/Camouflage
Both predators and prey do this
Ex. Owl
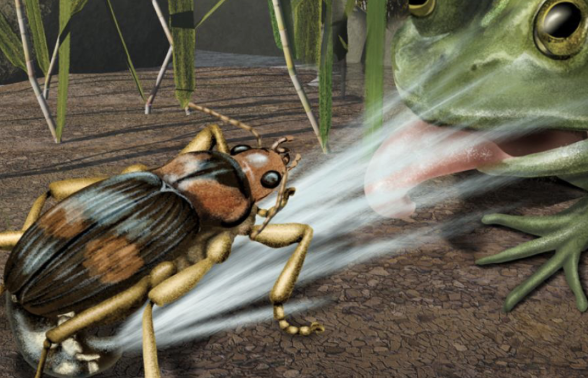
Chemical Defenses
Ex. Bombardier Beetle
Sets off an explosion that releases a boiling hot stinging acid
Can aim the spray
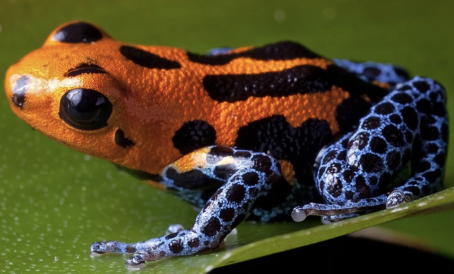
Warning Coloration
Strategy in which distastefulness evolves in association with very conspicuous colors and patterns
Also known as aposematism
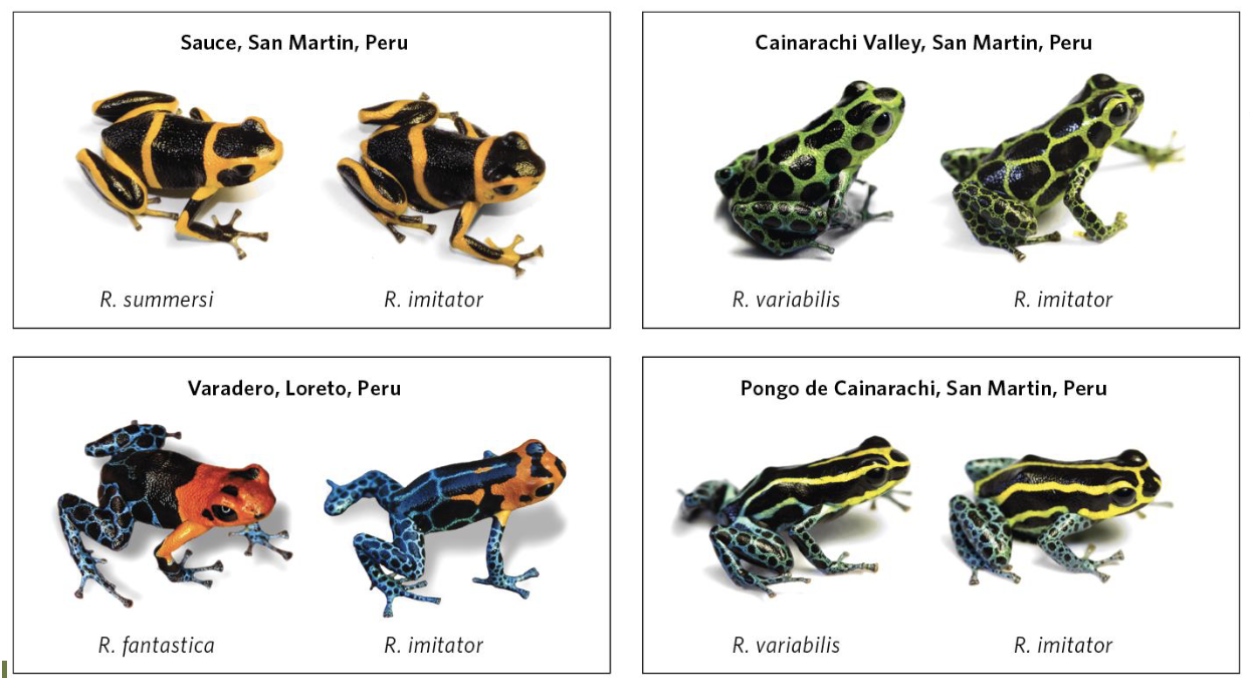
Müllerian Mimicry
When several unpalatable species evolve a similar pattern of warning coloration
All actually toxic
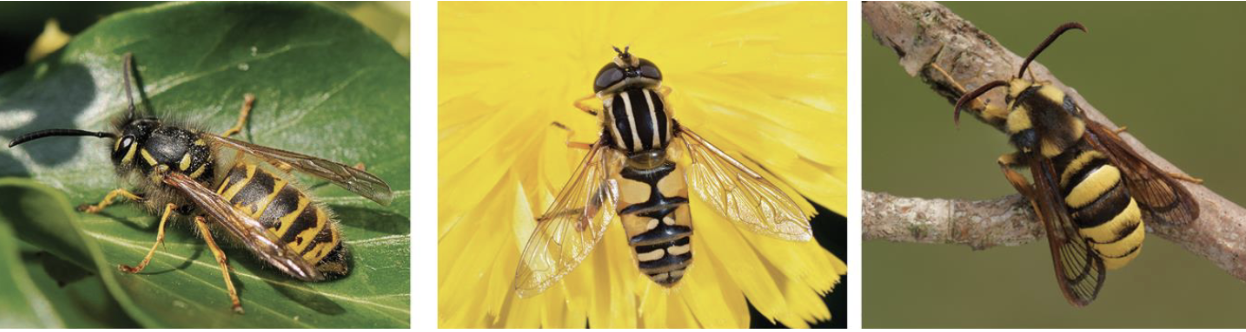
Batesian Mimicry
When palatable species evolve warning coloration that resembles unpalatable species
Not really toxic
Ex. Wasp (toxic), Fly (not toxic), Moth (not toxic)
Lotka-Volterra Model
Model of predator-prey interactions that incorporates oscillations in the abundances of predator and prey populations and shows predator numbers lagging behind those of their prey
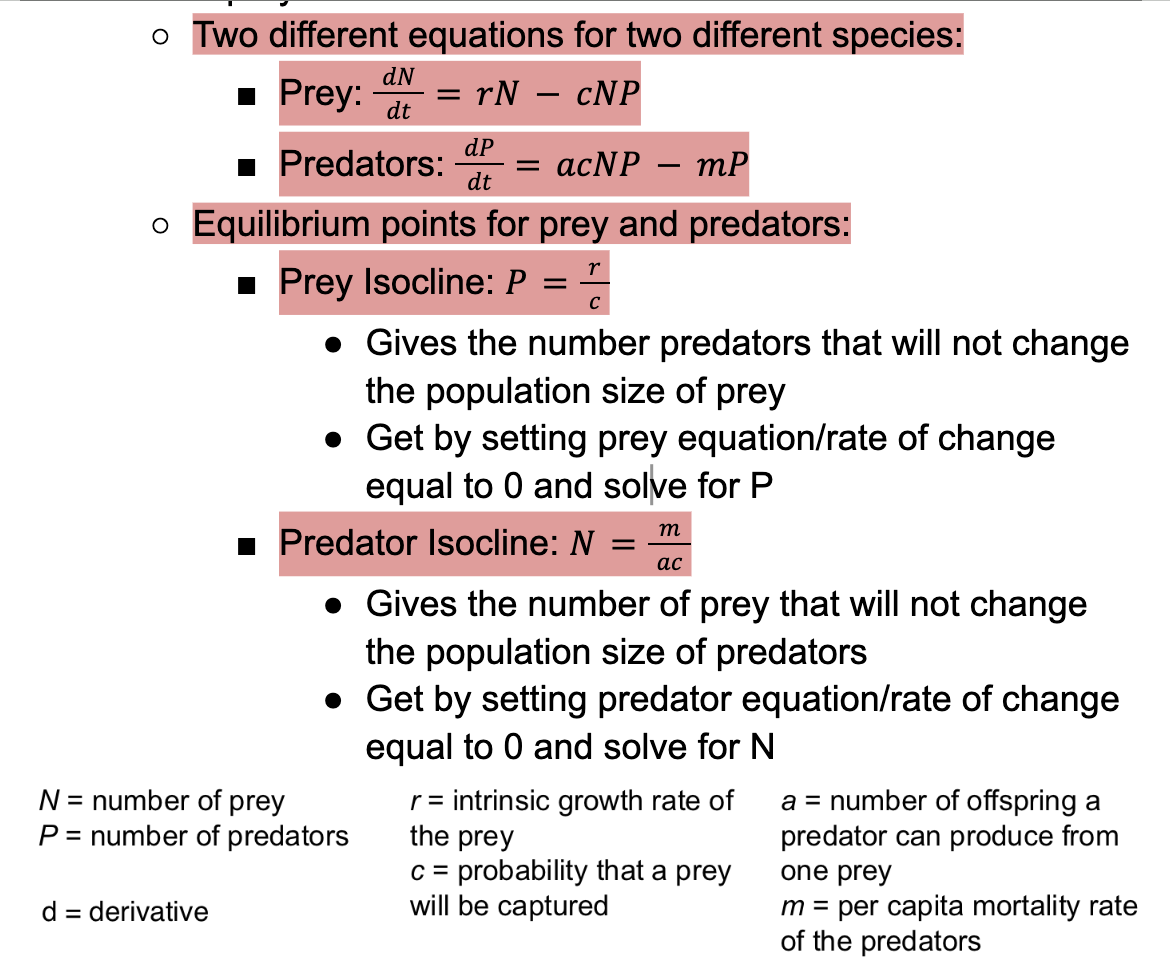
Isocline Trends
Want to reach equilibrium/isocline
Above isocline = pop decreasing
Below isoline = pop increasing
Have to pay attention to both species
Both increasing?
Both decreasing?
One increasing and other decreasing?
Correspond with population trajectories
Dotted line = isocline
Highlighted portions correspond with isocline trends
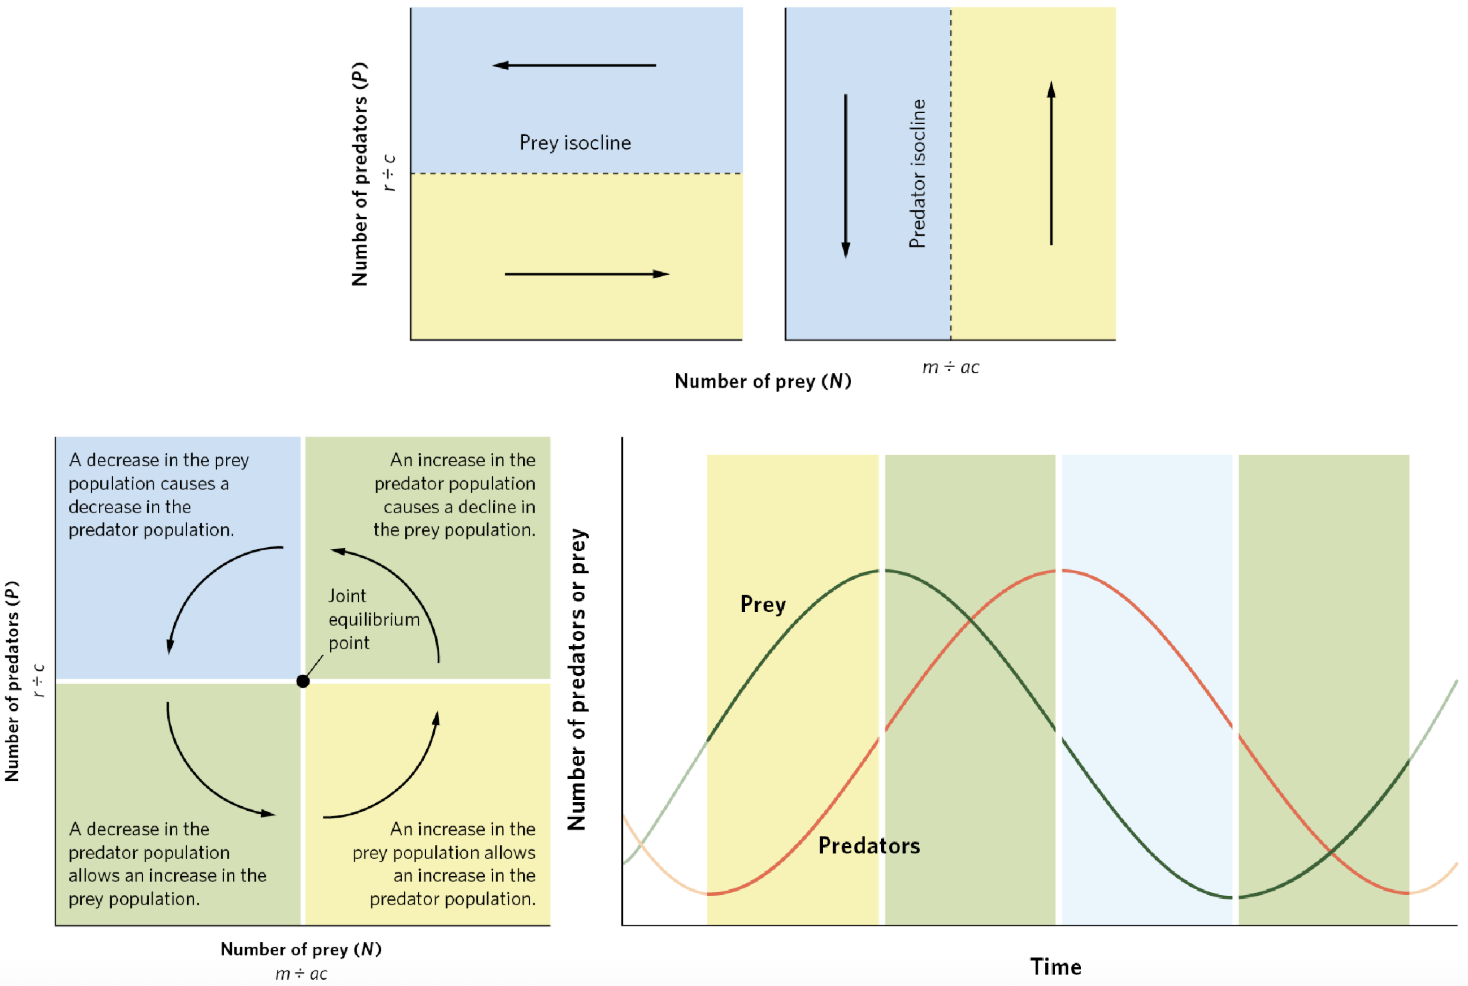
Functional Response
Relationship between the density of the prey population and an individual predator’s rate of food consumption

Type I Functional Response
Predator’s rate of prey consumption increases in a linear fashion with an increase in prey density until satiation occurs
Type II Functional Response
Predator’s rate of prey consumption begins to slow down as prey density increases and then plateaus when satiation occurs

Type III Functional Response
Predator exhibits low prey consumption under low prey densities, rapid prey consumption under moderate prey densities, and slowing prey consumption under high prey densities

Numerical Response
Change in the number of predators through population growth or population movement due to immigration or emigration