test 4 ch 53 bio2
1/19
There's no tags or description
Looks like no tags are added yet.
Name | Mastery | Learn | Test | Matching | Spaced | Call with Kai |
|---|
No analytics yet
Send a link to your students to track their progress
20 Terms
Explain how a population's per-generation growth rate can be calculated using the net reproductive rate (R0)
Calculating Per-Generation Growth Rate Using
The net reproductive rate, , is a key concept in population ecology used to calculate the per-generation growth rate of a population. It represents the average number of offspring that an individual is expected to produce over its lifetime. Here's how it works:
R0 > 1: The population is growing because each individual, on average, produces more than one offspring.
R0 = 1: The population size remains stable as each individual replaces itself.
R0 <1: The population is declining since individuals are not replacing themselves.
To calculate the per-generation growth rate using , you simply observe whether indicates growth, stability, or decline. This measure helps ecologists predict future changes in population size and structure based on current reproductive patterns.
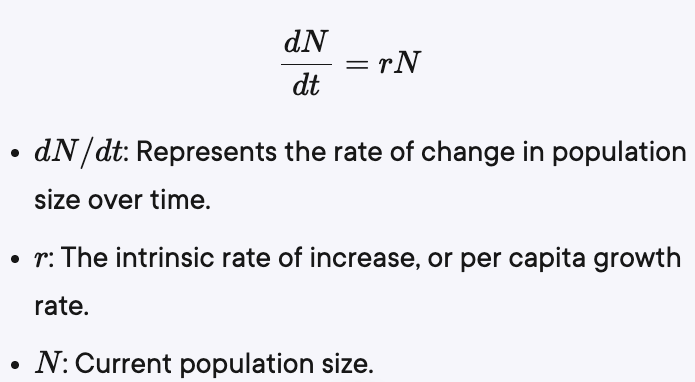
Explain how the growth of populations over time can be predicted using the per capita growth rate r
The growth of populations over time can be predicted using the per capita growth rate, r . In exponential growth, populations increase in size by a constant proportion at each instant. This results in a J-shaped curve when population size is plotted over time.
Equation:
Growth Dynamics:
A higher r leads to faster population growth.
Larger populations add more individuals over time due to more reproducing members
exponential growth
This model assumes unlimited resources, leading to a constant per capita growth rate. The population size increases rapidly without any constraints, depicted by a J-shaped curve.
logistic growth
In reality, resources are limited. The logistic model incorporates carrying capacity (K), the maximum population size an environment can sustain. As the population nears K, growth slows and eventually stabilizes, forming an S-shaped curve.
resource limitation impacts
As resources dwindle, individuals face competition, reducing birth rates and increasing death rates.
This limitation causes the growth rate to decrease as the population approaches its carrying capacity.
Density-Dependent Processes
Density-dependent processes regulate population size by increasing death rates or decreasing birth rates as population density rises
key mechanisms of density dependent processes
competition for resources, disease, predation, territoriality, intrinsic factors and toxic wastes
density independent processes and population size
Density-independent processes affect population size regardless of the population's density. These factors typically involve environmental conditions that impact a population uniformly, such as natural disasters or climate changes.
Species can be categorized based on their life history strategies into two types:
r-selected and K-selected
r-selected species
Thrive in environments with low population densities.
Exhibit high reproductive rates to maximize the intrinsic rate of increase ().
Often found in disturbed habitats, such as weeds in abandoned fields.
Produce many offspring with little parental investment.
🧠 Super simple summary:
👉 “Have lots of babies, grow fast, don’t take care of them, and live in changing places.”
k-selected species
Adapted to environments near carrying capacity (), where resources are limited.
Focus on traits that enhance survival at high densities, like large seeds or extensive parental care.
Examples include mature trees in old-growth forests and primates with few offspring but significant parental care.
🧠 Super simple summary:
👉 “Have a few babies, take great care of them, and live in crowded, stable places.”
Predict future population growth of a specific human population based on age structure and total fertility rate
To predict future population growth, you need to consider both the age structure and the total fertility rate (TFR) of the population.
Age Structure: This refers to the distribution of individuals across different age groups within a population. A bottom-heavy age structure, with many young individuals, suggests potential for continued growth as these individuals reach reproductive age. Conversely, a top-heavy structure indicates a potential decline due to fewer young people entering reproductive age.
Total Fertility Rate (TFR): This is the average number of children born per woman over her lifetime. A TFR above the replacement level of approximately 2.1 children per woman leads to population growth, while a TFR below this level can lead to population decline unless offset by immigration.
✅ Example (simple):
Lots of kids + high TFR → 🚀 BIG growth
Few kids + low TFR → 📉 population goes down
“Look at how many young people there are and how many babies people have to guess the future population.”
describe how the ecological footprint of a human population influences
the earth's carrying capacity for humans
The ecological footprint of a human population significantly influences Earth's carrying capacity for humans. The ecological footprint measures the land and water area required to produce the resources consumed and absorb the waste generated by a person, city, or nation. This concept helps assess how close we are to Earth's carrying capacity.
Key points include:
Resource Consumption: A larger ecological footprint indicates higher resource consumption per person, which can reduce Earth's ability to support more people sustainably.
Global Variations: Different regions have varying footprints. For example, individuals in developed countries like the United States consume significantly more resources than those in developing regions.
Sustainability Concerns: With over 7.9 billion people globally, many resources are used unsustainably, impacting future generations' ability to meet their needs.
population
A group of individuals of the same species living in a particular area.
carrying capacity
(K): The maximum population size that an environment can sustain due to resource limitations like food, shelter, and water.
exponential population growth
A growth model where the population increases rapidly without any constraints, assuming unlimited resources
logistic population growth
Describes how a population grows more slowly as it nears its carrying capacity. The growth rate decreases as resources become limited.
per capita growth rate
(r): The average contribution of each individual to the total population growth rate
net reproductive rate
The average number of offspring that an individual is expected to produce over its lifetime
ecological footprint
A measure of human demand on Earth's ecosystems; it represents the amount of land required to sustain their use of natural resources.