Chapter 5 - POPULATION DYNAMICS
1/36
There's no tags or description
Looks like no tags are added yet.
Name | Mastery | Learn | Test | Matching | Spaced | Call with Kai |
|---|
No analytics yet
Send a link to your students to track their progress
37 Terms
carrying capacity.
As a population grows within an area, it may experience effects from its increased density. In a given area, the maximum population size of the species that the environment can sustain is called the carrying capacity. Carrying capacity is determined by the amount of available resources (e.g. food, habitat, water). As the density of individuals in a population increases, these individuals within the same species begin competing with each other (i.e. intraspecific competition) or with other species (i.e. interspecific competition) for the available resources. If the population keeps growing, progressively fewer resources will be available to sustain it. This process, in which per capita population growth changes when population density changes, is known as density dependence.
Population dynamics
efers to the ecological (biotic and abiotic) interactions that lead to fluctuations in population size. It includes how populations of a species change in size and structure over time
The abundance of a species is
the abundance of a species is a specific measure of a population’s size or density in an ecosystem. For example, the abundance of birds living on the edge of the lower south-west karri forests in WA decreased as logging of timber increased. Abundance is not solely a measure of the number of individuals; it includes specifically where in the habitat they live, breed or hunt
population density,
the number of that species per unit area (population size divided by total land area). Population size can be measured or estimated if the organism is easily observed and is slow moving or stationary. Sometimes it is difficult to distinguish individual plants, as with grass. In that case, density is measured as the amount of biomass (dry) per unit area (e.g. 0.6 kg of grass per square metre). In the case of diatoms in a pond, density is the number of organisms per unit volume (e.g. 300 per millilitre).
r-selection
. This pattern of rapid increase, where the maximum reproductive potential of the species is reached, then the population declines (or crashes) in numbers, is called r-selection. As the environmental resources diminish, the numbers drop off just as rapidly as they grew and these species are replaced by competitors. To survive, these so-called r-selected species must colonise new environments quickly, and be able to reproduce rapidly and in relatively large numbers. The species in this group are characterised by being of smaller size, having short life cycles and, in animals, a lack of parental care for young. Examples of r-selected species include mice, toads, weeds, oysters and locusts.
A traditional method of classifying populations is
by reference to r-selected and K-selected species.
Populations in stable environments
In stable ecosystems, slow and steady life strategies are more successful. Over time, larger, longerlived species such as elephants, whales, gorillas, oak trees and eucalypts outcompete the smaller, faster-growing species. Such species have a steadier population growth pattern and can exist in numbers close to the carrying capacity of their environment. For example, the female red kangaroo is able to manage the number of young that are born at any one time. At times when water and food are plentiful, the female may have up to three young at various stages of development: an older joey that spends most of its time outside the pouch and is no longer reliant on the mother for nourishment, a young joey that is firmly attached to a nipple in the pouch while it completes development, and a third embryo whose development and birth have been suspended until there is room in the pouch. If food or other requirements for life become scarce at any stage, the female can abandon any one of the three. Without her protection, it will almost certainly perish. This may seem a harsh reality; however, this reproductive strategy means that a sustainable population size is maintained. This strategy is defined as K-selection, and over the long term it offers stability to the ecosystem and equilibrium to its populations. K-selected species live longer, breed later in life, have fewer offspring and devote time and effort to ensuring the survival of the offspring to reproductive maturity.
Populations
re dynamic because they change in size and structure over time. Unstable environments favour r-selected species, which grow and reproduce quickly; whereas stable environments favour K-selected species, which are larger and slower-growing
Abundance
Abundance is the number of organisms per unit area which live in a particular part of an ecosystem. Abundance can be measured as either population size or density, and knowing the abundance can help determine population distribution. Total abundance refers to the total number of organisms in an area. Measures such as these are helpful when planning for conservation strategies, and when making decisions about fragmentation and wildlife corridors
population composition
population composition can also be measured; this term includes the characteristics of a population, such as age, sex ratios, age structure (the number of organisms for each age group), population fertility rate and average number of offspring per female.
‘Rate’
refers to the number of individuals being added or subtracted, per 100 or per 1000 present in the population per unit time (usually per year).
Birth rate
s usually given as the number of births per 1000 of a population over a given time, often using units of number of births per 1000 per year.
death rate
refers to the number of deaths per 1000 (usually) of a population over a given time, often in units of number of deaths per 1000 per year.
. The immigration rate refers to
the number of organisms, per 1000, that enter a population over a given period. The emigration rate refers to the number of organisms, per 1000, that exit a population over a given period.
Calculating population growth rate

Sustainability
Sustainability means ensuring that overfishing does not drain the stocks, and that young (smaller) fish are able to contribute to the populations in the future. Information about population composition can be used to plan how to ensure sufficient young live to reach reproductive age, how to develop strategies for protecting endangered species and maintaining ecosystems, and how to restore degraded ones.
Random distribution
organisms are spaced irregularly; the location of one organism does not affect the location of another (this is more common for plants than for animals).
Uniform (continuous) distribution:
organisms are evenly spaced; the presence of one organism determines how close or distant another will be. This is common in relatively high-density populations of some animals that set up breeding territories.
Clumped (grouped) distribution
a number of individuals are grouped together and the groups 10 20 30 40 50 make up the population as a whole. This sometimes results from social behaviour (e.g., schools of fish), or the occurrence of mini-habitats, where biotic and/or abiotic factors are favourable (e.g., clumping of vegetation).
What does knowing the distribution do
Knowing the distribution and abundance of a species can help ecologists keep track of populations of significance.
quadrat
For organisms that are fixed or do not move very much, the quadrat method of sampling can be used to estimate distribution and abundance. A quadrat is a square, rectangular or circular frame, the size of which is determined according to the organism being studied. It is used for measuring at ground level. It is most often used when measuring plant density because plants are stationary. It is also a relevant method for recording sedentary marine species that may be exposed along shorelines as the tide varies. Quadrat counts can be used to calculate the density of a population. If sufficient quadrats are chosen, and they are representative of the area under study, results can be used to estimate total population size. For each quadrat, the number of individuals of each species is counted and recorded, or percentage cover is estimated. Refer to Chapter 1 (pages 20–1) for the calculation method. After the individuals in each quadrat are counted or estimated, the totals are averaged. A simple mathematical calculation can give the total number or percentage cover for each species in the whole area. The density can also be calculated.
Estimating population size and density
transect
A transect (‘trans’ means across, ‘sect’ means section) is a line drawn through a community. Information is gathered from along the line and used to estimate the distribution of species within that community. Again, this is a useful method with species that are immobile, such as plants and fungi. To improve the data collected, quadrats may also be placed at intervals along the transect line and thus data on density in specific locations may also be recorded.
Capture–mark–recapture
The capture–mark–recapture method (often shortened to capture–recapture) is commonly used to estimate the size of a population of a mobile species.
Capture–mark–recapture
Step 1 – Capture: animals are caught randomly (without being hurt). Small animals are trapped in cages or pitfalls in the ground, birds are trapped in fine nets and some animals are caught easily when they ‘freeze’ in spotlights. Flying insects are attracted to light traps.
Step 2 – Mark (tag) and release: each captured animal is marked so it is not obvious to predators or harmful to the organism. Insects are usually marked with a blob of paint, whereas birds are marked on the leg or wing. The animals are then returned to their habitat.
Step 3 – Recapture: a random sample is taken from the whole population and the number of marked individuals in it is counted. The timing of recapture needs to allow for the capture of a random mixture of individuals, but without leaving it so long that many of the original marked individuals have died. From this information the total population can be estimated. The procedure has to be planned carefully so that the chances of each individual being caught are equal. Sometimes ‘trap happy’ individuals will be sampled over and over.
Species distribution modelling
is a more recent technology that is also used to obtain data for conservation, and is particularly useful in studies examining the impact of climate change on populations, which is increasingly causing concern for the wellbeing of many species.
Carrying capacity
The carrying capacity is the maximum size of a population that an ecosystem can support with its limited resources. Carrying capacities can be affected by changes to abiotic and biotic factors.
What can determine the carrying capacity
Biotic and abiotic factors can be limiting for population growth and what determines the carrying capacity.
These factors include:
• availability of resources such as water, food, sunlight, shelter (such as fallen logs) and percentage of oxygen in water (aquatic ecosystems)
• predation
• disease. The carrying capacity of an ecosystem can change from time to time as environmental conditions change. In theory, a population will grow until limiting factors hinder its growth.
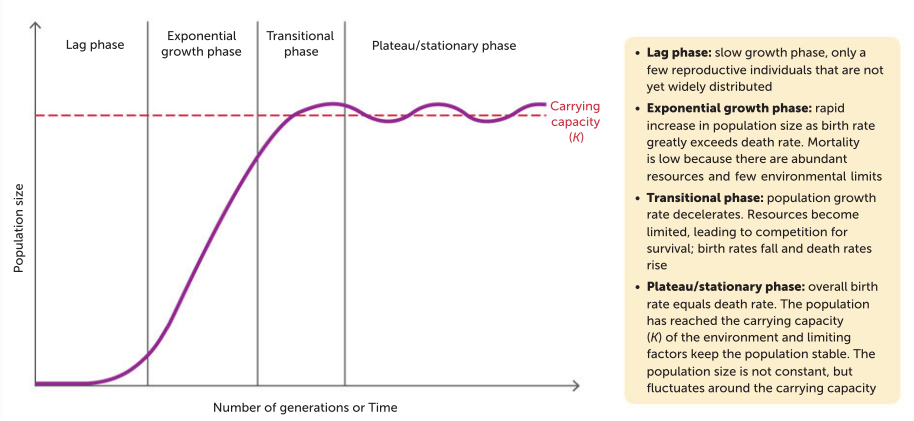
Limiting Factors
Limiting factors can be any resource or environmental condition that limits the growth, abundance or distribution of the population. The greater the density of a population, the more individuals die or fail to reproduce
Density-dependent factors
are often biotic and include, for example, predation, interspecific and intraspecific competition, and the spread of diseases. These factors only come into play when the population reaches a certain level. The larger the population, the stronger the impact.
Density-independent factors
are those that affect all individuals in a population regardless of how dense the population is; for example, severe weather conditions, volcanic activity or habitat destruction by clearing or fire. Such factors are seen following a catastrophic event such as a bushfire or flooding. Some extreme weather conditions are increasing in frequency, such as flooding and drought, due to climate change. The chance of individuals surviving the impact of densityindependent factors is the same independent of the population density or size.
Population dynamics
refers to the ecological (biotic and abiotic) interactions that lead to fluctuations in a population size. It includes how populations of a species change in size and structure over time
Abundance
The abundance of a species is a measure of a populations size or density in a particular duration
K-selected species
Kangaroos
elephants
whales
gorillas
oak trees
stable
r-selected
frogs, rats, weeds
unstable
Emigration
refers to a decrease in population due to migration of individuals