ECON10001 sem 2
1/144
There's no tags or description
Looks like no tags are added yet.
Name | Mastery | Learn | Test | Matching | Spaced | Call with Kai |
|---|
No analytics yet
Send a link to your students to track their progress
145 Terms
gross domestic product (GDP)
measure of aggregate output, measured by:
total spending on domestic products
total domestic income
total domestic production (measured as value added)
→ only counts final goods not intermediate goods (inputs to production)
nominal gdp
sum of the quantities of final goods produced times their current price
real gdp
sum of the quantities of final goods times constant(not current) prices. measured changes in output without impact of price fluctuations.
nominal gdp x (base year price index/ current year price)
business cycle
alternating periods of positive and negative growth rates
recession
period when output is declining or below its normal level
unemployment (U)
the number of people who don’t have a job but are looking for one
unemployment rate (u)
the proportion of workers in the economy who aren’t employed and are looking for a job
u=U/L
L(labour force)
Okun’s law and coefficient
a strong and stable relationship between unemployment and GDP growth
Okun’s coefficient = degree of correlation
eg. y = -0.005x+ 1.17
changes in rate of GDP growth are negatively correlated with the unemployment rate
inflation (deflation)
a sustained rise (decline) in the general level of prices
inflation rate
the rate at which the price level increases
gdp deflator
the average price of output (final goods produced)
ratio of nominal gdp to real gdp in year t
consumer price index (CPI)
the average price of consumption (cost of living). a fixed basket of goods and services is chosen to reflect the spending of a typical household in the economy
πt= (CPIt - CPI (t-1))/ CPI (t-1)
steps to calculate cpi:
fix the consumption basket
find the prices
compute the basket’s cost
choose a base year and compute the index
eg. for base year 1 CPI2/CPI1 × 100
phillips curve
an inverse relationship between the rate of inflation and the rate of unemployment
consumption c
goods and services purchased by consumers
investment (I)
the sum of nonresidential investment (purchase of new machines, equipment, buildings by firms) and of residential investment (purchase of new houses/apartments by people) inventories (not the purchase of financial assets)
government spending G
government expenditure on goods and services
net exports (trade balance)
exports (x) minus imports (m)
demand for goods equation
z=C+I+G+X-IM
z is aggregate demand, consumption c is a function of disposable income Yd
autonomous consumption (Co)
the fixed amount one will spend, independent of income
disposable income Yd
income that remains once consumers have received government transfers and paid their taxes
consumption function
C = C0 + C1Yd
= C0 + C1(Y-T)
where c1 is the propensity to consume
credit constraints
limited availability to borrow, leads to a decrease in consumption when income lowers
endogenous variables
variables depend on other variables in the model (like C)
exogenous variables
variables not explained within the model but are instead taken as given
equilibrium in the goods market equation
Y=Z
Z= Co + C1(Y-T) + I + G
Y*= 1/(1-C1) [ Co-C1T + I + G]
the multiplier effect
1/(1-C1) the total change in output can be greater than the initial change in aggregate demand
equilibrium output
level of output at which production equals demand. output equals autonomous spending times the multiplier
private saving (saving by consumers)
equal to their disposable income minus their consumption
S=Yd-C = Y-T-C
public saving
taxes minus government saving, corresponds to budget surplus/deficit for pos/neg public saving
IS relation
equilibrium for the goods market in which what firms want to invest must be equal to what people and the government want to save
production =demand and Investment = saving
paradox of thrift (saving)
the aggregate attempt to increase savings leads to lower income in the short run (lower output)
fallacy of composition
what is true for one part of the economy (a single household) is not true of the whole economy
money
a medium of exchange used to purchase goods or services, allows purchasing power to be transferred among people
fiat money
no intrinsic value (like gold or silver) but currency is backed and issued by the government
bonds
a security that promises to pay a fixed amount of money at specific intervals
wealth
stock of things owned or value of that stock
income
the amount of money one receives over some period of time from market earnings
saving
disposable income that isn’t consumed
investment
expenditure on newly produced capital goods
money demand
the amount of money people want to hold, sum of all individual demands for money by people and firms in the economy
depends positively on the level of transactions in the economy and negatively on the interest rate
Md= $Y L(i)
Md(money demand) $Y(level of transactions) L(i) (decreasing function of the interest rate)
interest rate
determined by the equality of the supply of money and demand for money
increase in supply of money lowers the interest rate
given the money supply, increase in nominal income raises interest rates
expansionary open market operation
the central bank expands the supply of money by buying bonds (price of bonds up, interest rates down)
contractionary open market operation
the central bank contracts the supply of money by selling bonds (price of bonds down, interest rates up)
central bank money
the liabilities of the central bank are the money it has issued, held as currency by the public or reserves by banks
equilibrium interest rate is such that demand=supply for central bank money
financial intermediaries
institutions that receive funds from people and firms and use these funds to buy assets or to make loans to other people and firms
banks
financial intermediaries that have money, in the form of checkable deposits, as their liabilities
→ the central bank is the only bank that can create legal tender (print money)
LM relation
M/P = YL(i)
→ follows from the financial market equilibrium
i=i bar
real money supply equals the real money demand, which depends on real income Y, and the interest rate i
L (liquidity preference M^d) equals M (money supply)
→ horizontal curve as central bank chooses the interest rate
IS relation equation
Y = C(Y-T) + I(Y,i) + G
Y=C(Y-T) +I(Y, r + x) + G
where r = real interest rate (i-π^e) and x is risk premium
fiscal policy
implemented by government through taxes
monetary policy
implemented by central bank through interest rates
policy mix
both government and central bank working to affect market
expansionary fiscal policy
policy tool: government spending up, taxes decrease
policy effect: right shift of IS curve → increases equilibrium output and interest rate
contractionary monetary policy
policy tool: interest rate decreased → investment increases AD/Y output increases
policy effect: downward shift of LM curve → higher output level
zero lower bound
the interest rate cannot go below zero
liquidity trap
interest rate is down to zero and monetary policy cannot decrease it further
wage determination
higher skills needed to do the job, the more likely there is to be bargaining between employers and individual employees depending on
cost for firm to find other workers
difficulty for workers to find another job if they were to leave
collective bargaining
bargaining between a union(or set of unions) and a firm (or set of firms)
aggregate nominal wage W depends on
W=P^e F(u,z)
expected price level P^e
unemployment rate u
catch all variable z
price determination
prices set by firms determine the real wage paid by firms yet, depends on their costs, in turn depending on the nature of the production function
production function
Y=AN
Y~ output
N~ employment
A~ labour productivity (output per worker)
reservation wage
the wage that would make them indifferent between working or being unemployed
natural rate of unemployment
the unemployment rate such that real wage chosen in wage setting is equal to the real wage implied by price setting
wage setting relation
the higher the unemployment rate (u) the lower the real wage (W/P)
wage-setting
wages are set unilaterally by firms or by bargaining between workers and firms
→ depends negatively on the unemployment rate and positively on the expected price level
price-setting
prices set by firms depends on the wage and on the markup of prices over wages
→ a higher markup implies a higher price given the wage, and thus a lower real wage
expected inflation
given expected inflation, higher unemployment leads to lower inflation
when inflation isn’t persistent, expected inflation doesn’t depend on past inflation
given unemployment, higher expected inflation leads to higher inflation
natural level of employment equation
Nn=L(1-un)
L labour foce
un natural rate
natural level of output/ potential output equation
Yn = L(1-un)
L labour force
un natural rate
output gap (definition and 3 options)
the difference between output and potential output
=0 if unemployment equals the natural rate and output=potential
<0 if unemployment is above the natural rate and output is below potential
>0 if unemployment is below the natural rate and output is above potential
medium-run output and inflation
over the medium run, the economy converges to the natural level of output and stable inflation
→ output = potential so there is no longer any pressure on inflation
natural rate of interest
interest rate rn associated with Yn (natural level of/potential output)
deflation spiral
if the zero lower bound prevents monetary policy from increasing output back to potential, the result may be a deflation spiral
more deflation leads to a higher real policy rate, and the higher policy rate in turn leads to lower output and more inflation
stagflation
lower output is associated with higher inflation
GDP growth
steady increase in output over time
aggregate production function
Y=F(K,N)
Y/N=F(K/N , 1)=f (K,N)
Y is output
K is capital
N is labour
function f depends on the state of technology
→ assuming inputs don’t change in short/ medium run
properties of aggregate production function
output per worker (Y/N=F(K/N, 1)) is an increasing function of capital per worker (K/N)
concave due to decreasing returns to capital/ labour
capital stock cannot sustain economic growth in the long run due to the decreasing returns → requires technological innovation
relationship between investment It and output Yt for capital stock
I= private saving = s . Y
as Y increases, I increases so K increases (higher level of capital stock), leading to higher output which increases Y
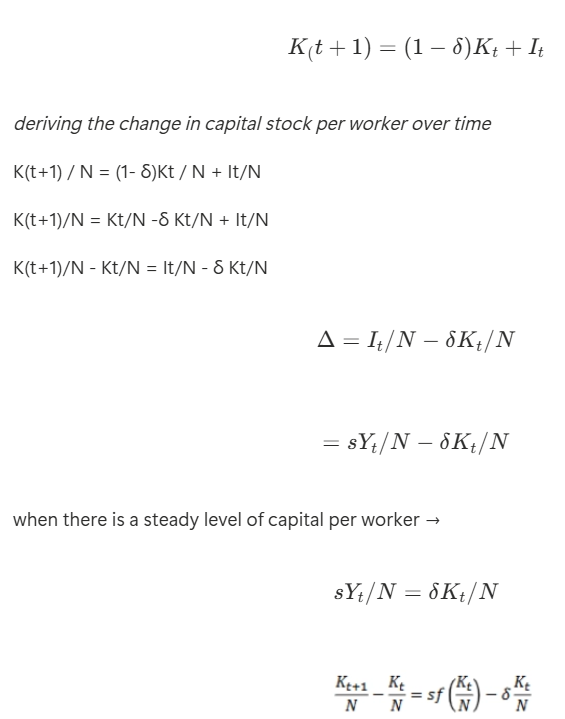
deriving the change in capital stock per worker over time
steady state of the economy
state in which output per worker and capital per worker are no longer changing
the amount of saving per worker is sufficient to cover depreciation of the capital stock per worker
change in capital per worker = 0
steady state in the long run economy
gradually in the long-run the economy will converge to a steady state, to a constant level of capital and output per worker
the saving rate has no effect on the long-run growth rate of output per worker, which is equal to zero
the saving rate determines the level of output per worker in the long run
K*/N=f(s,δ)
change in capital per worker equation
Investment per worker [Investment during year t]:
the level of capital per worker this year determines the output per worker this year. given the saving rate, output per worker determines amount of saving per worker and thus investment per worker this year
Depreciation per worker[depreciation during year t]: the capital stock per worker determines the amount of depreciation per worker this year
![<p><strong>Investment per worker [</strong>Investment during year <em>t]:</em></p><p><em>the level of capital per worker this year determines the output per worker this year. given the saving rate, output per worker determines amount of saving per worker and thus investment per worker this year</em></p><p><strong><em>Depreciation per worker[</em></strong>depreciation during year <em>t</em>]: the capital stock per worker determines the amount of depreciation per worker this year</p>](https://assets.knowt.com/user-attachments/362d8d6f-a71a-4881-b2f4-2526c755842a.png)
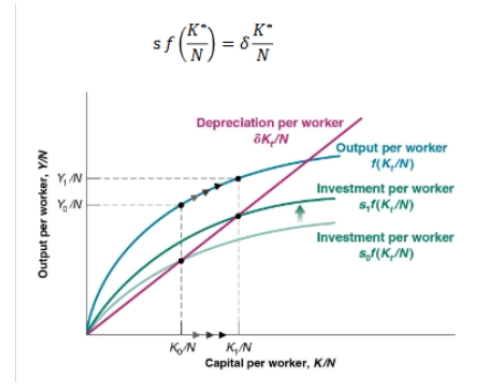
steady-state value of capital per worker (K*/N) equation
s f (K*/N) = δ K*/N
amount of saving per worker (left) is sufficient to cover depreciation of the capital stock per worker (right)
steady-state value of output per worker (Y*/N) equation
Y*/N = f (K*/N)
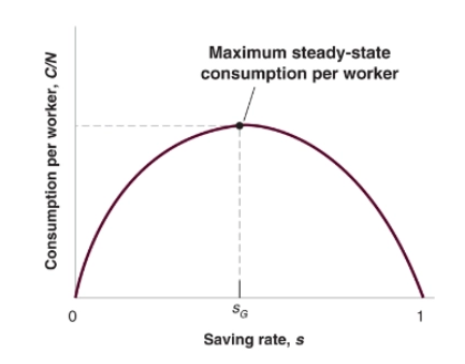
golden-rule level of capital
the level of capital associated with the value of the saving rate that yields the highest level of consumption in steady state
human capital (H):
the set of skills of the workers in the economy built through education and on-the-job training
the production function with human capital
Y=F( K, H, N)
Y/N = f (K/N, H,N)
determinants of growth in output:
steady state growth in output per worker depends on variables such as the saving rate and the rate of spending on education, even without technological progress
however, given the rate of technological progress, higher rates of saving or spending on education don’t lead to a permanently higher growth rate
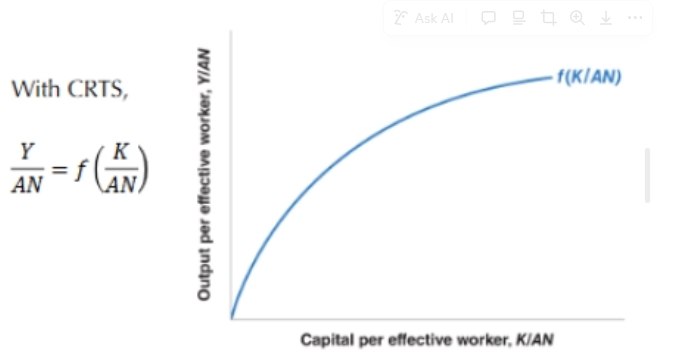
capital, technology on the aggregate production function:
Y=F (K, AN) = F(K, N, A) = A . F(K, N)
Y is output
K is capital
N is labour
A is the state of technology
AN is effective labour
state of technology (A)
a variable that tells us how much output can be produced from given amounts of capital and labour at any time
technological progress can lead to:
larger quantities of output for given quantities of capital and labour
better products
new products
a large variety of products
- reduces the number of workers needed to produce a given amount of output. doubling A produces the same quantity of output with only half the original number of workers N
-increases the output that can be produced within a given number of workers
graph of output per effective worker against capital per effective worker
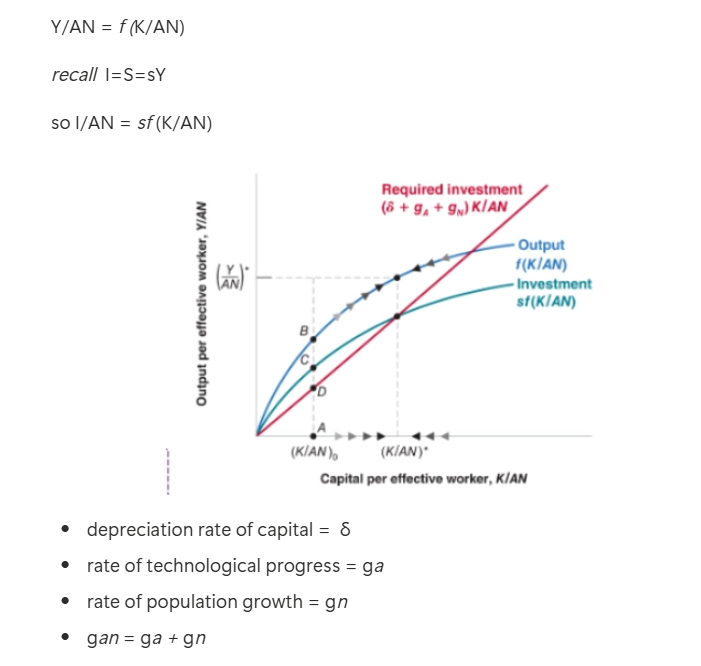
the level investment needed to maintain a given level of capital per effective worker:
to make capital stock constant, we used to require investment/ saving to be sufficiently high to cover depreciation
now both N and A change over time. to make capital/ output per effective worker (K/AN or Y/AN) constant, we need capital/ output to grow at the same speed as effective labour AN
therefore: 𝐼 = 𝛿𝐾 + (𝑔a+𝑔n)𝐾 = (𝛿 + 𝑔a + 𝑔n)𝐾
capital and output on the balanced growth path(steady state):
capital per effective worker and output per effective worker are constant
capital per worker and output per worker are growing at the rate of technological progress (ga)
capital and output are growing at a rate equal to the sum of population growth and the rate of technological progress (gn+ga)
g K/AN= g Y/AN = 0
gy=gk=gan = ga+gn as K and Y grow at the same rate
g y/n = gy-gn = ga + gn-gn = ga growth rate of both matches that of technological innovation
determinants of technological progress
→ most technological progress is the outcome of firms’ research and development (R&D) activities
→ the level of R&D spending depends on:
the fertility of research (how R&D spending translates into new ideas and new products)
the appropriability of research results (the extent to which firms can benefit from R&D)
→ patents
→ growth by innovation vs. growth by imitation: to sustain growth, advanced countries that are at the technology frontier must innovate
→ investors can act as monopolies and have access to supernormal profits
→ observing high technological innovation corresponds to high output
patents
give a firm that has discovered a new product the right to exclude anyone else from the production or use of that new product for some time
effective labour (AN)
if the state of technology A doubles, it is as if the economy had twice as many workers
output per effective worker vs. capital per effective worker
because of decreasing returns to capital, increases in capital per effective worker lead to smaller and smaller increases in output per effective worker
→ increase in the saving rate leads to higher growth until the economy reaches its new, higher, balanced growth path
balanced growth
in steady-state, output and the two inputs (capital and effective labour) grow ‘in balance’ at the same rate
capital per effective worker and output per effective worker are constant:
capital per worker and output per worker are growing at the rate of technological progress
labour is growing at the rate of population growth: capital and output are growing at a rate equal to the sum of population growth and the rate of technological progress
institutions
is a set of laws and informal rules that regulate social interactions among people, and between people and the biosphere
→ the quality of a country’s institutions matters greatly for its long-run economic development