research methods
1/174
There's no tags or description
Looks like no tags are added yet.
Name | Mastery | Learn | Test | Matching | Spaced | Call with Kai |
|---|
No analytics yet
Send a link to your students to track their progress
175 Terms
explain lab experiments
controlled conditions
manipulates iv
measures dv
evaluate lab experiments
strength:
(1) high degree of control over extraneous variables → high internal validity
limitations:
(1) lacks external validity - artificial nature of environment - low ecological validity
(2) demand characteristics
explain field experiments
natural conditions
manipulates iv
measures dv
evaluate field experiments
strength:
(1) ecological validity as it is representative of everyday behaviours → ack of demand characteristics
limitations:
(1) less control over extraneous variables- can distort validity
(2) ethical issues: ppts can’t give consent beforehand
→ cost benefit analysis needed
explain natural experiments
natural conditions
naturally occurring iv (unemployment, earthquakes, tsunamis)
measures dv
evaluate natural experiments
strength:
(1) high ecological validity - real life situations being studied so no demand characteristics
(2) allows us to test unethical things we couldn’t otherwise
limitations:
(1) no control over environment or extraneous variables - confounding variables affect result
(2) can’t replicate usually because of ethical concerns and they don’t happen often or in the same way, so hard to generalise
explain quasi experiments
controlled or natural conditions
iv is the difference between people (e.g. gender, age, iq)
measures dv
evaluate quasi experiments
strength:
(1) allows researchers to compare different types of people
limitations:
(1) can’t randomly allocate to remove bias
(2) when done in controlled conditions, demand characteristics and low ecological validity
(3) when done in natural conditions, no control over extraneous variables
what are the 3 experimental designs?
(pilot studies)
repeated measures
independent groups
matched pairs
what are pilot studies?
small scale study done in advance to see problems such as:
experimental design- enough time?
instructions- are they clear?
measuring equipment- categories and questions are checked and modified
makes sure money isn’t being wasted
still represents target population despite being smaller
explain repeated measures
ppts take part in each condition
data is compared to see difference
evaluate repeated measures
strength:
(1) fewer ppts required so it is less expensive and time consuming
→ can repeat it with extra ppts if they want to have more data(2) reduces possibility of ppt variables like individual differences
→ more proof effect on dv is due to iv
limitations:
(1) order effects can occur.
practice effects where they perform better
fatigue might happen when they do worse cause they give up
→ counterpoint: counterbalancing(2) demand characteristics
guessing aim of study and acting to help research or screw you effect
explain independent groups
2 separate groups of ppts- do one condition each
ppts are randomly allocated to ensure there’s no investigator effects and individual differences are reduced
evaluate independent groups
strength:
(1) avoids order effects as they only do one condition so they’re less likely to get bored or get better at the task
(2) reduces demand characteristics as they are only taking part in one condition so they’re less likely to guess the aim
limitations:
(1) more ppts required = more expensive and time consuming to get correct people
(2) more likely to be affected with ppt variables → e.g. age, sex, backgrounds, iq
explain matched pairs
pairs matched based on key variable like age or iq
one of them does one and the other does the other
evaluate matched pairs
strength:
(1) reduces ppt variables as they’re matched on similar characteristic
(2) order effects are less of an issue as they only do one condition
→ less likely to get bored or improve
limitations:
(1) more time consuming and expensive as more ppts are required as it is hard to find close pairs
(2) there will still be differences → e.g. 2 60 year olds but one might have high iq and one might have low iq
what is sampling?
selecting ppts from target population since target population is too large to study in entirety
what are the 5 types of sampling
random sampling
systematic sampling
stratified sampling
opportunity sampling
volunteer sampling
explain random sampling
every member has equal chance of being selected
identifies everyone in target pop and either pulls name from hat or uses computer to generate name without bias
evaluate random sampling
strength:
(1) free from researcher bias as they don’t have any input on who is chosen
→ reduces chance of biased sample
limitations:
(1) difficult and time consuming to ensure everyone has an equal chance of being chosen
(2) some ppts might not want to take part
explain systematic sampling
predetermined system to select ppts
→ e.g. every nth person is chosen
→ 5th, 10th, 15th, 20th
go down register/list to do this
evaluate systematic sampling
strength:
(1) free from researcher bias since they aren’t selected by choice
→ reduces chance of biased sample
limitations:
(1) every nth person might have a particular characteristic
→ unlikely but possible. generalisation could be difficult(2) some ppts might not want to take part
explain stratified sampling
subgroups within population are identified
they are chosen in proportion to their occurrence in population
→ e.g. if class had 12 males and 8 female, sample would be 6 males and 4 females
evaluate stratified sampling
strength:
(1) free from researcher bias as sample is generated randomly once subgroup has been identified
→ likely to be representative of sample as it is selected in sync
limitations:
(1) difficult and time consuming to identify correctly → expensive
(2) subgroup can’t reflect other individual differences → hard to represent proper sample
explain opportunity sampling
selecting anyone who is available and willing to take part
→ e.g. student on free period
evaluate opportunity sampling
strength:
(1) convenient as it is quicker and easier so it will save money → most economical
limitations:
(1) bias- as sample is drawn from specific area or location (e.g. university)
so only student will be available → not representative of target pop
increased risk of research bias as they control who they approach
explain volunteer sampling
ppts self select to take part by volunteering when asked or responding to an ADVERT
evaluate volunteer sampling
strength:
(1) convient as there is minimal effort which makes it quicker, easier and cheaper
limitations:
(1) bias- particular type of person who see the advert and come forward
→ e.g. more curious and less shy volunteers so not representative of population
name the 6 ethical guidelines
can do, can’t do with ppts
consent
deception
confidentiality
debrief
withdraw
protection from harm
explain consent and how to ensure it
ppts need to give fully informed consent which means aims should be clear before agreeing to ppts
this means ppts shouldn’t agree to something that goes against their wishes
→ no coercionfixed by:
prior general consent
ppts agree to take part in investigation but might involve deception
→ consent to be deceivedchildren as ppts:
parents give consent for those under 18retrospective consent:
give consent afterwards if they didn’t know investigation took place
explain deception and how to fix it
when info is kept from ppt or they are purposefully misled
prevents fully informed consent
fixed by:
debriefing true aim and research of nature and be allowed to withdraw results
explain confidentiality and how to fix it
ppts personal information is protected by law
this is to prevent their data and details being used against their wishes
fixed by:
ppts give full name, number and initials to protect their identities
undefineable by anyone or institutional or organisation
explain debrief
must be given all info after experiment if any was withheld
ppts should be given contact details for any further questions
explain withdrawal and how to fix it
ppts have right to withdraw themselves or data at any time
even after research is conducted → must destroy all data
prevent them any stress
fixed by:
at the end of the study, they should be reminded they can remove their data and told this at the beginning
explain protection from harm and how to fix it
have responsibility to protect from physical or psychological harm (stress or embarassment)
risk of harm should be no higher than everyday life
if they are harmed, they may suffer long term
should enter and exit in same state
fixed by:
reminding ppts they can withdraw whenever
terminate experiment if harm is higher than expected
should be debriefed and referred to counselling if necessary
name 4 types of variables that need to be controlled
extraneous variables
any variable other than iv that can affect dv than the resultsconfounding variables
evs which are important enough to change dvsituational variables
temperature, lighting, time of day
→ controlled through standardisationppt variables
age, gender, intellegence, culture
→ controlled through experimental design like matched pairs, random allocation
how can randomisation present bias?
trials are presented in a random order
explain demand characteristics and how to fix
when ppt tries to make sense of the research and change behaviour accordingly
→ support or ‘screw you’ effectcontrolled by:
single blind - only researcher knows true aim
→ e.g. placebo used
explain researcher bias
conciously or unconsciously act in a way to support hypothesis
can be an issue when observing events when interpretation is needed
→ e.g. children playing roughly as violencecontrolled by:
not allowing ppts or researcher to know aim or identity to known iv
→ double blind
only person who designed experiment knows
name the 6 types of observations
covert
overt
ppt
non-ppt
naturalistic
controlled
name 2 types of sampling methods for observations
time sampling
event sampling
explain covert observations
undisclosed observations (nobody knows)
e.g. one way mirror (convert non-ppt) or joining group as member (covert ppt)
informed after it took place
evaluate covert observations
strengths:
investigator effects are less likely as researcher isn’t present
→ less chance of impacting behaviourless likely to have demand characteristics
weaknesses:
ethical issues- can’t give fully informed consent or withdraw
evaluate overt observations
strengths:
investigator effects are less likely as researcher isn’t present
→ less chance of impacting behaviourless likely to have demand characteristics
weaknesses:
ethical issues- can’t give fully informed consent or withdraw
explain covert observations
open and ppts are aware they’re taking part
e.g. filming publicly (overt non-ppt) or joining a class and informing students you’re observing (overt ppt)
evaluate ppt observations
strengths:
ethical as they can consent
weaknesses:
investigator effects
demand characteristics
explain ppt observations
person conducting observation also takes part in the activity being observed
member quietly observing others withiut their knowledge (covert ppt)
or zimbardo (overt ppt)
evaluate non-ppt observations
strengths:
in depth data- close proximity to ppts allows them to gain unique insights
→ unlikely to overlook behaviour that would be missed by non-ppt
weaknesses:
investigator effects
demand characteristics
explain non-ppt observations
person conducting observation doesn’t ppt
→ e.g. observer sits in back of room and watches lesson
evaluate non-ppt observations
strengths:
investigator effects are less likely as researcher isn’t present
→ less chance of impacting behaviourless likely to have demand characteristics
weaknesses:
may miss behaviours of interest as they aren’t close enough
explain naturalistic observations
done in unaltered setting where observer doesn’t interfere at all
→ e.g. shopping centre
evaluate naturalistic observations
strengths:
higher ecological validity - research records naturally occuring behaviour in normal environment
→ representetive of spontaneous actions
weaknesses:
reliability issues- exact conditions can’t be replicated
→ retest method can’t be done since researcher can’t control variables
explain controlled observations
under strict conditions- extraneous variables are controlled
standardised : time, noise, temp, etc
most commonly overt
evaluate controlled observations
strengths:
replicability due to controlled variables
weaknesses:
external validity- behaviour may not fit real life or change - demand characteristics
explain time sampling
records behaviour at pre-decided intervals - e.g. every 10 seconds
evaluate time sampling
strengths:
better use of time since fewer observations are made
weaknesses:
not every behaviour wanting to be studied will occur in those frames
explain event sampling
observer records number of times target behaviour occurs
evaluate event sampling
strengths:
every behaviour (in theory) will be counted
weaknesses:
some behaviours may be missed if too much is happening
explain behavioural categories
list of target behaviours to be studied- need to be operationalised (defined and observable)
e.g. target behaviour is affection → hugging, kissing, holding hands
list all ways it could potentially occur
no inferences allowed
name 2 types of self report techniques
questionarres
→ open and closedinterviews
→ structured and unstructured
explain open questions
allows ppt to answer however they want → qualitative data
“what did you think of this shop’s service”
evaluate open questions
strengths:
less researcher bias as can answer without in put from researcher
weaknesses:
social desireability bias
explain closed questions
restricts ppts to predetermined responses → quantiative data
→ on a scale of 1-10 please rate your experiencecan be done in:
checklists
likert response scalr (strongly agree to strongly disagree)
ranking scale
evaluate closed questions
strengths:
easy to analyse and compare groups/individuals - allows to look for patterns
weaknesses:
researcher can’t pursuit responses any further
forced choice- may not completely agree
response bias- ppt might not take time and select random answers
explain questionaire design
keep terminology simple and clear
keep as short as possible
be sensitive- avoid personal questions
no leading questions
explain structured interviews
decided on questions in advance and asked in exactly the same order each time
interview schedule used and record by taking notes
evaluate structured interviews
strengths:
easier to analyse since it’s quantiative data and allows direct comparisons to be made
standardised to easy to replicate
weaknesses:
investigator effects- may conciously or unconciously influence results → e.g. body lanaguage, tone of voice
explain unstructured interviews
more like conversation than a set of questions
very little is decided on in advance except topic
lots of qualitative data
recorded not written down
more relaxed
evaluate unstructured interviews
strengths:
reduces researcher bias as they aren’t controlling conversation
ppt is just talking so demand characteristics aren’t as common
qualitative data so interviewer can gain more info
weaknesses:
more time consuming as it requires trained psychologist
hard to compare data
explain the 2 functions of peer review
research read each other’s research to keep in touch with new ways of thinking
might be able to improve or disprove a theory
knowledge is able to growstudies which are to be published need to be criticised so poor quality research doesn’t go to public domain
universities gain funding on quality of previous research
explain the process of peer review
researcher submits paper to journal
editor sends it to other experts in the same field who review it critically
experts make recommendation about quality of work
researcher makes changes and then submits again
what are limitations of peer review
status quo
science is conservative and resistant to large changes in opinion (paradigm shift)reviewer bias
reviewer may hold opposing view
although it should be anonymous it can be used to settle scores
may favour research from friends or collegeuesinstitution bias
research from prestigious unis is favouredgender bias
male researchers are preferred
explain how to write aims
always have research quesrion
aim always start with ‘to examine the effect of…’
what are ivs?
what changes
what are dvs?
what is measured
explain case studies
detailed analysis of one individual or real life event
→ experimental or non-experimental methidsoften used where behaviour is rare
→ too unique for larger studystarting point for further research → e.g. tan led to understanding of broca’s area
name 2 strengths of case studies
rich detailed info about situation and unique circumstances
circumstances that are not ethical to study otherwise like 9/11
name 2 limitations of case studies
methodological issues- difficult to generalise any findings to wider popular since results are likely unique
→ external validity is lowinvestigator bias- too subjective
→ e.g. little hans, freud used leading questions
→ no scientific or experimental evidence to support freud and so lacks validity
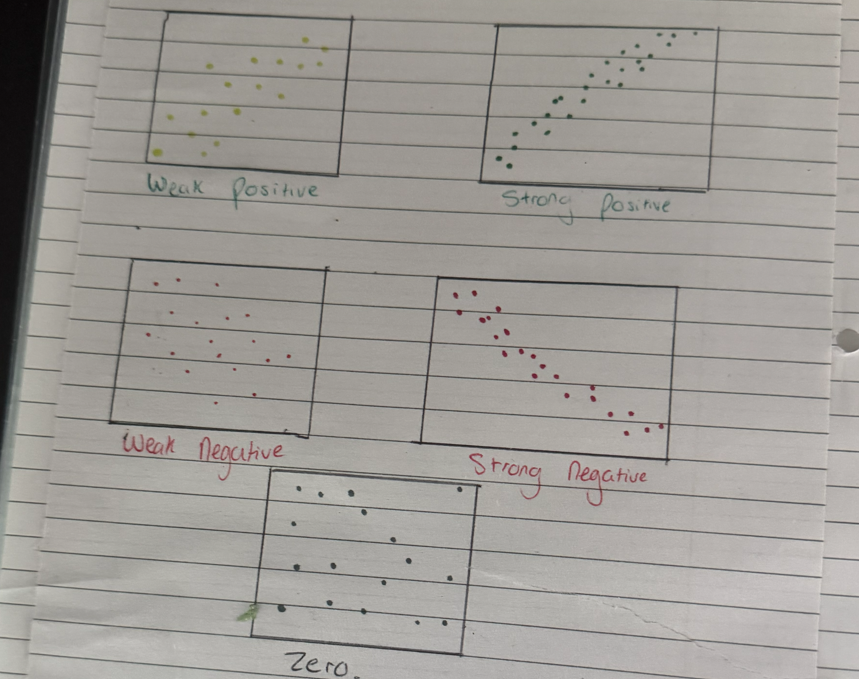
what are correlations?
non-experimental methods used to measure how strong relationship is between 2 or more variables
leads to further studies to see if one variable is affecting each other
→ e.g. cigarette smoking and lung cancer
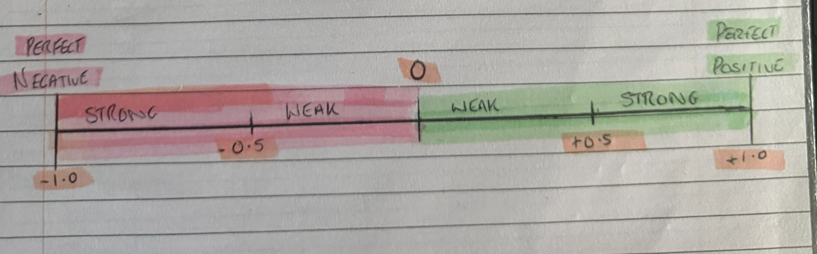
explain positive correlations
as one variable increases, the other does too
e.g. height and shoe size
explain negative correlations
as one variable increases the other decreases
e.g. time spent studying and amount of errors made on test
explain negative correlations
no relationship between variables
rainfull and number of people who watched harry potter
what do scattergrams for correlations look like?
name 2 strengths of correlations
correlational studies provide basis for further research
ethical as informed consent isn’t necessary as info is public
→ e.g. gov reports
name a limitation of correlations
not possible to establish cause and effect → cannot conclude for sure one variable caused the increase/decrease of another of diff variables
what is meant by descriptive statistics?
when quantiative data has been collected and needs to be summarised so reader can understand without going thru lots of results
evaluate the mean
strength: considers all data
weakness: sensitive because any extreme scores can skew results
evaluate median
strengths: not easily distorted by extreme results so best for heavily skewed results
easy to calcuate
weaknesses: doesn’t reflect all scores in data set
evaluate mode
strength: not distorted by extreme results
can be used for categorical data
weaknesses: can be multi-modal or have no mode at all so not always useful
name 3 measures of central tendency
mean
median
mode
name 2 measures of dispersion
range
standard deviation
evaluate range
strengths: easy to calculate
weaknesses: doesn’t indicate distribution pattern across data
uses most extreme results so may not be representtive
evaluate standard deviation
strength: precise measurement because all values are included
weakness: extremes can distort
how do you calculate percentages
number of ppts improved by revising/ number of ppts x 100
(12/20 × 100)
bottom number is always total number
how to calculate % increase?
new number-original number = increase
15 - 12= 3
increase/original x 100
3 / 12 × 100 =25
how to calculate % decrease?
original number - new number = decrease
20-14=6
decrease/original x 100= % decrease
6 / 20 × 100= 30%
what is primary data?
data collected for the research
→ e.g. reporting directly to researcher or through first hand observations
evaluate primary data
strength: collected with purpose of that research so had high level of control and info is relevant
weakness: designing, sampling, carrying out study takes a lot of time and effort so is more expensive
explain secondary data
info carried out with purpose other than that specific research
→ e.g. consensus or statistics abt mental health from nhs