Lecture 5: Social and/or Intergenerational Mobility
1/36
There's no tags or description
Looks like no tags are added yet.
Name | Mastery | Learn | Test | Matching | Spaced | Call with Kai |
|---|
No analytics yet
Send a link to your students to track their progress
37 Terms
What is social mobility and why is it important?
Measures how much children’s outcomes are related to those of their parents
Can affect individuals’ level of effort and increase productivity due to motivation for a better life → w/o it, inequality cannot change → people cannot escape their background
Education (cornerstone of meritocracy) → way to escape your upbringing → but education may just be function of your upbringing
What is the link between parents’ income and child’s education?
Socio-economic background (can be measured using parents’ occupation, receipt of benefits, family income etc.) has largest effect on educational achievement
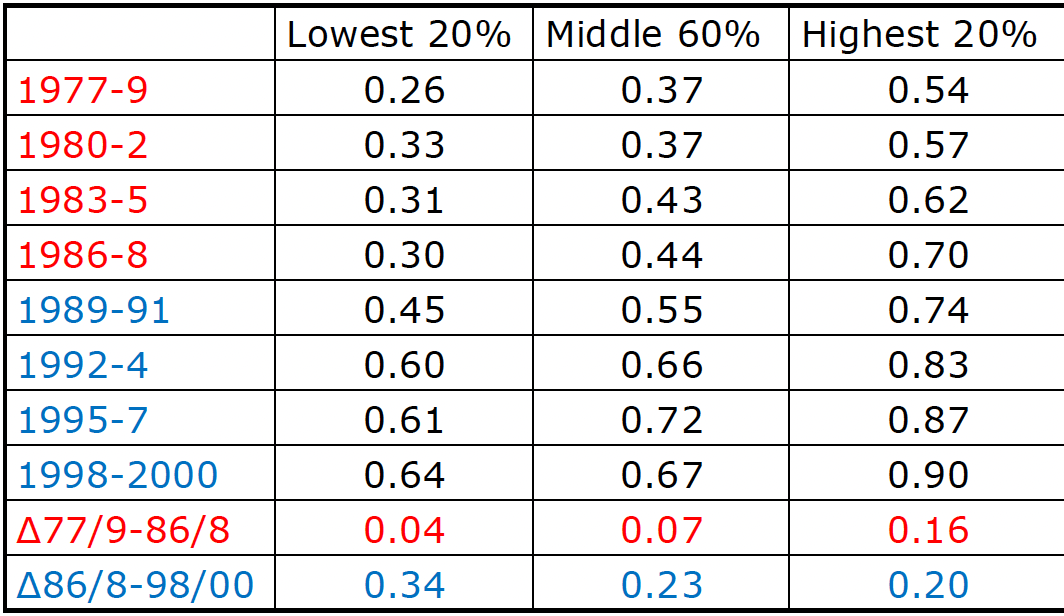
From Machin and Vignoles (2005), what is the relationship between income and staying-on in education at age 16?
As parents’ income rises → longer you stay in school for every group
Over time, probability of not dropping out increases
1980s - highest 20% of income earners experienced the greatest income gain
1990s - lowest 20% of income earners experienced the greatest income gain
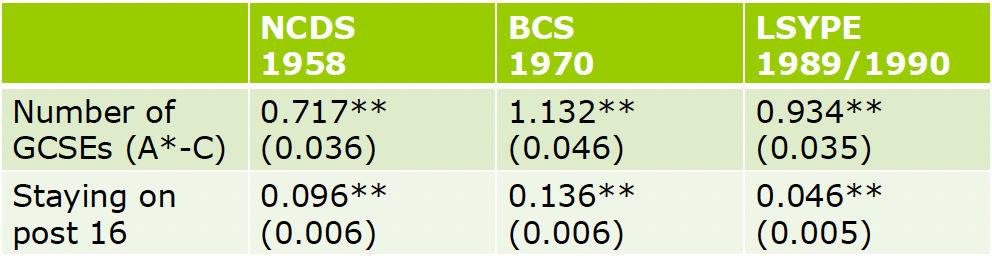
From Gregg and Macmillian (2010), what does this regression for intergenerational income effects show?
Coefficient for doubling of family income where dependent variable is variable in left-hand column
Changes in coefficients between columns → all statistically significant
As family income doubles → no. of GCSEs a child obtains increases by 1, on average
As family income doubles → likelihood of staying on for NCDS respondents increases by 9.6%
If relationship between family income and education is getting weaker → suggests increase in intergenerational mobility
Thus, importance of income for age 16 outcomes is falling recently → possibly due to grade inflation (everyone doing better regardless of background)
So had to consider whether findings due to changes in underlying ability/literacy & numeracy skills (at age 10/11) → since no grade inflation in these measures
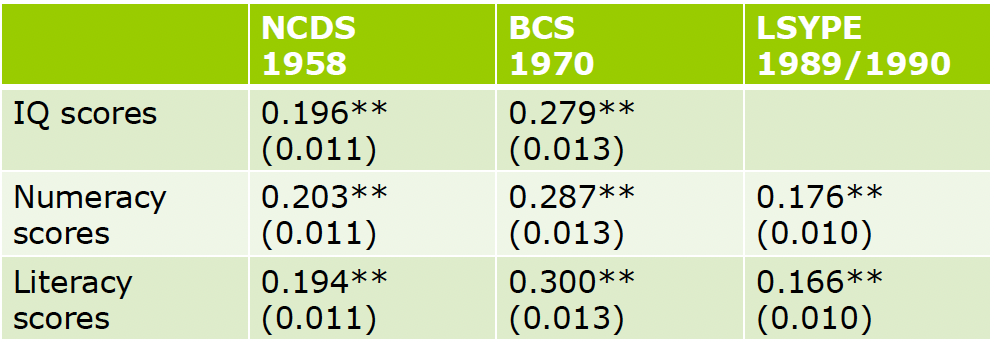
From Gregg and Macmillan (2010), what does this table on IQ, numeracy and literacy scores show?
Coefficient on family income variable where dependent variable is variable in left-hand column
Changes in coefficients between columns → all statistically significant
100% increase in family income → increases test scores by about 20% for NCDS kids, about 30% for BCS kids and around 17% for LSYPE kids
Thus, family income explains less of the test score outcomes for those born in 1989/90 → intergenerational mobility has improved
Seems to be real relative improvement for those from lower income families
If more students do well at age 16, does that mean intergenerational mobility has improved?
While the gap has narrowed between rich and poor → increase in supply of and fall in demand for GCSEs → lowering their value in the labour market
Possible higher qualifications matter more now → need to consider family background differences further up the qualification hierarchy
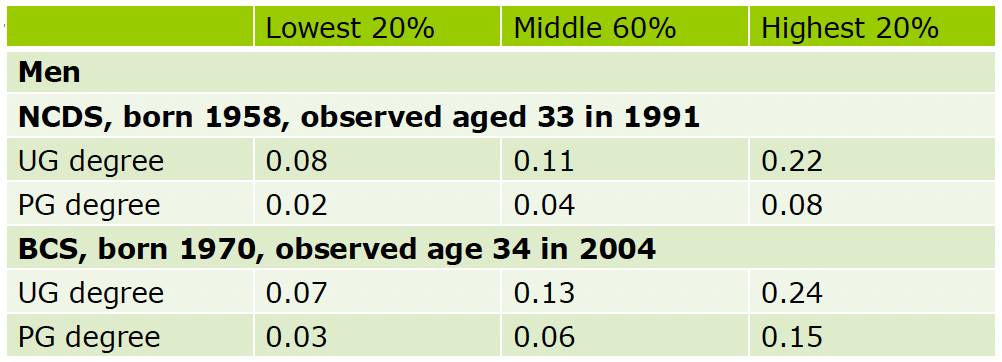
From Lindley and Machin (2012), what does this table on UG degree and PG degree for men show?
Large differences across childhood family income in terms of respondents who get a degree
BUT not much change for male graduates over time → 22% of 33-year-olds from high-income families got a degree in 1991 compared to 24% in 2004
Much more change for postgraduates though
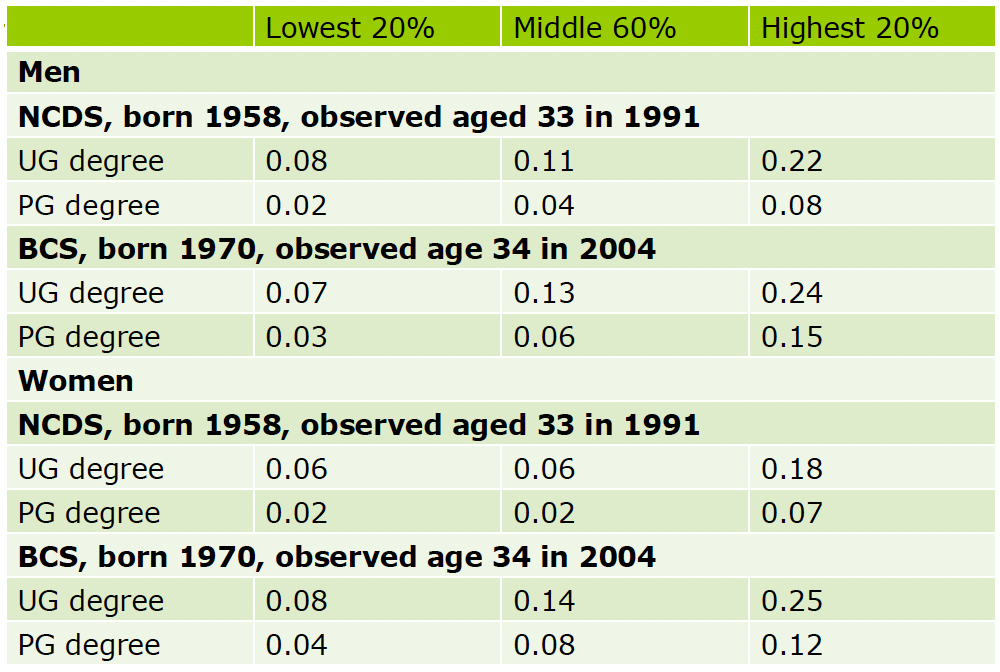
From Lindley and Machin (2012), what does this graph on UG degree and PG degree for women show?
Growth in supply of female graduates has largely come from middle income (and to some extent high-income) families
This change was larger for postgraduates
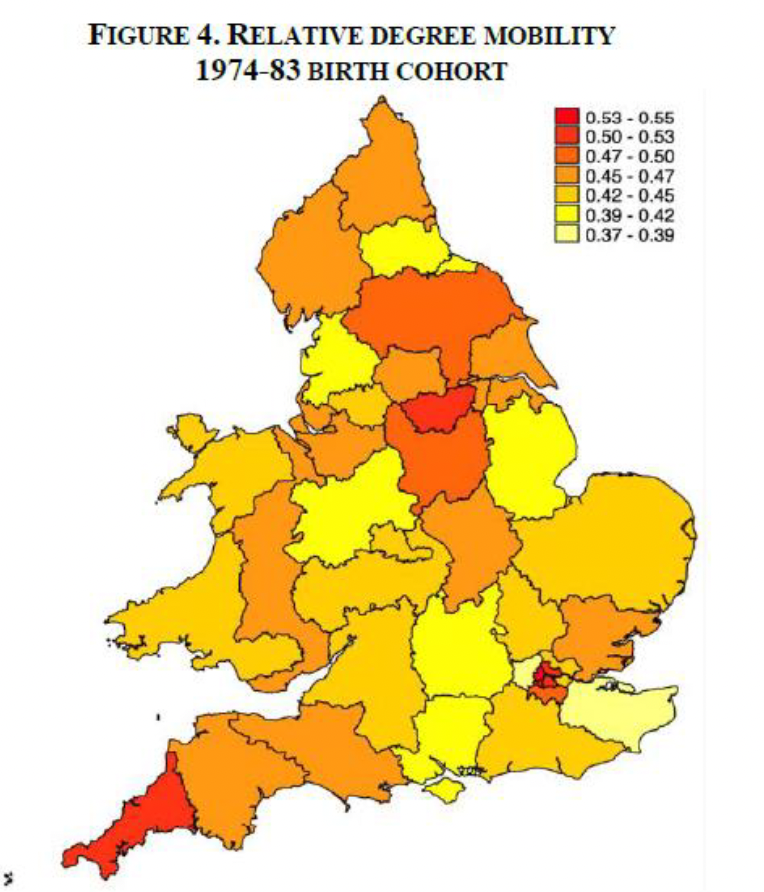
What does this figure on the likelihood of children whose parents have a degree obtaining a degree relative to children of non-degree parents (2011) show?
Outer London and Cheshire → kids are exceptionally mobile in absolute terms
BUT inner London and other red areas → kids of non-graduates are relatively much less mobile (fewer opportunities)
Why does the socio-economic background gap manifest itself higher at higher qualification levels?
Possible that parents’ income affects child’s education outcomes like this due to money itself causing high achievement OR characteristics associated w/ money
If answer is former → current high income inequality paints bleak picture for educational inequality
Why might it be that family income itself causes higher educational achievements?
Childcare quality
Comfortable home environment
Learning resources
Social activities
Neighbourhood
Private tuition, private schooling
What factors correlated with income might be causing the higher educational achievements?
Innate ability
Parental education
Parental styles → greater emphasis on education
How do we assess whether higher educational achievements are due to family income itself or factors correlated with income?
Regress child’s education against parents’ income and as many background characteristics of family possible → to control for characteristics associated with both
Issue arises when there are unobserved characteristics (that thus cannot be controlled for) influencing both parents’ income and child’s educational attainment
What do Blanden and Gregg’s (2004) results on the effect on child education when reducing parent’s income (at child’s age of 16) by 1/3 show?
Parental income now becoming more important in explaining probability of getting degree → i.e. intergenerational mobility is falling
How did Blanden and Gregg find whether probability of degree is due to income itself or family characteristics associated with parents’ income that determine child’s attainment?
Need to find random/exogenous variation in parents’ income → NOT related to their socio-economic background (i.e. circumstantial factors outside of your control)
i.e. Only permanent income correlated w/ unobserved family characteristics → need to measure changes in transitory income to isolate the effect of socio-economic background
3 methods tried → sibling studies, control for income at age 10, include post-childhood income
Explain the method of sibling studies used by Blanden and Gregg
Look for variation in attainment between siblings and compare to changes in family income at time of their education
Siblings have similar socio-economic background but different ages → so can see differences in family income by comparing each sibling at a certain age (where circumstantial factors could affect parents’ income differently)
Regress difference in attainment against difference in family income, between 2 siblings
Differences in family income should net out permanent income → difference should = transitory income (wealth effect)
Issue: Most siblings similar in age → so differences small
Based on sibling studies, what did Blanden and Gregg find?
Based on BHPS (born 1975/80) - effect of 1/3 fall in family income on transitory income:
Prob of staying on - fall of 3% points
Prob of degree - fall of 3% points
For prob of degree → holding characteristics of families constant, parameter on family income is measuring within-family differences in transitory income and thus pure ‘wealth’ effect
i.e. -3% for kids born in 1975/80 → permanent income/characteristics effect is just -4% since OLS was -7% and this captures both
Explain the method of controlling for income at age 10 used by Blanden and Gregg
Method should control for differences between children up to that age → i.e. age 10 income taken as measure of permanent income (before staying in school and university decision made)
So identifying income effect off variation in income after that age (here, age 16) → assumed to be transitory component
Based on controlling for income at age 10, what did Blanden and Gregg find?
Based on BCS (born 1970) → effect of 1/3 fall in family income on transitory income
Prob of no. A-C GCSEs - increase of 3% points
Prob of degree - fall of 3% points
For prob of degree → true income effect (measured by transitory income) is -3% and family characteristics effect (measured by permanent income) is -3% for kids born in 1970 (since OLS parameter was -6%)
Explain the method of including post-childhood income used by Blanden and Gregg
Post-childhood income inc. as measure of permanent income
Same principle as earlier income → picks up permanent income and controls for part of income correlated w/ family characteristics
Cannot be any direct income effect from this variable → as family don’t even have it when child is 16 (though could borrow against it)
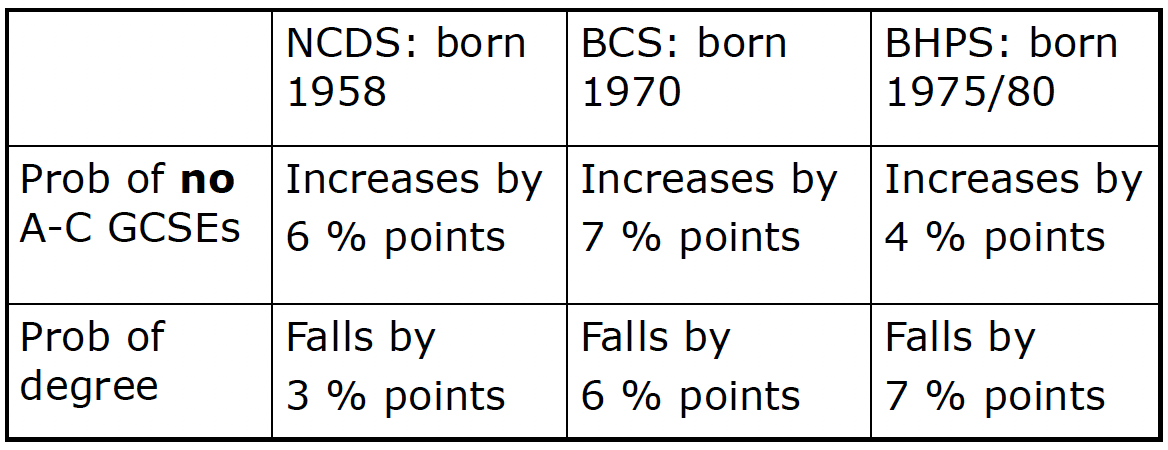
Based on including post-childhood income, what did Blanden and Gregg find?
Based on BHPS (born 1975/80) → effect of 1/3 fall in family income on transitory income
Prob of no. A-C GCSEs - increase of 4% points
Prob of degree - fall of 6% points
Thus, get slightly larger effect than using siblings
What are the overall findings of income-education intergenerational literature?
Isolating only transitory income → 1/3 fall in family income:
Reduces likelihood of getting a degree by 3% for kids born in 1970 → controlling for age 10 income
Reduces likelihood of getting a degree by 6% for kids born in 1975/80 → controlling for subsequent income
Thus, ‘things money can buy’ or wealth effect is getting stronger (over these birth cohorts) → suggests worsening intergenerational mobility
What is the relationship between parent’s education and child’s education attainment?
Positively related → BUT must consider whether real benefit of having more educated parents or whether more educated parents have passed on better genes (nurture or nature)
i.e. Is it a direct causal effect of parents’ education or just things correlated w/ education?
More tricky than investigating income-education relationship
Parents’ income changes over time → just need to isolate random variation
Parents’ education does NOT usually change over time → difficult to obtain random (exogenous) variation
What were Chevalier’s (2004) findings on the parents’ education-child’s education effect?
Dependent variable is whether child is still in post-compulsory schooling
X vector contains age, gender + controls for parent income, neighbourhood effects and no. of children in family
Each extra yr of mother’s education and father’s education both increase probability of staying-on by about 4 percentage points
What solutions have been tried in literature to determine if child’s education is affected by parents’ education itself or just a nature (genes) effect?
Twins studies
Adoptees studies
IV studies
Explain how twin parents have been used to assess the education-education effect
Idea is to compare education outcomes of children of twins (who have same genes)
Still need to control for other things correlated w/ parents’ education → e.g. income
Holding genetic effect constant → isolates effect of upbringing
BUT only looks at 1 parent of each child, ‘selection’ of other parent non-random and small sample sizes
What were the facts of Behrman and Rosenzweig’s (2002) study twin parents?
Use US data from Minnesota Twin Registry → get sample of identical (MZ) twins
Considers within-twin pair differences in twin parents’ schooling and within-pair differences in their children’s education
Also allows for non-twin parent and likelihood of assortative mating by inc. partners’ earnings in estimated equation
What did Behrman and Rosenzweig (2002) find regarding twin parents?
As mothers’ schooling increases by 1 yr → child’s schooling increases by 0.13 of a yr, OLS → for fathers this is 0.25
For twin mothers, no relationship between mothers’ schooling and child schooling (just nurture effect) → 0.13 is all genes
As fathers’ schooling increases by 1 yr → child’s schooling increases by 0.12 of a yr (nurture) and 0.13 of a yr (genes/nature)
Thus, positive and significant coefficient of mother’s education on child’s education in cross-section results becomes negative and insignificant for within-MZ pair results, but father’s education remains important
Suggests genes important for mothers at least
Explain how adopted children have been used to assess the education-education effect
Adopted children have same family background as natural children (inc. education of ‘parents’) BUT different genes → comparing two within same family can thus estimate effect of genes
OR on sample of adoptees only, effect of adopting parents on adopted children can only be via upbringing → so estimates this effect
BUT small sample sizes, families who adopt will be non-random, children offered for adoption might be non-random
What were the facts of Plug’s (2004) study on adopted children?
Uses Wisconsin Longitudinal Survey → complete cohort of high school graduates in 1957 → followed up in 1992
610 adopted individuals
Considers correlation between parent’s schooling on children’s schooling
Compares natural and adopted children within same family
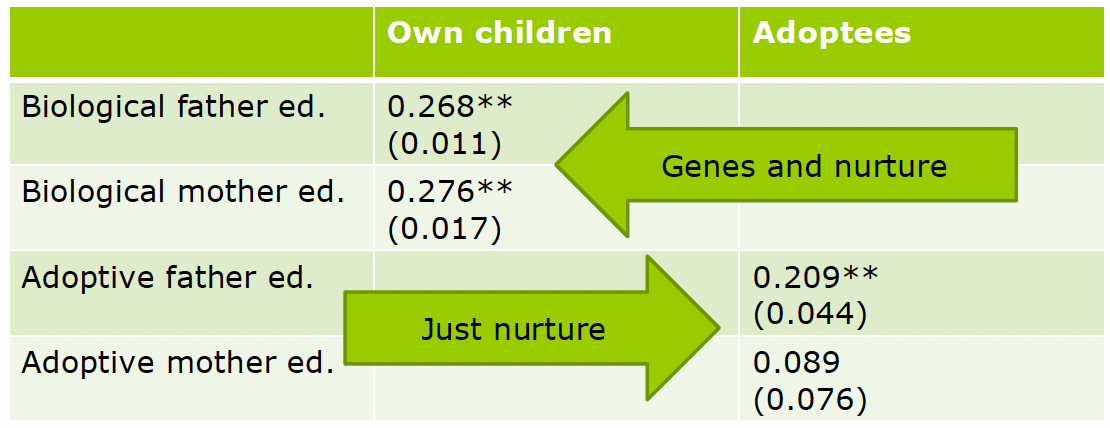
What did Plug (2004) find regarding adopted children?
Correlation between own child and biological fathers schooling → 0.27
As biological father’s schooling increases by 1 yr → biological child’s schooling increases by 0.27 yrs
For mothers → no nurture effect i.e. all genetic (nature)
For fathers → mostly nurture
Explain how instrumental variables have been used to assess the education-education effect
Want child’s education return to parents’ education → BUT w/o omitted ability bias (from nature/genetics)
Need to find variable correlated w/ amount of education parents have → BUT uncorrelated w/ outcome variable (education of children)
Thus will isolate exogenous variation in parents’ education and estimate upbringing (nurture) effect
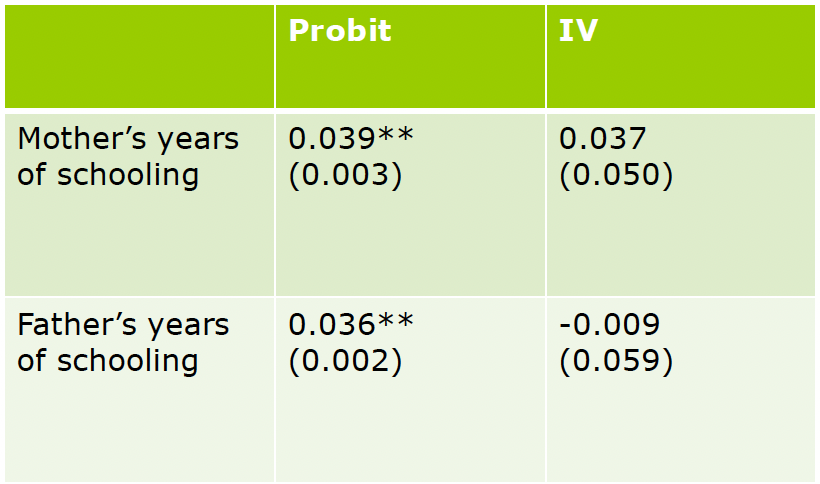
Using instrumental variables, what does Chevalier (2004) find regarding the education-education effect?
Uses whether parents affected by change in school leaving age (born before or after Sep 1957) as instrument for parents’ education
UK Family Resources Survey 1994-2002
Dependent variable → whether child still in post-compulsory schooling
Data on 2 generations only available if still living in same house → thus restricts children to 16-18 yr olds
RoSLA only affects those who want to leave school at earliest opportunity
Thus, all correlation between children’s and parent’s education explained by genes → nothing explained by nurture alone
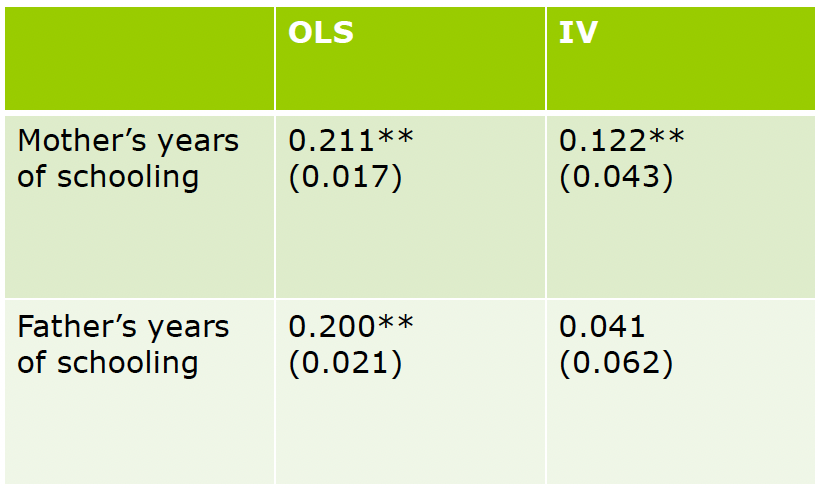
Using instrumental variables, what does Black et al. (2005) find regarding the education-education effect?
Dependent variable is child’s years of schooling
Raising of school leaving age in Norway in 1959 from 14 to 16
Admin data covering whole Norwegian population
Doesn’t rely on 2nd generation still living w/ their parents
Restrict sample to parents w/ <10 yrs of education → most affected by reform
For OLS, increasing mother’s schooling by 1 yr increases child’s schooling by 0.21 of a yr
Now, all correlation between father’s and child’s education explained by genes & nothing explained by nurture → but for mothers is half and half (contrary to twins and adoptees papers)
What are the overall findings of intergenerational educational literature?
IV method doesn’t agree w/ twins/adoptees as to relative importance of mother’s and father’s education
IV - nature and nurture effect for mothers and only genes (nature) effect for fathers → makes sense if we think women tend to be primary care givers (nurturers)
Twin/adoptees - parental background (nurture) effects only important for fathers → maybe since they make most decisions in the household
More recent papers (most associated w/ Heckman) suggest:
Interaction between genetics and upbringing factors is important
Idea genes are switched off due to environmental factors
So ‘early years’ interventions → important for social mobility
Based on Galindo-Rueda and Vignoles (2003), is the UK a meritocracy?
Have seen parent’s income and education is important for child’s education outcomes → BUT what about child’s ability?
Compare NCDS and BCS cohorts (born in 1958 and 1970) to find whether cognitive ability plays greater role in explaining highest academic qualification in BCS than NCDS cohort
No evidence ability has become more important in determining outcomes → for some qualifications (e.g. A levels), ability has become less important
Looking at impact of ability by family income level → high ability has changed from benefitting all to benefitting only the better off
e.g. Prob of high-ability girls getting a degree
Bottom income quintile - 38% (NCDS) to 29% (BCS)
Top income quartile - 60% (NCDS) to 77% (BCS)
What are some policy suggestions for intergenerational mobility?
No evidence UK becoming more meritocratic → if anything becoming less so
Affected by policy → tuition fees may make family background even more important
BUT likely earlier in child’s life that we have to break link between family background and attainment (e.g. Sures Start, Excellence in Cities)
Elliot-Major and Machin (2020) → advocate ABCD policy:
Access - reforming education admissions and entry to work
Behaviour - shifting away from highly individualised ‘winner-takes-all’ culture and moving to more collective responsibility
Community - not allowing places (areas) to be ‘left behind’ by restoring local prospects and pride
Decent work - w/ good jobs, career progression and emphasis on key skills and vocational education