3. Monopoly Regulation
1/5
There's no tags or description
Looks like no tags are added yet.
Name | Mastery | Learn | Test | Matching | Spaced | Call with Kai |
|---|
No analytics yet
Send a link to your students to track their progress
6 Terms
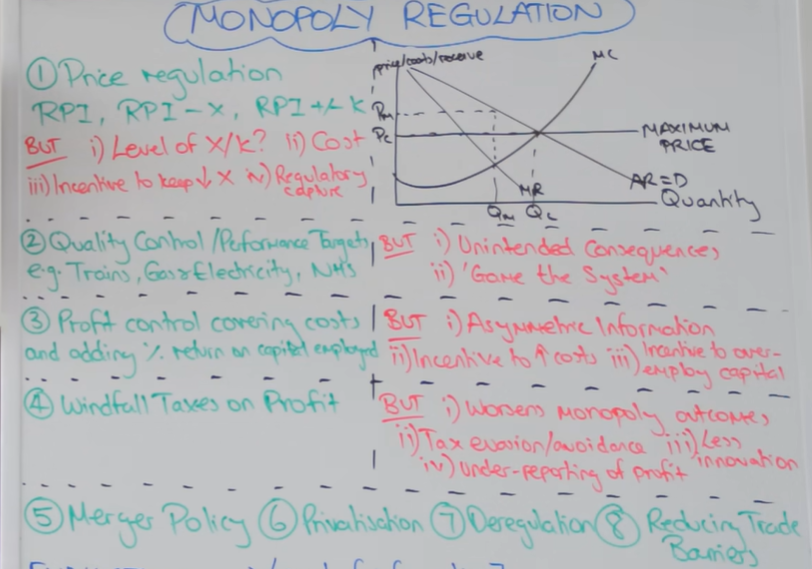
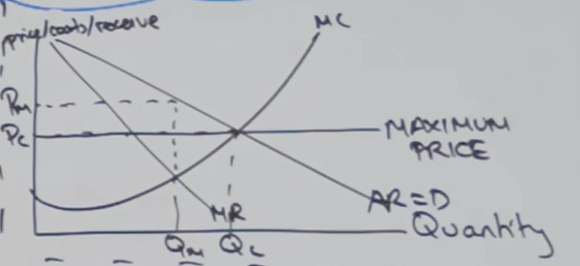
Price Cap/Regulation Diagram
Prices can only increase by RPI or RPI-X or RPI ± K
Normally (and optimal) to set at allocatively efficient point
Evaluation of Price Cap/Regulation
Level of X/K
Cost of Regulation/Enforcement
Incentive to keep increasing X if firms are doing well to keep costs low
Regulatory Capture
How to show windfall tax on a monopoly diagram
Shift the MC curve upwards
Evaluation for Windfall Tax
Worsens monopoly outcomes (show higher prices and quantity diagrammatically)
Tax evasion/avoidance
Under-reporting Profit
Less Innovation (decrease in dynamic efficiency)
General Evaluation Points for Monopoly Regulation
Level of Information
Costs vs Benefits
Regulatory Capture
Benefits of Monopoly
Government Failure
General Policies and Consequences for Monopoly Regulation