Micro Economics
 Call Kai
 Learn
Learn Practice Test
 Spaced Repetition
 Match
Match Flashcards
 Knowt Play
1/85

There's no tags or description
Looks like no tags are added yet.
Name | Mastery | Learn | Test | Matching | Spaced | Call with Kai |
|---|
No analytics yet
Send a link to your students to track their progress
86 Terms
Positive statement (definition + example)
Objective - these can be either proved or disproved using data e.g. the rate of unemployment is 5%.
Normative statements (definition + example)
Subjective - these are based on value judgments or opinions and cannot be proved or disproved with data e.g. unemployment should be kept below 5%.
The 4 factors of production
Land, labour, capital, enterprise
The basic economic problem
Wants are infinite but we have limited resources.
So there is scarcity.
So we have to make choices (opportunity cost).
Opportunity cost
The cost of an item expressed in terms of the next best thing which is forgone in order to have it.
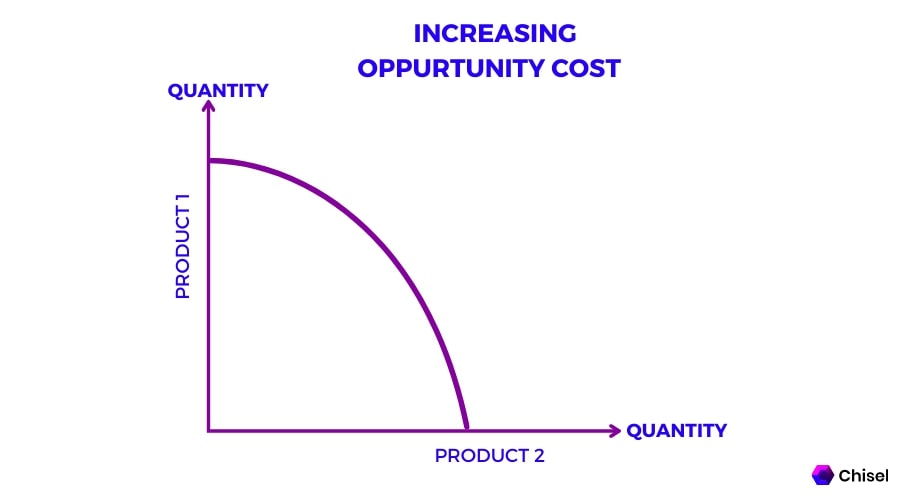
Increasing opportunity cost PPF and the Law of increasing costs
The gradient of the PPF shows the opportunity cost of increasing output of one good. In the curved PPF each additional fish produced requires an even greater fall in the amount of wheat.
This is because the factors of production in an economy are not identical. If initially all resources are used to produce wheat, it will be possible to move some resources towards fish without significant reduction in wheat production. This may be because the labour / capital etc transferred initially would be unsuitable at farming but better for fishing.
Demand
The want or willingness of consumers to buy goods and services at a given price.
Productivity
output generated per unit of labour in a given time period.
Labour productivity =
total production / number of workers
Specialisation
where an individual worker, business or region focuses their resources on producing a particular good/service.
Division of labour
the production of a good/service is broken down into individual tasks done by different employees.
This raises output per worker as they become more efficient through constant repetition. It also lowers the amount of training each worker needs, enables firms to use specialised machinery and reduces time wasted switching between tasks.
The functions of money (4)
Medium of exchange/means of payment
Store of value/wealth
Measure of value (prices)
Standard of deferred payment (debt)
Characteristics/qualities of money
Portable, divisible, durable, scarce, acceptable, difficult to forge.
Production
The process of converting inputs into outputs.
Market
Any place where buyers and sellers meet to trade goods and services.
Effective demand
The quantity of a good or service that a consumer is willing and able to buy at any given price, in a given period of time.
The law of demand - why is there an inverse relationship between QD and price?
Income effect - When price falls it is as if your income has risen and you can now buy more of everything.
Substitution effect - When price falls it is relatively cheaper than other goods/services and we substitute one good for another
Diminishing marginal utility - consumers derive less satisfaction the more units they consume and hence are only willing to pay a lower price for them.
Real disposable income
The total amount of money households have left to spend or save after taxes and mandatory deductions, adjusted for inflation.
Factors affecting demand
Change in: RDI, population, fashion and taste, income tax, price of substitute/complimentary goods, climate, interest rates.
Supply
The amount of goods and services firms or producers are willing and able to sell in the market at a possible price, at a particular point in time.
The law of supply - why is there a positive relationship between price and quantity?
Profit incentive - firms want to supply more at a higher price to maximise their profits.
Production and costs - when output expands, a firms production costs rise so a higher price is needed to cover these extra costs of production. This is due to the effects of diminishing returns as more factor inputs are added to production.
More competition - higher prices create an incentive for other businesses to enter the market increasing total supply.
Factors affecting supply:
Costs of production, number of producers, government taxes and subsidies, technology, future expectations.
Equilibrium
The point at which quantity demanded and quantity supplied are equal.
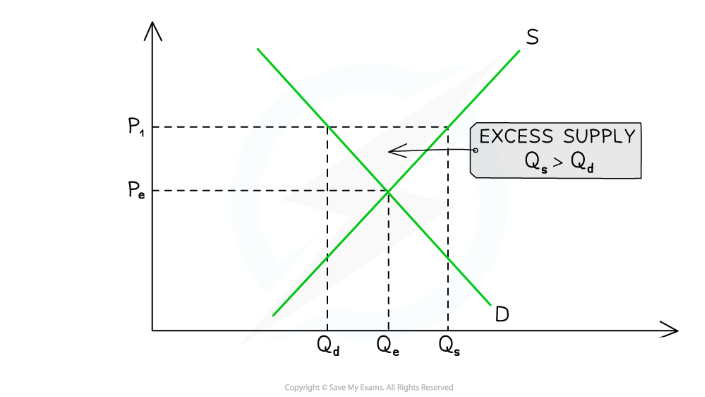
Excess supply (surplus) and how it corrects itself
If the price is P1 then suppliers will be willing to supply Qs, however consumers will only be willing to buy Qd.
There will be a surplus which will put downward pressure on prices as suppliers find it difficult to sell their products due to a lack of demand.
The excess in supply also sends a signal to firms to produce less.
This will continue until the price falls to reach equilibrium. Supply contracts and demand extends.
Excess demand (shortage) and how it corrects itself
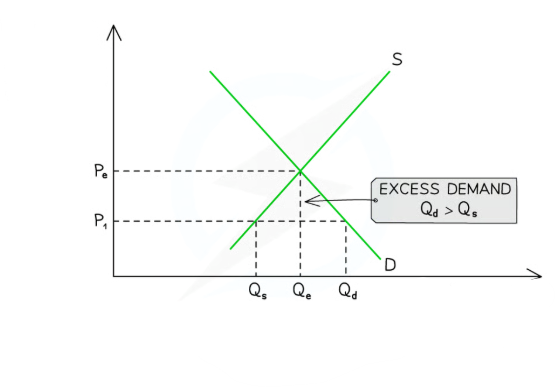
If the price is P1 then consumers will be willing to consume Qd, however producers will only be willing to supply Qs.
This will result in upwards pressure on the price. Firms will be unable to meet demand at the current price, so prices rise to ration the available supply.
As the price rises, more is supplied and there is an extension in supply, and less is demanded and there is a contraction in demand. Until the equilibrium is restored.
Consumer surplus
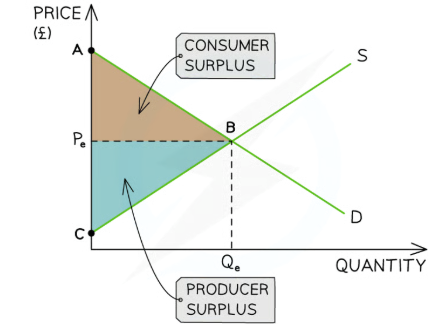
The difference between the amount the consumer is willing to pay for a product and the price they have actually paid.
Producer surplus
The difference between the amount that the producer is willing to sell a product for and the price they actually receive.
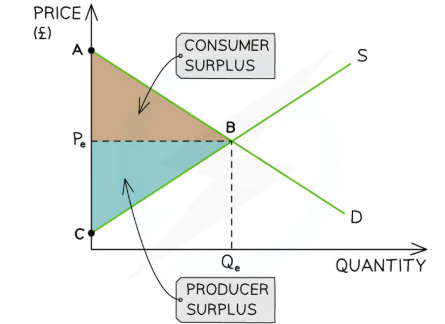
Community surplus/total extra benefit
consumer surplus + producer surplus
Marginal utility
the extra satisfaction gained from consuming one extra unit
Utility
the satisfaction you gain from consuming a good or service.
Total utility
the sum of all marginal utility gained from each unit consumed.
The law of diminishing marginal utility
As you consume more units, the extra satisfaction gained from each new unit falls.
Perfect (symmetric) information
Buyers and sellers have exactly the same level of information about the good or service.
Imperfect (symmetric information)
Buyers and sellers have different levels of information. This distorts socially optimum prices and quantities in markets, resulting in the over or under-provision of goods, and misallocation of factors of production.
Information gaps
Lack of understanding about long term benefits/costs.
Exist in nearly all free markets, distorting outcomes and resulting in market failure.
Bounded Rationality
Consumer’s decision making is restricted by limited information, limited processing ability and limited time.
Bounded self-control
Individuals have limited amounts of self-control. i.e. they may not be able to stick to a decision that they have made (e.g. to give up smoking).
Nudges
non-coercive policy interventions that guide citizens towards beneficial decisions without restricting personal choice or altering financial incentives.
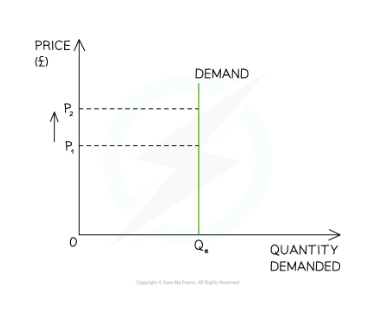
Perfectly inelastic
QD is completely unresponsive to changes in price.
Numerical value: 0
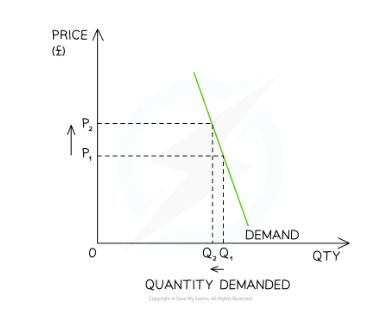
Inelastic
%∆ in QD/QS is less than proportional to the %∆ in P
Numerical value: 0 → 1
Unitarily elastic
% ∆ in QD is exactly equal to the %∆ in P
Numerical value: 1
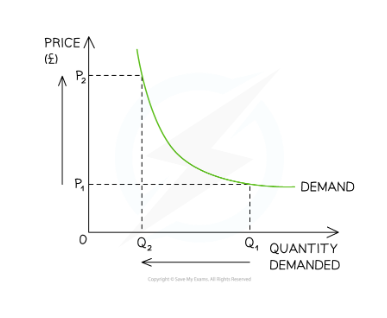
Elastic
%∆ in QD is more than proportional to the %∆ in P
Numerical value:1 → ∞
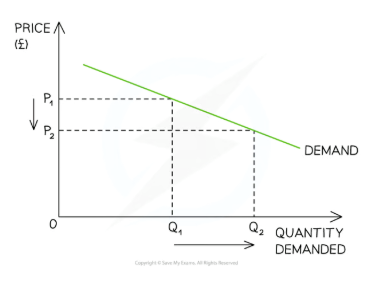
Perfectly elastic
%∆ in QD will fall to zero with any %∆ in P
Numerical value for PES and PED (-): infinity ∞
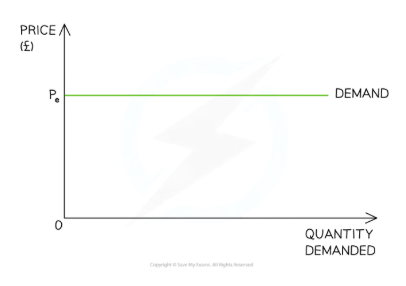
Price Elasticity of Demand (PED)
PED = % change in QD of good X / % change in price of good X
A measure of the responsiveness of demand to changes in the price.
Always negative. (- can be ignored)
Quaky duck in pond
Price Elasticity of Supply (PES)
How responsive the change in quantity supplied is to a change in price.
PES = % change in QS / % change in P
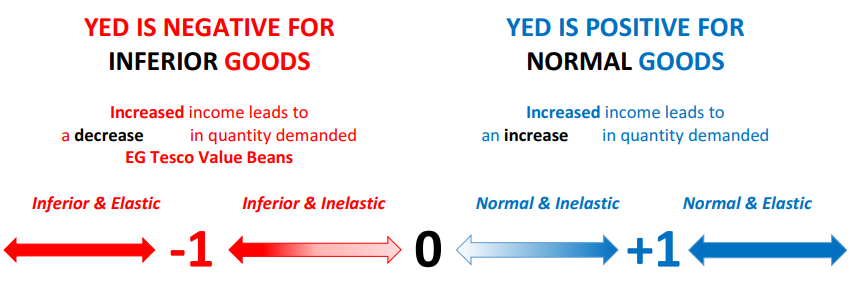
Income Elasticity of Demand (YED)
YED = % change in QD / % change in income
The responsiveness of demand for a good to changes in the income of consumers.
XED = 0 for unrelated goods.
Cross elasticity of demand (XED)
How responsive the change in quantity demanded for good A is to a change in price of good B.
XED = % change in QD of good A / % change in price of good B
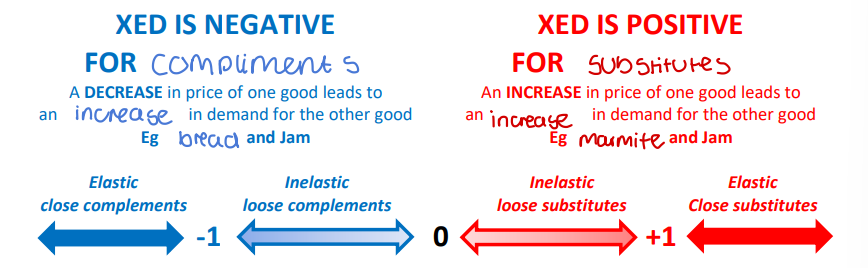
Complimentary goods
Two products that the consumer uses together.
Substitute goods
Two goods that could be used for the same purpose by the consumer.
They are in competitive demand.
Joint demand
When consumers use two products together (complements).
Change in price of one good impacts the demand for the other good.
Composite demand
Two or more goods require the same input to make them
An increase in production of one good could lead to a decrease in supply of another good, as less of the input is available .
Derived demand
Demand for a good or service arises from the demand for another good or service e.g. aluminium and cars.
Joint supply
The supply of two different goods stems from the same source.
The increase in production of one good will increase the production of another good.
The price mechanism
the interaction of demand and supply in a market economy that allocates scarce resources amongst competing needs and wants.
Rationing
When resources become scarce, the price will rise.
Only those who can afford to pay for them will receive them.
If there is a surplus, then prices will fall.
Incentive
The incentive function encourages producers to increase or decrease output to maximise profits.
When prices for a good/service rise then producers reallocate resources from a less profitable market to the profitable market to maximise their profits.
Signalling
High prices signal to producers to produce more of a good/service or enter the market.
Low prices signal to consumers to purchase more of a product.
3 functions of price:
Rationing
Incentivising
Signalling
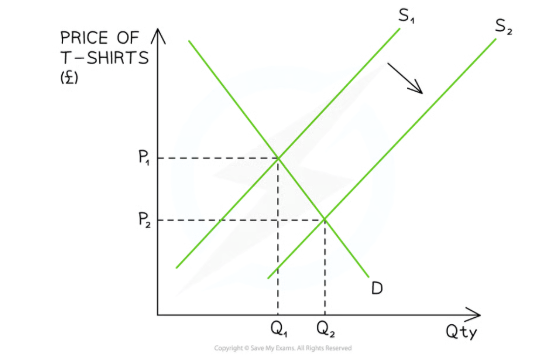
Analyse the diagram using the functions of price
Due to a change in one of the conditions of supply (lower costs of raw materials? (cotton?)) supply of t-shirts has shifted right from S1 to S2. And the price has dropped from P1 to P2.
T-shirts are rationed to those that are willing and able to buy at price P2, and that quantity is Q2. The number of consumers who can access the product has increased as it is rationed more widely.
The lower price incentivises consumers to purchase more t-shirts shown by the increase in demand from Q1 to Q2.
The shift in supply and drop in price signals to producers that there is excess supply and they may consider producing less or leaving the market.
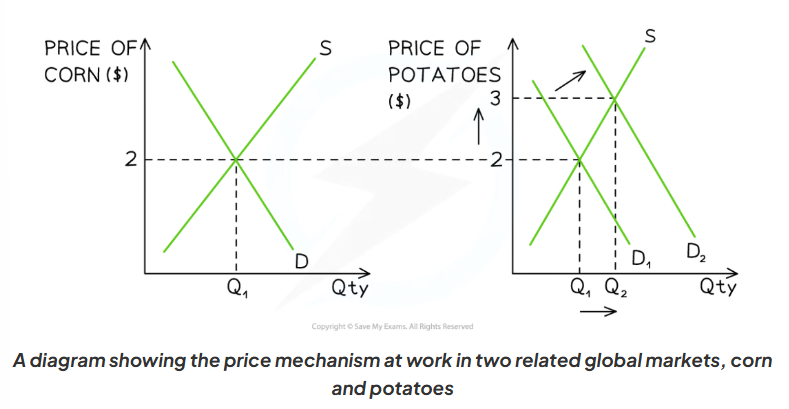
Analyse the diagram using the functions of price
Farmers in France have been producing corn for many years, and the market price is $2/kg. The price of potatoes in global markets has until recently been steady at $2/kg
Due to a change in one of the conditions of demand (possibly an increase in global population), the demand for potatoes has increased from D1→D2 and the price has increased from $2/kg to $3/kg
The higher price serves to ration the potatoes. Those consumers who can afford to purchase it for $3, receive it
The higher price incentivises producers to allocate more factors of production to producing potatoes and this is evident from the extension in supply from Q1 to Q2
The shift in global demand signals to producers in France that demand for potatoes is strong and they should consider switching some of their production from corn to potatoes.
Market failure
occurs when there is an inefficient allocation of resources in a free market.
Complete market failure
Occurs when there is a missing market, where the market does not supply products at all despite society having demand for it.
Partial market failure
Occurs where the market exists, but does not provide resources in the optimum quantities.
Monopolies
When a firm has market power and can set higher prices as they face less competition (this can make them less efficient)
4 characteristics of public goods
Non-rival/non-diminishable - one person’s use doesn’t decrease the amount available to others e.g. street lighting.
Non-excludable - you cannot stop people from using the goods e.g. national defence.
Non-rejectable - once provided you have no choice but to experience it.
Zero marginal cost - it costs nothing for more consumers to enjoy it
Public goods (short definition)
Goods that are beneficial to society but are not provided by private firms, and instead they are often supplied by the state. They are non-excludable and non-rivalrous.
The free rider problem
Public goods suffer from the free rider problem. This means that people can enjoy the goods without paying for them. Therefore there is no incentive for firms to supply the goods, and there may be a missing market.
This requires the government to provide the good and it is paid for by taxation.
But free-riders may not pay tax, but still gain the benefit from the good.
This cost to supply can cause the quantity provided to be less than the socially optimal level, or for there to be a missing market, and market failure.
The tragedy of the commons
A situation where individuals with access to a public, common resource, act in self-interest and abuse the good.
These common resources are rivalrous in consumption, and when demand exceeds supply, the resource becomes overconsumed ultimately leading to its damage or depletion.
e.g. overfishing of the seas leading to habitat degradation.
Quasi-public goods
Goods that are partially non-rival and non-excludable. They have characteristics of both public and private goods.
For example, roads are a quasi public good. They are partially non-rival because at high levels of demand, there is congestion and less people can fit on the road. They are partially non-excludable because not everyone has a drivers licence.
May be funded by a combination of government revenues and user fees.
Private goods
Goods that firms can provide to make a profit because they are rivalrous and excludable.
Allocative efficiency
Resources are allocated so that consumers and producers get the maximum benefit.
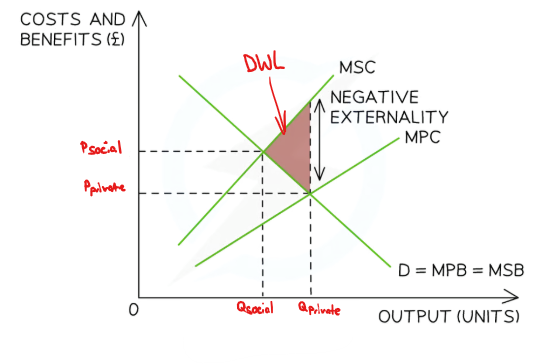
Negative externality of production
Negative spill over effects on a third party caused by the production of a good.
The optimal allocation of resources for society, would generate an equilibrium where MSB = MSC, where the market would be allocatively efficient.
The free-market allocates resources at the private optimum as firms fail to take into account the full social costs (negative externalities) from production, resulting in a welfare loss at MPC = MSB.
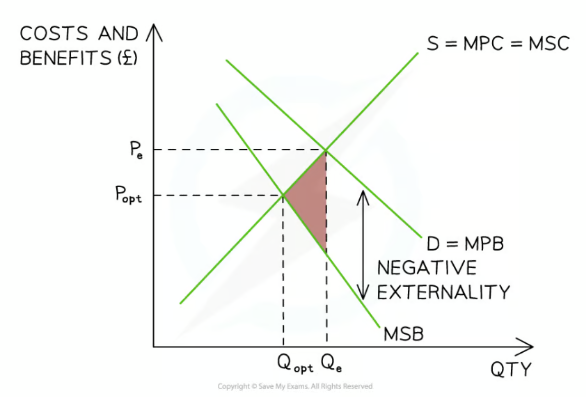
Negative externality of consumption
Negative spill over effects on a third party caused by the consumption of a good.
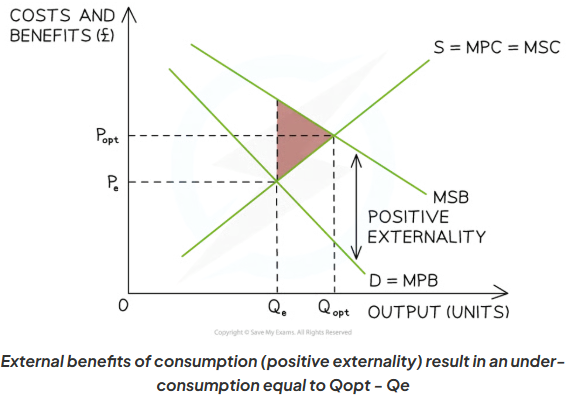
Positive externality of consumption
positive spill over effects on a third party caused by the consumption of a good
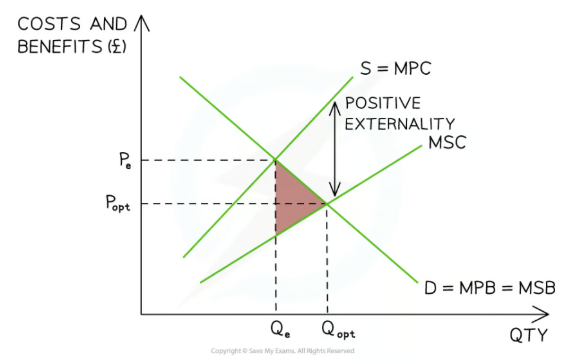
Positive externality of production
positive spill over effects on a third party caused by the productionof a good
Merit goods
Goods that are beneficial to society but are under-consumed because the free market does not provide enough of them.
Demerit goods
Goods that have harmful effects on consumers or society and are often over-consumed.
Factor immobility
When factors of production are difficult to reallocate to alternative uses.
Indirect tax
expenditure tax that is paid when goods and services are purchased
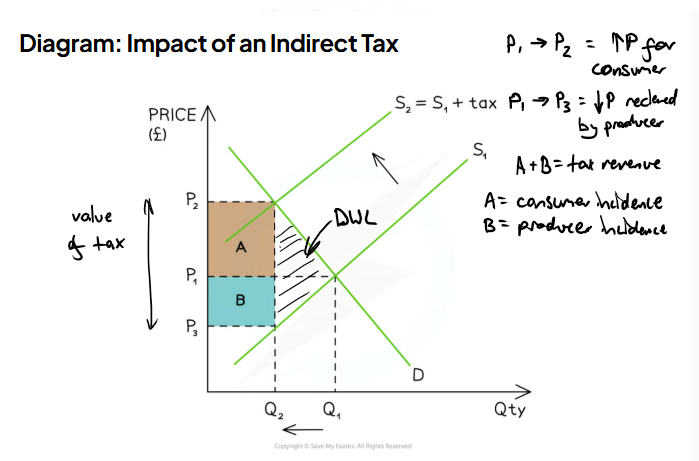
Specific tax
A certain per unit tax on the good, the same no matter the price.
Ad Valorem tax
a certain percentage of the price of the good is paid as tax.
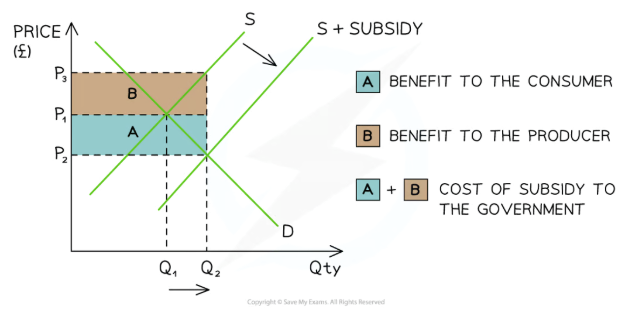
Subsidy
a per unit amount of money given to a firm by the government
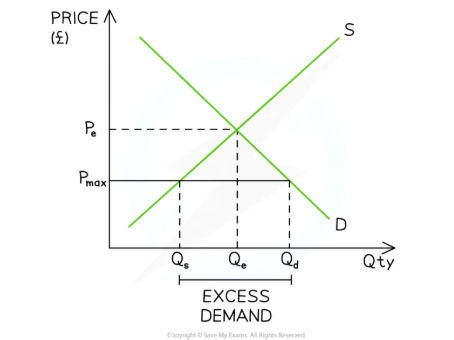
Price ceiling
A method of government intervention that places a maximum price it is legal to sell a product at and this decreases QS and increases QD.
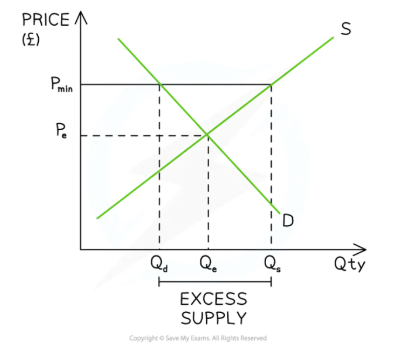
Price floors (minimum prices)
A minimum price set above the free market equilibrium price and sellers cannot legally sell below that price.
Can be used to help producers or to decrease the consumption of a demerit good.
Pollution permits
Government issues permits to polluting firms.
The price of the permit is determined by demand and supply. Each permit gives a maximum amount a firm is legally allowed to pollute. Any surplus can be sold and traded for additional revenue.
This means that more polluting firms have greater costs of production and this should reduce supply, correcting market failure by reducing negative externalities.