ERTH 375- Midterm 1
1/131
There's no tags or description
Looks like no tags are added yet.
Name | Mastery | Learn | Test | Matching | Spaced | Call with Kai |
|---|
No analytics yet
Send a link to your students to track their progress
132 Terms
Natural Disaster
A natural event in which a large amount of energy is released in a relatively short time with catastrophic consequences for life and/or infrastructure.
Cause= natural not man-made, but can result from ignoring hazardous natural conditions.Typically caused by sudden release of energy stored over a much longer time.
Can have significant casualties, societal disruption and/or economic loss.
Energy sources for disasters- Earth’s internal energy
Causes Earthquakes, Tsunamis, Volcanos
Energy sources for disasters- Gravity
Causes Mass movements and snow avalanche
Energy sources for disasters- Solar Energy
Causes Meteorological Storms, Flood, Drought, Wildfire, and Magnetic Storms
Energy sources for disasters- Impact Energy
Impact with Space object
What drives Earth’s internal energy and what does it cause?
Earth’s internal heat drives plate tectonics → earthquakes, volcanoes, tsunamis.
Heat mainly comes from radioactive decay (U, Th, K).
Extra heat left from early impacts + planet formation
What is gravity, and how does it relate to potential and kinetic energy?
Gravity = force pulling masses together; stronger with more mass, weaker with more distance.
Higher elevation = potential energy; falling releases kinetic energy.
Landslides, mudslides, avalanches = gravity‑powered hazards.
How does solar energy affect Earth?
The Sun makes energy by fusion (H → He), releasing heat + light (solar radiation).
Uneven heating (warm tropics, cool poles) drives weather, climate, winds → hazards like tornadoes + hurricanes.
Powers the water cycle → rain, floods, avalanches.
What is impact energy and why was it important early in Earth’s history?
Space objects (asteroids, meteoroids, comets) hit Earth at ~100,000 km/hr, creating huge kinetic energy on impact.
These collisions were a major energy source during the Hadean era (~4 billion years ago).
What are some energy sources of natural disasters? (list all that apply)
Gravity (due to attraction between two masses), Solar energy, wind energy, wave energy
The main source of Earth's internal energy is:
radioactive decay
Hazard
Potential for dangerous event.
Vulnerability
Likelihood a community will suffer when exposed to natural hazards.
Risk=
Vulnerability x Hazard
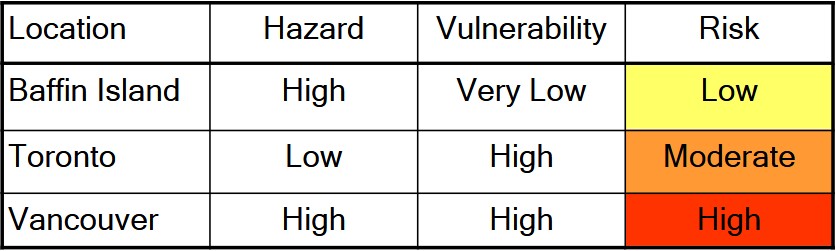
When do natural disasters occur?
when a hazard hits a vulnerable community.
What are hazard and vulnerability?
Hazards = natural events we cannot control (e.g., earthquakes, storms).
Vulnerability = how exposed or fragile people are; it can be reduced, but often costs money.
What happens before and after a disaster?
Before a disaster (long‑term):
Mitigation → reduce future damage
Preparedness / Adaptation → plan, train, adapt
After a disaster:
Response (short‑term) → immediate help, rescue
Recovery (mid‑term) → rebuild, restore
Mitigation and what are examples of structural and non‑structural mitigation?
Actions taken in advance to reduce disaster risk.
Structural mitigation (physical structures):
Dams, dykes, floodways
Retrofitting public/commercial buildings
Earthquake‑proofing homes
Non‑structural mitigation (policies + planning):
Land‑use rules
Severe weather warnings
Building codes
Public education
What is preparedness, and what are examples of it?
Preparedness = pro‑active steps to get ready for a disaster and ensure you can cope.
Examples:
Stockpiling essentials (food, water, supplies)
Household emergency kits
Evacuation drills
First‑aid training
What are Response and Recovery after a disaster?
Response (immediate actions after disaster):
Right after the disaster
Done by emergency workers, medical teams, police, firefighters
Must be swift, decisive, coordinated
Goal: Get the situation under control
Recovery (long‑term to rebuild communities):
Rebuilding homes, roads, services, communities
Restoring life to pre‑disaster conditions
Goal: Get life back to normal
Retrofitting a hospital to better withstand ground shaking during an earthquake is considered to be:
Mitigation
Because it Reduces future risk
Strengthens structures to limit damage
Is a long‑term, proactive measure
How are natural disaster trends changing over time?
Weather‑related disasters (storms, floods, heatwaves) → Increasing in frequency
Geologic disasters (earthquakes, tsunamis, volcanoes) → Stable frequency over time
Return Period
Average time between events
-Example: A damaging Vancouver Island earthquake every 20 years (on average)
Frequency
1 / Period: Average number of occurrences in a given time
-Example: Vancouver Island experiences 1/20 = 0.05 damaging earthquakes per year
Magnitude
Amount of energy released
-Bigger magnitude → rarer events
Small events happen often; large events happen rarely
How do disaster impacts differ between developed countries, and what trends are seen in Canada?
Developed countries:
Fewer casualties → better buildings, technology, medical care, education, lower population density
Higher economic losses → more expensive infrastructure to damage
Canada:
Recent disasters are mostly weather‑related
Likely because geologic disasters have long return periods
How can Earth’s internal structure be described?
Chemical composition → What it’s made of
Rheology → How the material behaves or deforms under stress
What are stress and what types of stress exist?
=force per area
Types:
Compression → pushes together (perpendicular) → contraction
Tension → pulls apart (perpendicular) → extension
Shear → slides past (parallel) → distortion
What is strain?
deformation caused by stress
How much the material changes shape in response
What is rheology, and how do materials behave under stress?
= how materials deform (strain) under stress
Viscosity = internal resistance to flow
1. Liquids:
Flow when stressed
2. Solids:
Elastic → deformation is temporary (returns to original shape)
Ductile → deformation is permanent
Brittle → material breaks/fractures
Plastic → flows slowly like a high‑viscosity fluid (e.g., glaciers)
Force per unit area is
Stress
How do time (t), temperature (T), and pressure (P) affect rheology?
Rheology = how materials deform under stress, controlled by t, T, and P.
Abrupt stress + low T and/or low P → brittle rupture
Material breaks rather than flows
Long‑term stress + high T and/or high P → plastic flow
Material deforms slowly and permanently
Examples:
Glaciers:
Flow plastically over long timescales
Fracture (crevasses) under sudden stress
Rock:
Brittle near Earth’s surface → earthquakes
Plastic at depth where T and P are high
What are the key properties of the Inner Core, Outer Core, and Mantle?
Inner Core (solid)
T ≈ 5000 °C
Density: 14–16 g/cm³
~2% of Earth’s mass
Solid metal: mostly iron (Fe) + some nickel (Ni)
Outer Core (liquid)
T ≈ 4000 °C
Density: 9.7–14 g/cm³
~30% of Earth’s mass
Liquid Fe/Ni
Generates Earth’s magnetic field (fluid motion)
What are the key properties of the continental and oceanic crust, and what is the Moho?
Crust–Mantle Boundary
Moho (Mohorovičić discontinuity)
Discovered 1906
Marks the compositional boundary between crust and mantle
Continental Crust (brittle)
T = 0–1000 °C
Density ≈ 2.7 g/cm³
~0.4% of Earth’s mass
Thickness: ~35 km average (up to 80 km under mountains)
Composition: granitic; rich in O and Si; ~60% silica (SiO₂)
Oceanic Crust (brittle)
T = 0–1000 °C
Density ≈ 3.0 g/cm³
~0.1% of Earth’s mass
Thickness: ~10 km (even thinner at mid‑ocean ridges)
Composition: basaltic volcanic rock; ~48% silica
What are the lithosphere, asthenosphere, and mesosphere, and how do they behave?
Lithosphere (rigid)
Rheology‑based layer: crust + uppermost mantle fused together
Rigid, brittle solid
Forms Earth’s tectonic plates
Controls plate interactions → earthquakes, volcanoes, mountain building
Asthenosphere (weak/plastic)
Located below the lithosphere
“Soft,” plastic upper‑mantle layer
Mostly solid, but with a few percent partial melt
Flows slowly under stress
Allows lithospheric plates to move over it
Mesosphere (stiff plastic mantle)
Beneath the asthenosphere
Stiffer, stronger plastic behavior
Still capable of slow flow, but more resistant
Why it matters
Lithosphere–asthenosphere interactions are key to geologic hazards:
Earthquakes
Volcanism
Plate motion
Mountain building
What controls whether a layer inside Earth is solid or liquid, and what are key examples?
Pressure (P)
Increases roughly linearly inward due to overburden
High P favors solids (raises melting point)
Temperature (T)
Increases nonlinearly inward
Driven by radioactive decay of U, Th, K
Composition
Different materials melt at different P–T combinations
Controls whether a layer melts or stays solid
Examples
Inner core vs. outer core
Inner core = solid because very high P keeps Fe/Ni solid
Outer core = liquid because lower P allows Fe/Ni to melt
Outer core vs. mesosphere
Outer core = liquid Fe/Ni
Mesosphere = solid/plastic silicate mantle
Difference is due to composition (silicates vs. metals)
What is rheology?
-how material deforms when subject to stress and how a material strains under stress.
What is isostasy, and what examples help explain it?
It is the gravitational balance where the lithosphere “floats” on the denser asthenosphere.
Elevation depends on thickness and density of the lithosphere.
Analogy: floating objects in water
Icebergs: the higher they stick up, the deeper they extend below.
Higher‑density objects float deeper (wood sinks deeper than styrofoam).
Adding or removing mass changes elevation → isostatic adjustment.
What real‑world examples illustrate isostasy?
Mountains sit on thicker lithosphere, so they float higher but also extend deep into the mantle.
Oceanic lithosphere is denser, so it sits lower, creating ocean basins.
What are examples of isostatic adjustment?
= elevation changes when mass is added or removed.
Example 1: Post‑glacial rebound
Heavy glaciers push crust down (subsidence).
When ice melts, the crust rebounds upward.
Ice melts faster than the asthenosphere flows → rebound continues long after melting.
Formerly glaciated areas rise; bulged margins sink slightly.
Example 2: Volcanic island subsidence → atoll formation
New volcanic islands slowly subside as the lithosphere adjusts.
If coral growth keeps pace with subsidence, a ring‑shaped atoll forms around a sinking island.
What evidence tells us about Earth’s internal structure?
A) Density Distribution
Earth’s average density = 5.5 g/cm³, but crustal rocks are only 2.7–3.0 g/cm³ → density must increase inward.
Earth doesn’t wobble much and surface gravity is nearly constant → mass must be arranged in concentric layers.
(B) Earthquake Seismology
Best evidence for interior structure.
Seismic wave timing (reflection/refraction) reveals rheological & compositional boundaries.
(C) Magnetic Field
Earth’s magnetic field requires convecting, electrically conducting fluid → proves outer core is liquid metal.
(D) Direct Observation
Drilling: crust drilled to ~12 km.
Lavas: show upper mantle composition to ~200 km.
Kimberlite pipes: bring deep mantle material + diamonds to surface.
(E) Lab Studies
High temperature & pressure recreated in labs to study mineral behavior.
Piston‑cylinder apparatus: simulates ~100 km depth.
Diamond‑anvil cell: simulates ~2000 km depth.
What is an earthquake, and what can cause one?
Earthquake = shaking of the Earth caused by seismic (vibrational) waves from an initial disturbance.
Main causes:
Faulting → sudden movement of rock blocks along a fracture (most common)
Volcanic activity
Meteorite impacts
Landslides
Explosions
Oil & gas production (induced seismicity)
Mining
Caldera collapses
Glaciers
Fault
A fracture in Earth across which the two sides move relative to each other (ex. in response to tectonic forces)
-Faults are complex irregular surfaces where interlocking rock is held together by friction.
Where can fault rupture occur, and how does temperature affect it?
Fault rupture only happens where rock is rigid and brittle
Rock must store elastic strain long enough to suddenly break
High temperatures make rock too plastic to rupture
Hot rock flows instead of fracturing
Temperature increases with depth, so:
Most earthquakes occur in the crust
Deeper rocks are too warm to break (with rare exceptions)
How does the elastic‑rebound theory explain fault rupture and earthquakes?
Fault is locked by friction → no slip occurs even though plates keep moving
Elastic strain builds up as the rocks on either side deform and store energy
When stress > friction, the fault ruptures suddenly
Stored energy is released as heat and seismic waves → earthquake
How does fault rupture begin and spread, and what are the hypocentre and epicentre?
Rupture starts at a point called the hypocentre (focus)
Rupture then spreads rapidly along the fault surface
May or may not rupture the entire fault
May or may not reach the Earth’s surface
Epicentre = point on Earth’s surface directly above the hypocentre
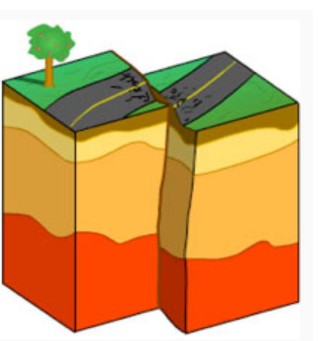
How do strike‑slip faults move, and what deformation occurs at step‑overs?
Strike‑slip faults = horizontal motion only
No vertical component
Rock units slide past each other
Often form long linear valleys, marked by streams or long lakes
Also called transform faults
Types:
Left‑lateral → opposite side moves left
Right‑lateral → opposite side moves right
Step‑over deformation (right‑lateral example):
Left step → compression + uplift
Right step → extension + subsidence
What are dip‑slip faults, and how do normal vs. reverse faults differ?
faults where movement is vertical, along the dip (slope) of the fault plane.
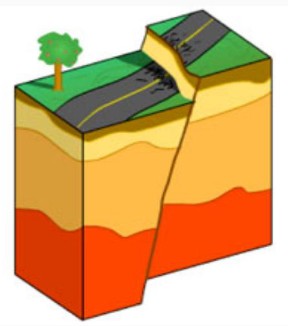
Normal Faults
Tensional forces → pulling apart
Hanging wall moves down relative to footwall
Creates a zone of omission (missing section of strata)
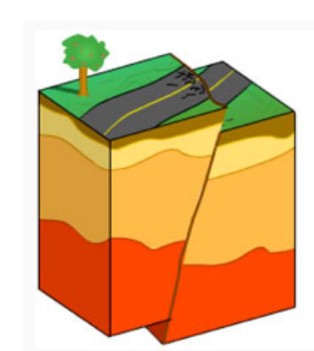
Reverse / Thrust Faults
Compressional forces → pushing together
Hanging wall moves up relative to footwall
Creates a zone of repetition (duplicated strata)
Thrust Fault Image
Normal Fault Image
Strike-slip Fault Image
Why is earthquake rupture mostly limited to the Earth’s crust?
the crust is cold and therefore rigid and brittle.
What did scientists believe before plate tectonics, and what shift in thinking made the theory possible?
(1960s)
Revolutionized understanding of EQs, volcanoes, tsunamis, and global geologic processes
To understand the theory, start with the historical context
Before the 20th Century, scientists believed:
Crustal motion was only vertical
Oceans and continents were similar (except oceans held water)
Geologic change was catastrophic and rapid, not slow and continuous
19th–20th Century shift:
Uniformitarianism began replacing catastrophism
Idea: Gradual processes operating today also shaped Earth throughout geologic time
This shift in thinking was essential for developing plate tectonics
What is Continental Drift, who proposed it, and why was it originally rejected?
Wegener’s Proposal (1912)
Proposed by Alfred Wegener, a German meteorologist
Early precursor to modern Plate Tectonic Theory
Key Ideas:
All continents once formed a supercontinent Pangaea (“all‑earth”)
Surrounded by a global ocean Panthalassa (“all‑ocean”)
Pangaea later broke apart, and continents drifted to their present positions
Why Wegener’s idea was rejected:
Opposed scientific thinking of the time
Wegener could not provide a reasonable mechanism
He imagined continents plowing through the seabed like a ship through water
Physically impossible with known geology
Without a mechanism, most geologists dismissed the idea
Aftermath:
Over the next 50 years, evidence steadily accumulated
Eventually led to seafloor spreading and the full Plate Tectonics revolution in the 1960s
What continental‑scale evidence supported Wegener’s Continental Drift?
1. Fit of Continents
South America + Africa coastlines noted to fit as early as the 1600s (Francis Bacon)
Fit improves when matching continental shelves (true geologic edges), not coastlines
2. Continuity of Geologic Features
If continents were once joined, continuous features should cross today’s ocean gaps — and they do:
Rock types & ages match across continents
Mountain belts continue across oceans
e.g., Appalachian Mountains (N. America) align with Caledonian Mountains (Europe)
Glacial striations (scratches) point from oceans toward land
Impossible unless continents were once joined and glaciers flowed across them
Plant & animal fossils match across now‑separated continents
Example: Mesosaurus fossils found in South America + Africa
Could not swim across 5000 km of ocean
What ocean‑based evidence helped lead to plate tectonics?
1. Mapping the Ocean Floor
Before 20th century: ocean depth measured by lead lines (slow, difficult; avg depth ~5 km)
Echo‑sounding sonar developed by the 1920s (WWI submarine warfare + Titanic sinking)
By 1940s–50s, sonar revealed:
Mid‑Ocean Ridge (MOR) — a continuous 65,000 km mountain chain in all ocean basins
Deep‑sea trenches near continental margins
Up to 5900 km long (Peru–Chile Trench)
Up to 11 km deep (Marianas Trench)
2. Seafloor Sampling & Age Patterns
Ocean basins are young: always < 200 million years
Continents are billions of years old
Radiometric ages, fossil ages, and sediment thickness all increase systematically away from MORs
Indicates new crust forms at ridges and moves outward → key evidence for seafloor spreading
How do global earthquake and volcano patterns support plate tectonics?
By the 1960s, a worldwide seismograph network could record and locate all major EQs
EQ foci (hypocentres) are concentrated in linear belts along:
Mid‑Ocean Ridges (MORs)
Deep‑sea trenches
→ These belts mark plate boundaries
At trenches, EQ foci dip beneath continents
This dipping zone is the Wadati–Benioff zone
Indicates subduction of one plate beneath another
Oceanic crust is youngest
near mid-ocean ridges.
Earthquakes occur predominantly:
along plate margins (trenches and mid-ocean
ridges).
What is paleomagnetism, and why is it important for plate tectonics?
he study of the geologic record of Earth’s magnetic field (MF) through time
Developed in the first half of the 20th century as instruments improved
Measures how magnetic minerals in rocks record the direction and strength of Earth’s magnetic field when they formed
Why it matters
Provided key evidence for plate tectonic theory
Showed patterns like:
Magnetic stripes on the seafloor
Symmetry about mid‑ocean ridges
Magnetic reversals preserved in basalt
Confirmed seafloor spreading and plate motion
What does Earth’s magnetic field look like, and what are magnetic field lines and magnetic poles?
Earth’s MF resembles a bar magnet, but Earth is not a permanent magnet
The interior is too hot to retain permanent magnetization
The field is generated by the liquid outer core (geodynamo)
Magnetic Field Lines
Arrows show the direction of the magnetic field
A compass aligns with these lines
The density of lines indicates field strength
More lines = stronger MF
Magnetic Poles
Locations where the magnetic field is vertical
Not fixed — they wander over time due to changes in the geodynamo
If Earth is not a permanent magnet, what generates its magnetic field?
Thermal convection + Earth’s rotation drive the motion of liquid iron in the outer core
This liquid iron is electrically conductive, so its movement creates electric currents
These currents generate a self‑sustaining magnetic field
The flow patterns are rotational, so the magnetic poles form near the rotation poles
This process is called the geodynamo
What are geomagnetic reversals, and what do “normal” and “reversed” polarity mean?
Earth’s magnetic field is unstable because the outer‑core flow patterns are unstable
The magnetic field flips direction at irregular intervals
North and South magnetic poles switch places
Occurs at random intervals from thousands to millions of years
Polarity Terms
Normal polarity → same orientation as today
Reversed polarity → opposite orientation
Earth's magnetic field originates in the:
outer core
What is thermal‑remanent magnetization, and how do rocks record Earth’s magnetic field?
Thermal‑Remanent Magnetization (TRM)
Earth’s magnetic field can induce TRM in certain minerals (e.g., magnetite, Fe₃O₄)
As volcanic rocks cool, electron domains align with the magnetic field, giving the rock a net magnetization
When the rock cools below the Curie temperature (T₍C₎ = 550 °C), this magnetization becomes permanent
It won’t change even if Earth’s magnetic field later reverses or shifts
Why it matters
Rocks preserve the direction and polarity of Earth’s magnetic field at the time they formed
These rocks can be dated radiometrically, allowing scientists to reconstruct magnetic history and support plate tectonics
How does the paleomagnetic record preserve Earth’s history of magnetic reversals?
Recording Magnetic Reversals
By measuring TRM directions in rocks of different ages (e.g., stacked volcanic flows), geologists can reconstruct the sequence of geomagnetic reversals
Each rock layer preserves the magnetic polarity at the time it cooled below the Curie temperature
Magnetic Polarity Time‑Scale
Represented as alternating black (normal) and white (reversed) bars
Shows polarity changes through time
Provides a global reference timeline used in plate tectonics and seafloor‑spreading studies
What are magnetic seafloor anomalies, and what pattern do they form around mid‑ocean ridges?
Magnetic Anomalies
1950s–60s ship‑board surveys measured magnetic anomalies on the seafloor
These anomalies are deviations from expected magnetic field strength caused by TRM in oceanic crust
Types of Anomalies
Positive anomaly → TRM aligned with Earth’s current magnetic field
Negative anomaly → TRM opposite to Earth’s current magnetic field
Magnetic Seafloor Stripes
Surveys revealed regular, alternating bands of positive and negative anomalies
These stripes are symmetric about the mid‑ocean ridge (MOR) axis
This symmetry reflects seafloor spreading and geomagnetic reversals recorded in basalt as it cools
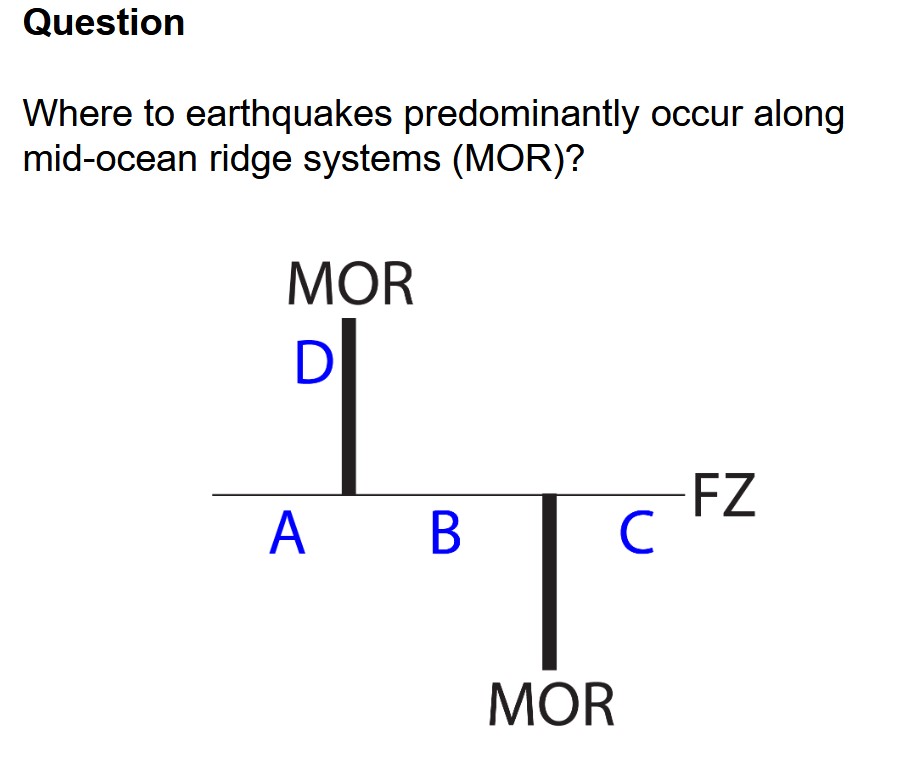
What are transform faults, and where do earthquakes occur along mid‑ocean ridges?
Transform Faults
Mid‑ocean ridge (MOR) segments are offset by long linear features called fracture zones (FZs)
Only the portion of a fracture zone between the offset MOR segments is active
This active, earthquake‑producing segment is the transform fault
Earthquake Activity
Earthquakes occur only on the active transform fault, not along the entire fracture zone
Outside the active segment, fracture zones are inactive scars on the seafloor
What are hot spots, and what does the Hawaiian–Emperor chain show about plate motion?
Hot spots create linear chains of volcanic islands and seamounts in ocean basins
Caused by stationary mantle plumes that melt through the moving lithospheric plate above
As the plate moves, volcanoes age and go extinct in a line trailing away from the active hot spot
Hawaiian–Emperor Chain
Extends ~4000 km NW, then bends north for another ~2000 km toward the Aleutian Trench
Hawaii (Big Island) is the youngest and volcanically active
Islands become older, extinct, and more eroded to the NW
Beyond Kauai, volcanoes are submerged seamounts
The bend in the chain records a change in Pacific Plate motion
How do hot spot tracks form, and what do they reveal about plate motion?
Hot Spot Tracks (Tuzo Wilson, 1963)
Hot spot chains form as oceanic lithosphere moves over a fixed mantle plume
Mantle plumes supply pulses of magma that create volcanoes in a linear chain
As the plate moves, older volcanoes become extinct, eroded, and eventually submerged (seamounts)
Evidence for Plate Motion
Hot spot tracks provide direct evidence of lithospheric motion driven by seafloor spreading
The bend in the Hawaiian–Emperor chain marks a change in Pacific Plate direction at ~43 Ma
Why Hot Spots Are Useful
Over 70 hot spots are recognized worldwide
Hot spots appear stable relative to the deep mantle
Because they barely move, they form a stable reference frame for measuring absolute plate motions
Where to earthquakes predominantly occur along mid-ocean ridge systems (MOR)?
Between points B and C (the transform fault).
What key discoveries led to modern plate tectonics, and what are the basic principles of the theory?
From Seafloor Spreading to Plate Tectonics
Recognition of seafloor spreading explained how new oceanic lithosphere forms at mid‑ocean ridges (MORs)
The question “What happens to old seafloor?” led to the discovery of subduction zones, where old oceanic lithosphere descends and is recycled into the mantle
These insights drove acceptance of modern plate tectonic theory
Basic Principles of Plate Tectonics
Earth’s surface is divided into interlocking lithospheric plates
Boundaries include mid‑ocean ridges, subduction/collision zones, and transform faults
Plates are internally rigid
Plates move relative to each other on the deformable asthenosphere beneath them
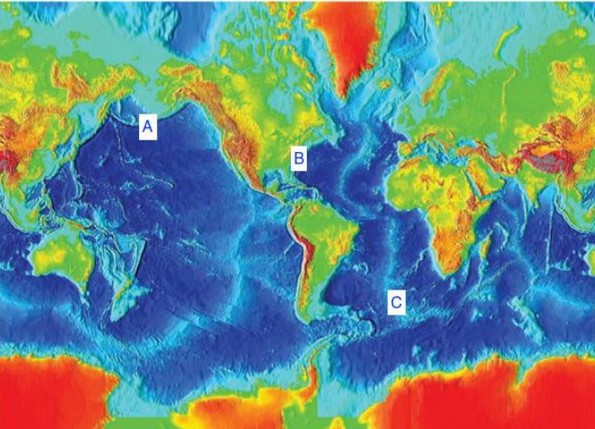
State the type of plate boundary (trench, mid-ocean ridge,
no plate boundary) for locations A, B, and C on the map
A — Trench (Subduction Zone)
Located off the west coast of North America
Characterized by deep ocean trench + active subduction
B — Mid‑Ocean Ridge
Located in the central Atlantic Ocean
This is part of the Mid‑Atlantic Ridge, a classic divergent boundary
Marked by seafloor spreading and shallow volcanic activity
C — Mid‑Ocean Ridge
Located in the South Atlantic Ocean
Also part of the Mid‑Atlantic Ridge
Another divergent boundary with new crust forming
What does plate tectonics explain, and what mechanism does it provide for continental movement?
Plate Tectonics Explains:
Fit of continents and geologic/fossil continuity
Mid‑ocean ridges and deep‑sea trenches
Age patterns of the seafloor
Global earthquake and volcano distribution
Magnetic seafloor stripes (symmetry + age patterns)
Transform faults and hot‑spot tracks
Mechanism for Continental Movement:
Continents ride on moving lithospheric plates
Plates move like a conveyor belt driven by seafloor spreading and mantle processes
NOT by continents plowing through ocean crust (Wegener’s incorrect mechanism)
What forces drive plate tectonics, and how do ridge push, slab pull, and mantle convection work?
Plate tectonics is driven by Earth’s internal heat, through three main mechanisms:
1. Ridge Push
Has two components:
Outward push from upwelling hot mantle at mid‑ocean ridges
Gravitational sliding of elevated lithosphere down the ridge flanks
Ridges are high because hot mantle heats + expands the lithosphere → lower density → isostatic uplift
2. Slab Pull
As lithosphere spreads away from the ridge, it cools, contracts, and becomes denser
Eventually becomes denser than the underlying asthenosphere
At subduction zones, the cold, dense slab sinks, pulling the rest of the plate behind it
Most powerful of the driving forces
3. Mantle Convection
Thermally driven convection cells circulate in the mantle
Upwelling beneath MORs
Downwelling at subduction zones
Plates are carried along like a conveyor belt by this circulating mantle flow
What happens at a spreading centre, and what earthquakes occur there?
Process
Plates pull apart at a divergent boundary
Magma upwells from the asthenosphere
Creates new oceanic lithosphere as it cools
Forms either a mid‑ocean ridge (MOR) or a continental rift valley
Earthquake Characteristics
Small magnitude: typically M < 5
Very shallow: < 10 km depth
Tensional earthquakes on normal faults
Maximum size and depth are limited because high temperatures beneath MORs prevent large fault rupture
What are slow, intermediate, and fast spreading rates, and what do full vs. half‑spreading rates mean?
Spreading Rates
Slow spreading: 1–5 cm/yr
Example: Mid‑Atlantic Ridge
Intermediate spreading: 5–9 cm/yr
Example: Southeast Indian Ridge
Fast spreading: 9–18 cm/yr
Example: East Pacific Rise
Full vs. Half‑Spreading Rates
Full‑spreading rate:
The rate at which plate A moves away from plate B
Total separation rate across the ridge
Half‑spreading rate:
The rate at which one plate (A or B) moves away from the MOR axis
Half of the full rate
What is rifting, and what are the four stages in the evolution of a continental rift?
Rifting
Process where a continent stretches, fractures, and begins to break apart
Driven by mantle heat, extension, and faulting
Can eventually form a new ocean basin
1. CenteringContinent is centered over a hot region in the mantle
2. Doming
Heat causes expansion and uplift
Leads to stretching and fracturing
3. Rifting
Gravity causes fractures to fail, forming faults
The centre sags
Volcanism begins as mantle material rises
4. Spreading
The deep rift floods with ocean water
Continued divergence forms new oceanic crust
Marks the transition from rift → young ocean basin
What are triple junctions, and how do they form during rifting?
Rifting process often creates a triple junction of 3 new spreading centres
A triple junction is a point where three plate boundaries meet
In rift settings, these are typically three diverging (rift) arms
Common in early continental breakup, where mantle upwelling promotes three‑armed rift geometry
Why They Matter
Help determine which rift arm becomes an ocean and which become failed rifts (aulacogens)
Classic example: Afar Triple Junction (Red Sea, Gulf of Aden, East African Rift)
What are the three types of convergent margins?
1. Ocean–Continent Convergence
2. Ocean–Ocean Convergence
3. Continent–Continent Convergence
What are the key features of Ocean-continent convergence?
Produces a subduction zone
Oceanic plate subducts beneath continental plate
Forms trenches, volcanic arcs, and powerful earthquakes
Denser oceanic lithosphere subducts beneath continental lithosphereTrench forms from down‑bending oceanic plate
Continental volcanic arc forms
Caused by dehydration of the subducting slab, triggering melting in the mantle
Produces the largest earthquakes on Earth
Up to M 9+
What are the key features of Ocean–Ocean Convergence
Also a subduction zone
One oceanic plate subducts beneath another
Forms deep trenches and volcanic island arcs
Older, colder, denser oceanic plate subducts beneath the younger plate
Forms a volcanic island arc
Generates very large earthquakes
Up to ~M 8.5
What are the key features of Continent–Continent Convergence
A collision zone
No subduction once buoyant continents meet
Forms massive mountain belts (e.g., Himalaya)
Low‑density continental crust resists subduction
Results in:
Uplift → formation of compressional mountain belts
Down‑warping → creation of extra‑thick crust
Produces shallow, compressional earthquakes
Up to M 8.5
Where do deep-focus earthquakes occur?
subduction zones
What characterizes transform faults?
Conservative boundary (no crust created or destroyed)
Strike‑slip motion between plates
Shallow EQs (<35 km)
Can produce major EQs (up to M ~8)
Where do most transform faults occur?
Mostly on the seafloor, offsetting MOR segments
EQs here are rarely harmful
On land, they can be highly destructive (San Andreas, Alpine Fault, North Anatolian Fault)
What causes earthquakes at hot spots?
Rock expansion/fracture from hot magma
Harmonic tremors from moving magma
Fault failure from uplift/subsidence due to repeated magma injection/withdrawal
Range from small to large EQs
Why does western Canada have the highest earthquake risk?
Close to active plate boundaries
Major hazard to Victoria, Vancouver, Seattle, Portland
Cascades = active volcanic arc (Mt. Garibaldi, Mt. Baker, Mt. Rainier, Mt. St. Helens)
Where do inter‑plate earthquakes occur?
On the shear interface between subducting and overriding plates
Includes megathrust earthquakes (largest on Earth, M 8–9+)
What evidence shows past megathrust EQs in Cascadia?
Coastal marsh layers (peat → mud → tsunami sand)
Drowned coastal forests
Seabed turbidite layers
Japanese tsunami records
First Nations oral histories
What sediment sequence indicates past megathrust EQs?
Peat (land plants)
Mud (submerged coastal sediment)
Sand (tsunami deposit)
What do turbidite layers show?
Alternating coarse sand and fine mud in deep‑sea cores
Each sand layer = submarine landslide triggered by a megathrust EQ
What happens during the inter‑seismic period of a megathrust cycle?
Elastic strain builds in overriding plate
Toe dragged down
Coastal uplift (decreasing inland)
Crustal shortening
What happens during the megathrust earthquake itself?
Toe jumps up (1–5 m), triggering tsunami
Coastal subsidence (1–2 m)
Crustal extension (10–20 m)
hat do geodetic measurements reveal about Cascadia?
Uplift up to 6 mm/yr
Uplift decreases inland
Matches the inter‑seismic deformation expected in megathrust zones
What is the megathrust earthquake risk in Cascadia?
13 past megathrust EQs
Recurrence: 300–900 yrs (avg. 400–600 yrs)
Last one: AD 1700 (319 yrs ago)
5–10% chance of M9+ in next 50 yrs
M9+ shaking lasts several minutes and affects a huge area
What’s the difference between a seismometer and a seismograph?
Seismometer: Detects ground vibrations
Seismograph: Records those vibrations (now digital, in 3D: N‑S, E‑W, vertical)
Basic Wave Properties-Key wave terms to know
Amplitude: Maximum height
Wavelength (λ): Length of one cycle
Period (T): Time for one cycle
Frequency (f): Cycles per second (Hz)
Velocity: V=λf