Inferential Statistics
1/55
There's no tags or description
Looks like no tags are added yet.
Name | Mastery | Learn | Test | Matching | Spaced | Call with Kai |
|---|
No analytics yet
Send a link to your students to track their progress
56 Terms
What is inferential statistics
Inferring features of a pop by looking at a small sample
What do inferential statistics determine
The likelihood that a conclusion is true
Parametric stats
Groups of statistics that are related, follow Gaussian distribution
What are parametric stats defined by
Parameters
Parameters in parametric stats
Mean and standard deviation, t-tests, ANOVA, correlation, regression
Non-parametric stats
Non-normal distributions with extremely small sample sizes
Examples of non-parametric stats
Chi squared, Wilcoxin-ranking, and others
What are assumptions of statistical inference based on
Probability and sampling error
Probability
Study of random events
Range of probability
0 to 1
What do we use probability as
Means of prediction
Probability for an event that is certain to occur
1
Why is probability predictive
It reflects what SHOULD happen over the long run, not necessarily what WILL happen for any given trial
Once an event happens is it “probable”
No, it either happened as predicted or not
What does probability apply to
The proportion of time we can expect a given outcome to occur in the long run
How is probability used in research
To determine if observed treatment differences are likely to be representative of population differences or if they could have occurred by chance
How do we apply probability in a research sample
To predict/estimate what would happen to others in the population based on what happened to our sample
Goal of sampling
Sample has to be a good representation of the entire population
What must a sample be
RANDOM
What do we do with categorical data
Calculate proportions
What does a sampling distribution do
Shows how a statistics varies sample to sample
What is the sampling distribution
Getting different means from different samples
What makes a sampling distribution more accurate
More samples
Do we usually take more than one sample
No, just take a bigger one
Standard error of the mean
How far our sample mean is from pop mean
Standard error of mean formula
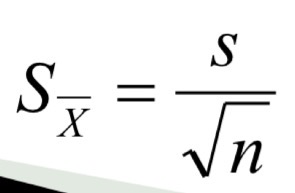
Standard deviation
How widely scattered measurements are
Standard error of the mean
Indicate the uncertainty around the estimate of the true population mean
Confidence Interval
Range of scores with specific boundaries (confidence limits) that SHOULD contain the population mean
Confidence interval formula
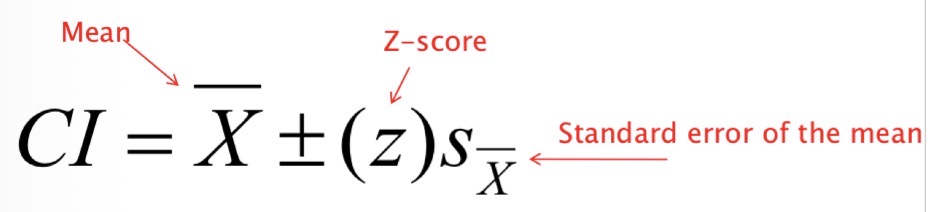
Most common CI
95%
Z-score for 95% CI
+ or - 1.96
Z-score for 99% CI
2.576
Type I error
False positive
Type II error
False negative
Statistical significance
Results of an analysis are unlikely to be due to chance at a specified probability level
What happens if your results are statistical significance
You reject the null hypothesis
How do you format CI result
( x% CI: x - x )
Significant difference/effect
If the evidence/data show that it is unlikely that chance is causing observed differences
Not significance different
There isn’t enough evidence to reject the null hypothesis
Another name for Type I error
Alpha
Explain type I error in terms of significance
We conclude that a real difference exist when he differences are due to chance
Calling them “statistically significant”
Another name for type II error
Beta
Explain type II error in terms of statistical significance
Conclude that the differences are due to chance when the samples are truly different
Calling results “not statistically significant”
What must happen to determine the probability of committing a Type I error
Must be a standard set for rejecting the null hypothesis
Level of significance
Alpha value
What is the level of significance
The probability that an observed difference did occur by chance is determined by statistical tests
What does the selected alpha level define
Maximal acceptable risk of making a Type I error, if we reject Ho
What does an alpha level of 0.05 mean
You are willing to accept a 5% chance of incorrectly rejecting the null hypothesis
What does beta denote
Probability of making Type II error, probability of failing to reject a false null hypothesis
Discrete values
Have only one of a limited set of values, can only be expressed as whole numbers
Continuous values
Have a range and may take any value within that range
Nominal data
No implied order, unranked; categorical
Ordinal data
Numerical ranked data; based on some criteria
Interval data
No meaningful 0 (e.g. temp)
Ratio data
Meaningful zero (e.g. height)