Science - Safety symbols and graph rules
1/13
There's no tags or description
Looks like no tags are added yet.
Name | Mastery | Learn | Test | Matching | Spaced | Call with Kai |
|---|
No analytics yet
Send a link to your students to track their progress
14 Terms
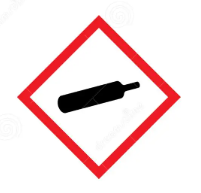
What is this symbol?
Gas cylinder (for gasses under pressure)
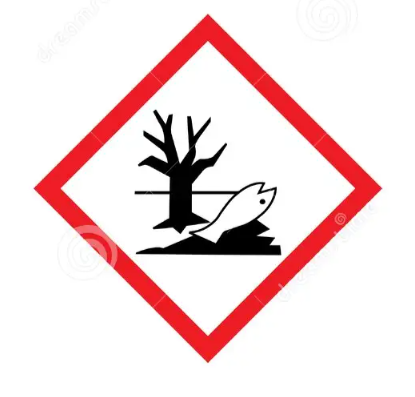
What is this symbol?
Environment (environmental hazard, may cause damage to the environment)
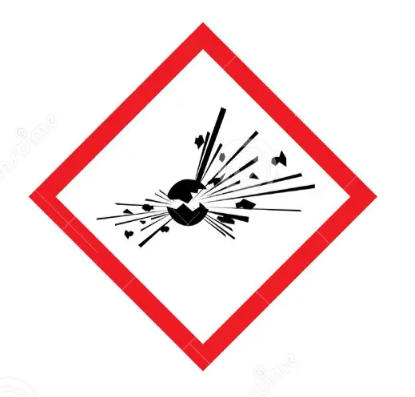
What is this symbol?
Exploding bomb (explosives, for explosion or reactivity hazards)
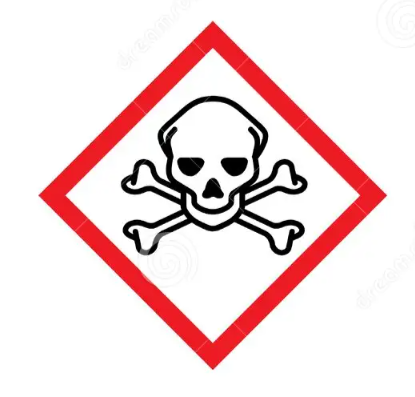
What is this symbol?
Skull and crossbones (acute toxicity, can cause death of toxicity with short amounts of exposure to small amounts)
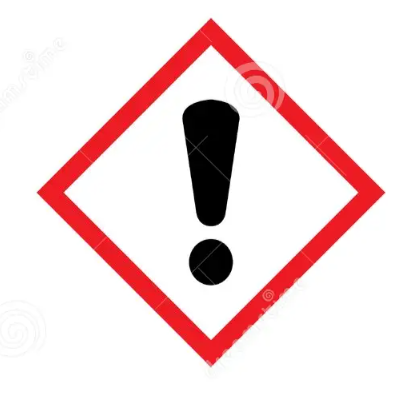
What is this symbol?
Exclamation mark (harmful/irritant, may cause less serious health effects or damage to the ozone layer)
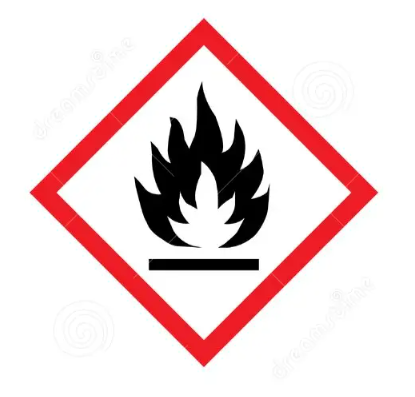
What is this symbol?
Flame (flammables, for fire hazards)
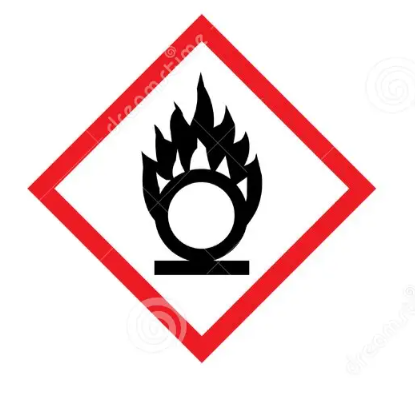
What is this symbol?
Flame over circle (oxidizers, for oxidizing hazards)
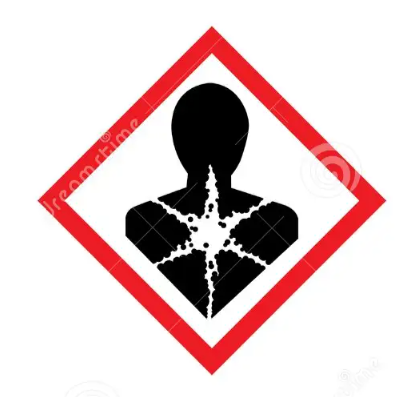
What is this symbol?
Health hazard (severe health hazards, may cause or suspected of causing serious health hazards)
What is this symbol?
Corrosion (corrosives, for corrosive damage to metals, as well as skin, eyes)
What does GHS stand for?
Global Harmonized System
What does SDS stand for?
Safety Data Sheet
6 things required when making a graph?
1. Caption: Provides details about the graph, always placed at the bottom.
2. Label x and y axes: Clearly indicate what each axis represents.
3. Data points: Use a scatter plot to represent individual data points accurately.
4. Legend: Clarifies symbols/colors used in the graph (note: 'legend' is the correct spelling).
5. Slope + R²: Include these metrics when creating graphs digitally to show trends.
6. Uncertainties: Incorporate error bars to represent data variability.
What does N/DV stand for?
Non-Dependant Variable (Independant variable, x)
What does DV stand for?
Dependant Variable (y)