CH 2: Graphical Description of Data
1/9
There's no tags or description
Looks like no tags are added yet.
Name | Mastery | Learn | Test | Matching | Spaced | Call with Kai |
|---|
No analytics yet
Send a link to your students to track their progress
10 Terms
Raw Data
list of all data values
Qualitative Data ex: Grades, A, B, C, D
Frequency Distribution (f-)
the organization of raw data in a table form using classes (groups) and frequencies
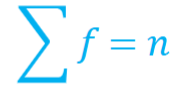
f-
f stands for?
the number of times a value appears in a certain data set
sum of all frequencies is = sample size
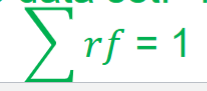
what does rf stand for?
Relative frequency: the number of times a value appears in a certain data set divided by the total number of values
sum of rf is 1
rf = f/n
Pareto Chart
a type of bar graph
bars are arranged from largest to smallest
Quantitative Groups needed?
Groups: data is spread with few repeats
No groups: data as many repeats and is a little spread
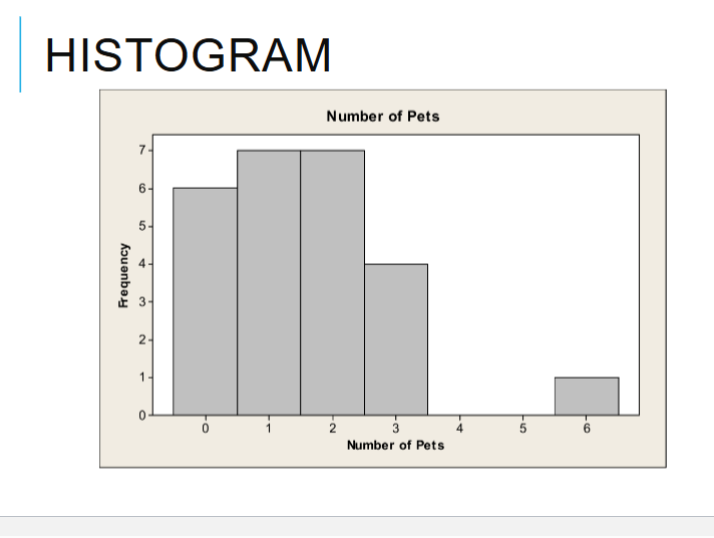
Histogram
type of bar graph
Vertical axis: frequency or relative frequency
Horizontal axis: data values in order
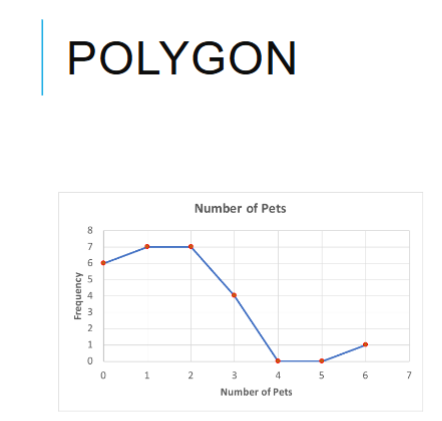
Polygon
line graph which is labeled as the histogram