Optical Physics
1/99
There's no tags or description
Looks like no tags are added yet.
Name | Mastery | Learn | Test | Matching | Spaced | Call with Kai |
|---|
No analytics yet
Send a link to your students to track their progress
100 Terms
Biological tissue properties & how they are modelled
Inhomogeneous media.
Wide range of structures: membrane (size 0.01 um) to cells (size 10um).
Modelled as ensembles of homogeneous discrete particles with refractive index higher than surrounding.
Sizes for structures are in light wavelength order & shapes are spheres/ ellipsoids.
Parameters & properties that light-tissue interaction depends on
Light parameters: energy density, exposure time.
Tissue optical properties: light absorption & scattering.
Properties of scattering types & when they occur
Rayleigh scattering: occur when particle size « incident light wavelength.
Isotropic angular distribution of scattered light.
Elastic scattering (only direction changes not energy/wavelength), not angle dependent.
Mie theory (in tissues): occur when particle size ≈ incident light wavelength.
Considers optical absorption & angle-dependent scattering losses.
Inelastic scattering - interacts with matter & transfers energy (wavelength change).
Anti-dependence increases with bigger particles
Raman scattering - energy transfer from incident photon to molecule or vice versa.
Inelastic scattering
Explain the sky’s blue & cloud’s grey/dark colour + scattering type they depend on.
Rayleigh scattering (blue sky):
atmospheric molecules scatter short wavelengths (e.g. blue) from sunlight - these are visualized.
Mie theory (grey/dark cloud):
Cloud water droplets > light wavelength so forward scattering is predominant & less light reaches observer.
Higher concentration clouds (darker): more scattering & more light gets absorbed.
Optical scattering, optical absorption & collimated beam definition
Optical scattering – light intensity reduction of collimated beam when travelling through non-absorbing medium due to light scattering.
Optical absorption - optical energy transfer to other forms (heat, sound, fluorescence) after interaction with tissue.
Collimated beam (e.g. laser) - all light rays travel in same direction.
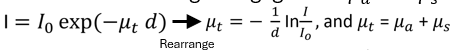
Light intensity equation (optical scattering)
I(d) = I0 exp(-𝜇s d)
I(d) : light intensity as function of propagation distance.
I0 : initial light intensity
𝜇s : scattering coefficient
d : propagation distance
Definition & corresponding equations for quantizing optical scattering:
Scattering coefficient
Mean Free Path
Anisotropy factor
Reduced Scattering Coefficient
Transport Mean Free Path
Scattering coefficient (strong scattering for large 𝜇s ) - scattering amount per unit distance.
Mean Free Path (MFP) - average distance light travels before scattering once.
Max of 1 scattering event if medium thickness < MFP
Equation: MFP = 1 / 𝜇s
Anisotropy factor (g) - average scattering direction.
In tissue g=0.9 : mostly forward scattering.
Equation: g = cos(θavg)
Reduced scattering coefficient (𝜇s ‘) : represents how much scattering actually randomises photon direction, discounting forward scattering.
Simplifies directional scattering by approximating isotropic model (remove angular dependence).
Equation: 𝜇s ‘ = 𝜇s(1 - g).
Transport Mean Free Path (TMFP) - average distance light travels before original direction is lost.
Equation: TMFP = 1 / 𝜇s ‘
Absorption coefficient (𝜇a ) definition
Light intensity reduction of collimated beam when travelling through non-scattering medium due to optical absorption.
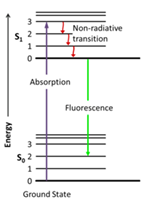
Photon absorption process (including light emission types)
Molecule electron absorbs photon to reach excited state.
Emit light/ heat/ other processes to return to ground state.
Fluorescence/ phosphorescence – excited photon emits another photon when relaxing back to ground state.
Fluorescence – immediate emission (nanoseconds).
Phosphorescence – longer period (millisecond).
Uses of tissue absorption
Tissue chromophores undergo optical absorption that’s dependent on incident light wavelength.
Different tissue types emit different colours - can differentiate between tissue types.
Raman spectroscopy - differentiate different molecule types.
Fluorescence imaging description
Anatomical & pathological information of tissues & cells labelled by appropriate fluorescence probes.
Example: 5-Aminolevulinic acid (5-ALA) accumulates in cancer cells to identify tumour boundaries.
Multi photon absorption advantages & disadvantages for fluorescence emission
Disadvantages:
Needs high power excitation (use femtosecond laser with tight optical focus).
Advantages:
Large tissue penetration depth.
Longer light wavelength
Smaller energy used for excitation
Higher spatial resolution due to tight optical focus.
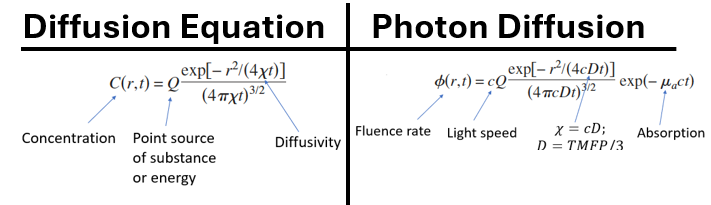
Purpose of diffusion theory for photon propagation
Can model photon propagation in tissue with diffusion theory.
Fluence rate = concentration.
Light diffusion = particle movement following concentration gradient.
Applicable to mediums with homogeneous optical properties distribution.
Comparing diffusion theory & Monte Carlo simulation
Diffusion theory has high-speed calculation but not applicable for heterogenous mediums.
Monte Carlo need more computational power (CPU & GPUs are evolving) but can simulate heterogenous mediums.
Monte Carlo Simulation properties
Model photon trajectory as a persistent random walk, with independent direction for all steps.
Each photon movement step direction depends on that of previous step.
Samples random variables (step size, scattering angle) from their probability distributions.
Monte Carlo Simulation process & uses
Consider medium as semi-infinite with multiple layers.
Each layer defined with different optical properties: optical absorption, reduced scattering, anisotropy factor g.
Output parameters: fluence distribution, total transmission , reflectance.
Can use output parameters to design light delivery & detection for optical imaging.
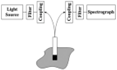
What are the different methods to measure absorption (only) of a sample?
Collimated Transmission Method
Spectrophotometer
Describe how Collimated Transmission Method works
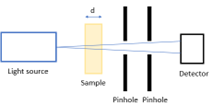
Measure original light intensity.
Shine narrow light beam through sample (e.g. liquid in a cuvette).
Only narrow collimated beam passes through 1st pinhole (spatial filter).
2nd pinhole blocks scattered light from reaching the detector.
Measure light intensity that comes out on other side.
Calculate attenuation coefficient (μt) - only works for negligeable scattering (𝜇_𝑎>>𝜇_𝑠).
Rearrange intensity equation to define μt
What is the difference between Spectrophotometer & Collimated Transmission Method
Automates collimated transmission measurement across various wavelengths giving absorption spectrum.
Different molecules absorb light at different wavelengths – can identify sample components by measuring absorption from variety of wavelengths.
Describe how this spectrometer configuration works
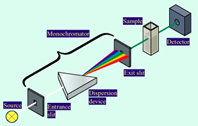
Rotate dispersion device– different wavelengths go through slit 1 at a time.
Detector records 1 intensity value per rotation step.
Describe how this spectrometer configuration works
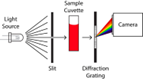
Dispersion device spreads colours across space – each pixel (corresponds to different spatial position) records a different 𝜆.
Camera (replaces single detector) captures entire spectrum in 1 camera exposure.
Image pixel intensity gives light intensity.
Optical dispersion devices & how they work
Prism (dispersion principle) - works with any light source (coherent/ non-coherent)
Glass refractive index depends on λ.
Different refractive angle for different colours causes dispersion.
Diffraction gratings - only works with coherent light source.
Composed of many parallel grooves etched on a surface.
Light reflects off adjacent grooves & travels at different path lengths.
Reflected beams interfere constructively when the path length difference is whole number of 𝜆.
Different colours emerge at different angles.
Coherent light source definition & how it is generated
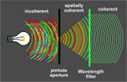
Coherent Light Source (e.g. laser) is a point source.
Light waves have same frequency, amplitude & phase.
Generated from incoherent light with a pinhole (spatial filter).
Pinhole is half of light’s wavelength so incoherent components can’t pass.
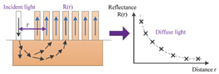
Oblique-incidence diffuse reflectance purpose & process

Measures scattering in turbid samples (e.g. tissue).
Narrow laser beam enters tissue at an angle & gets scattered.
Within 1st RMFP depth – photons lose direction memory & behave like they’re radiation from isotropic point source inside tissue.
Point source is horizontally displaced from surface entry point – beam entered at angle.
Diffuse reflectance – light diffuses outward & exits surface is in broad non-symmetric glow.
Glow peaks to one side due to source point offset.
Calculate reduced scattering coefficient of sample from depth of isotropic point source (Δx).
Oblique-incidence diffuse reflectance assumptions
Approximate sample as semi-infinite – sample is large enough to avoid boundary effects affecting photon diffusion.
Optical absorption << optical reduced scattering.
Oblique-incidence diffuse reflectance experimental setup
Collimated laser beam incident obliquely on tissue surface.
Diffuse reflectance light captured by CCD camera & sent to computer for processing.
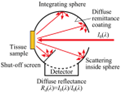
Integrating sphere method properties
Hollow sphere with inner wall coated in highly scattering, no absorption material.
Incident light from input point is reflected many times – becomes equally distributed on inner surface.
Detector place anywhere on wall measures signal proportional to total light flux inside sphere (regardless of original light direction).
Can measure optical properties of tissue samples (light scattered after entering tissue).
Process of calculating scattering & absorption coefficients with integrating sphere
Transmission measurement:
Light passed through tissue sample (placed at entrance port)
Measure total light flux transmitted.
Reflection measurement:
Collimated light inside integrating sphere directly illuminates tissue sample (placed at input port).
Measure total flux of diffuse reflectance.
Use Inverse Monte Carlo or inverse adding doubling algorithm to calculate sample’s μ_s, μ_a from total transmittance & reflectance values.
Limitations of collimated transmission method
Only measures optical attenuation coefficient.
Can’t measure optical absorption & scattering coefficients simultaneously.
Works when sample has very low optical scattering & is relatively thin.
Has only 1 scattering event: sample thickness << optical mean free path.
Types of optical spectroscopy methods
Methods: Time-resolved & spatially resolved.
Both use optical fibres.
Process of time resolved optical spectroscopy

1 fibre injects short light pulse into tissue.
2nd fibre placed at distance R (few mm-cm) on surface collects light that diffuses out.
Temporal Point Spread Function (TPSF) - collected signal over time.
Classify photons based on arrival time at detection fibre.
Fit TPSF to analytical solution of diffuse equation and extract 𝜇_𝑎 and 𝜇_𝑠′.
Photon types definitions & factors affecting diffuse component shape on graph:
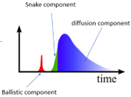
Ballistic photon – barely scattered & took most direct path.
Quasi-ballistic (snake) – scattered a few times & arrive later.
Diffuse photons (form majority) – scattered many times & arrive last.
Diffuse component shape:
Absorption coefficient damps tail amplitude.
Scattering coefficient broadens peak.
Process of spatially-resolved Spectroscopy
1 fibre delivers 1 continuous light wave (light source).
Multiple fibres collect light – placed at different distances to light delivery fibre.
Use diffusion theory to estimate optical absorption & scattering from light intensity data at different distances.
Using white light source with dispersion device can measure optical properties at a range of wavelengths - represents spectra of tissue.
Light transmission process of optical fibres
Core refractive index > cladding refractive index.
Transmits light via multiple total internal reflections.
Optical fibre types
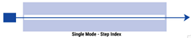

Single-mode fibre (core diameter < 10um) – light has 1 trajectory.
Travelling coherent light remains coherent.
Multimode fibre (large core diameter) – depend on refractive index profile across core.
Light follows many different trajectories.
Travelling coherent light doesn’t remain coherent – light phases vary with spatial locations within fibre distal end.
Not used for microscopy devices - non-optimum light focus
Types of multimodal fibres & properties
Step index fibre has uniform refractive index in core.
Graded index fibre has non-uniform refractive index in core.
Highest refractive index in axis that gradually decreases towards cladding.
Types of spectroscopy modalities
Fluorescence spectroscopy
Raman spectroscopy
Combined Raman & fluorescence spectroscopy
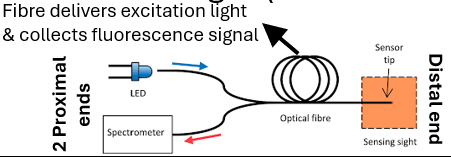
Fluorescence spectroscopy process
Identifies tissue types based fluorescent signals emitted when illuminating them with specific wavelengths of light.
Broadband light source used as excitation light source.
Dispersion device separates & scans across different light 𝜆.
Dispersion device placement can be: on light source, either/both detector sides.
Optical filter – separate fluorescence from excitation light (have different 𝜆).
Raman Spectroscopy properties & uses
Uses change in wavelength from excitation light to differentiate materials (Raman scattering).
Used to analyse gas, liquid, solid materials & biological tissues (e.g. tissue types & diseases).
Similar instrumentation to fluorescence spectroscopy – can be combined into dual modality system.
Used in breast tumour diagnosis – benign & cancerous tissue spectra are different in terms of peaks & intensities.
Combined Raman & fluorescence spectroscopy properties
Generate Fluorescence & Raman signals simultaneously.
Differentiate between fluorescence & Raman signals by varying excitation wavelength.
Each chromophore responds differently to different λ for both Raman & Fluorescence signal generation.
Conventional & optical biopsy process & disadvantages
Optical biopsy - light used to provide real-time tissue diagnosis without tissue extraction need.
Conventional biopsy process:
Insert needle into human to extract interest tissue.
Tissue is stained, sliced for histopathological examination.
Diagnosis is made.
Disadvantages:
Time consuming.
Sample structures are distorted during process.
Inaccurate tissue diagnosis if the tissue is extracted at the wrong position.
Phantoms definition & purposes
Tissue mimicking phantoms are tissue surrogates that serve different purposes for imaging system development.
Purposes:
Design & development of imaging systems.
System performance evaluation
Standardization & quality control
Training junior medical doctors.
Surgical planning
Requirements for optical phantoms in medical imaging
Optical absorption & scattering properties must be well-controlled & tuneable.
Real tissues are impossible to replicate as properties vary with tissue type, depend on wavelength, are complex & heterogeneous.
Focus on application-specific properties, so design the phantoms to match properties at a specific wavelength.
Required application dependent properties for tissue phantoms
Properties must be replicated if relevant:
Molecular of specific interest (e.g. fluorophores).
Dynamic properties (e.g. blood flow).
Functional properties (e.g. oxygen saturation)
Mechanical properties (e.g. elastic properties).
Thermal properties
What are the different types of liquid phantoms?
What optical properties do they control and how?
Intralipid - intravenous fat emulsion.
Well characterised optical scattering properties - controlled by concentration of fat microdroplets with different refractive index to surrounding water.
Consistent optical properties across different batches.
India ink
Well characterized optical absorption properties - weakly dependant on wavelength but linearly dependent on concentration.
Stable over time
Can tailor optical absorption to match various tissue types for 1 wavelength.
How are intralipid phantoms used to evaluate image depth of different fluorescence dyes in fluorescence imaging?
Diluted intralipid simulates background tissue scattering.
Capillary filled with different fluorescence dyes is embedded at different depths within intralipid matrix.
Excitation light used to excite the sample.
Camera captures distribution of fluorescence emulsion.
Visualise maximum penetration depth through contrast of images acquired at different depths.
What are the different solid phantoms?
What optical properties do they control and how?
Agar and gelatine (fragile):
Optical absorption & scattering (very low initially) - controlled by amount of optical scattering particles & coloured dyes added.
Polyester & epoxy resin:
Mechanically stable.
Optical properties stable over several years - used in standardization.
Epoxy resin - 3D printable (from MRI scans) to make anatomically realistic optical phantoms, or mouldable.
What are the properties of the different hybrid phantoms and how are their optical properties controlled?
Gel wax (tissue mimicking material):
Soft, non-toxic, mechanical (young’s modulus very close to fatty tissue) & acoustic properties are similar to tissues.
Optically transparent (controlled by additives) - optical absorption tuned by coloured inks, optical scattering tuned by TiO2 particles and acoustic properties tuned by paraffin wax.
What are the different types of phantoms and when are they used?
Liquid phantoms - used for simple geometries.
Solid phantoms - used for complex geometries.
Need to measure fabricated phantom’s optical properties before use in imaging.
Hybrid phantoms - used for multiple purposes or multiple imaging modalities.
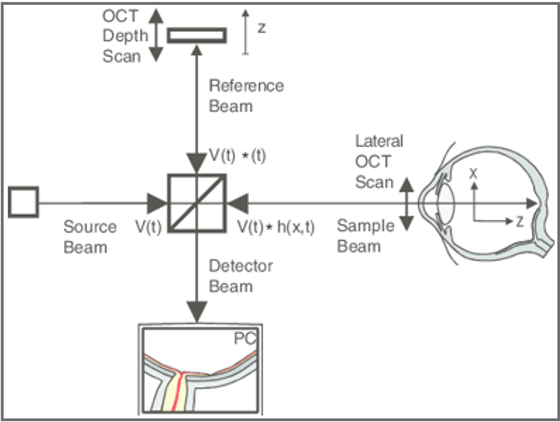
What Optical Coherence tomography and how does its process work?
Optical coherence tomography (1-2mm imaging depth) - relies on detection of back reflected light waves.
Impractical to measure time of flight for light waves (very fast).
Used in ophthalmology - non-invasive retina diagnosis.
Process:
Beam slitter reflects light beam from light source.
Part of the beam will be reflected to a movable mirror (reference arm).
Part of the beam will be transmitted through beam splitter to imaging target (sample arm).
Light interference occurs when reflected light from mirror & imaging target are combined at detector site.
Obtain depth information by moving the mirror and keeping optical pathlength of reference and sample arm the same.
What is the process for ultrasound imaging?
Ultrasound transducers generate ultrasound waves.
Back reflected waves are received by same ultrasound probe.
Reflected ultrasound waves have varying intensities due to varying acoustic impedance of tissues.
Signals from different depths arrive at different time points.
Use time of flight to resolve image target.
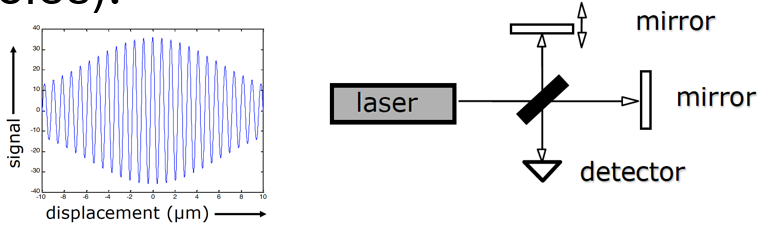
What are the properties for a monochromatic light source in time-domain OCT?
Detector intensity – function of mirror displacement.
Constructive interference (increase intensity): optical pathlength difference between both arms within [-pi/2, pi/2].
Destructive interference (intensity decrease): optical pathlength difference between [pi/2, 1.5pi].
Occurs periodically with mirror displacement.
Can’t select signals from a particular depth for depth scanning.
![<ul><li><p>Detector intensity – function of mirror displacement.</p></li><li><p>Constructive interference (increase intensity): optical pathlength difference between both arms within [-pi/2, pi/2].</p></li><li><p>Destructive interference (intensity decrease): optical pathlength difference between [pi/2, 1.5pi].</p></li><li><p>Occurs periodically with mirror displacement.</p></li><li><p>Can’t select signals from a particular depth for depth scanning.</p></li></ul><p></p>](https://assets.knowt.com/user-attachments/2c27c373-28fc-4c8d-8994-3204bacfb69d.png)
What are the properties for a quasi-monochromatic light source in time-domain OCT?
Detector signal has peak at 0 displacement (same optical pathlengths).
Difference in optical pathlength: signal decreases.
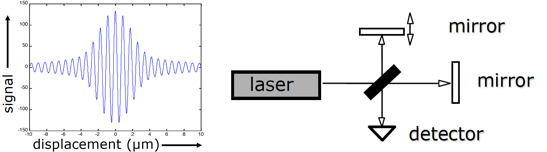
What are the properties for a broadband light source in time-domain OCT?
Signal at detector of light source, with gaussian profile, peak value & large bandwidth, has a Gaussian envelope.
Coherence length (determines axial/depth resolution): width of Gaussian envelope.
Can selectively detect the signal’s particular depth in sample.
Coherence length related to: central wavelength, light source bandwidth.
Interference only if pathlength difference < coherence length.
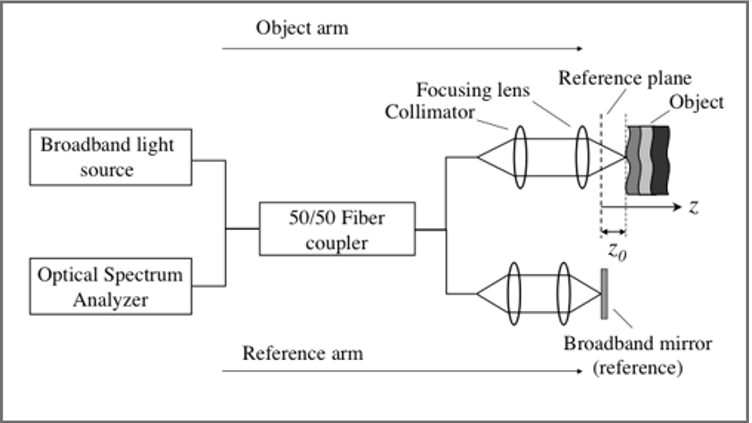
What are the properties of the OCT system?
Reference & sample arms are single mode fibres.
Collimator lens focuses light onto tissue & reference mirror.
Beam splitter is fibre coupler/circulator.
Assume biological tissues is a stack of imperfect mirrors.
Light intensity is a function of mirror displacement – depth-resolved scan of object at 1 spatial location on tissue surface.
Contrast occurs due to optical scattering of tissue.
What determines axial, lateral resolution & what is the imaging depth for OCT
Axial resolution (1-15um) : determined by coherence length
Lateral resolution: determined by size of focal spot.
Imaging depth (1-2mm)
Why is spectral domain OCT needed & what are its properties?
Spectral domain oct is 2 orders of magnitude faster than time domain (needs depth scan for each lateral position).
Consists of: static reference mirror & spectrometer to collect interference signal.
Depth is linearly proportional to light wavelength.
Diffraction grating spatially separates depth information into light colour.
Colour represents backscattered light intensity at different depths.
Describe the applications of OCT: Doppler OCT, Angiography OCT, Optical coherence elastography & OCT in cardiology
Doppler OCT:
measures blood flow velocity using Doppler frequency shifts - enables flow quantification in small vessels (capillaries).
Angiography OCT:
Visualise microvascular structure without contrast agents - high resolution mapping of blood vessels.
Optical coherence elastography:
measures tissue mechanical properties by tracking deformation under compression - used for diagnostic assessment of tissue stiffness.
OCT in cardiology:
Coronary arteries diagnosis - microstructural information of voluntary plaques in coronary arteries.
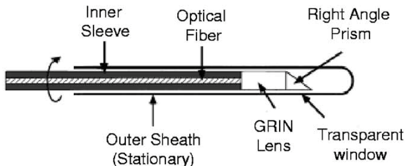
Fibre based endoscopic OCT purpose and components
Used for internal imaging inside body (e.g. blood vessels) & provides high-resolution cross-sectional images.
Uses a single-mode optical fibre to send & receive light.
Gradient index lens (GRIN) - focuses the light beam.
Right angle prism - redirects light sideways to enable side-view imaging.
Fibre based endoscopic OCT process
Light travels through the fibre to the probe.
Lens focuses the light.
Prism deflects light sideways into tissue.
Light reflects back from tissue.
Reflected light is collected by the same fibre.
Signal is combined with reference arm (rotates and pulls back) to form OCT image.
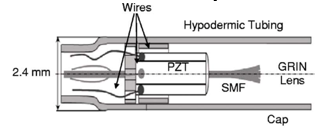
Forward looking probes for optical biopsy (OCT application)
Single-mode fibre with gradient index fibre coated at distal end for focusing.
Piezoelectric actuator (optical fibre distal end) - bends fibre tip for 3D imaging.
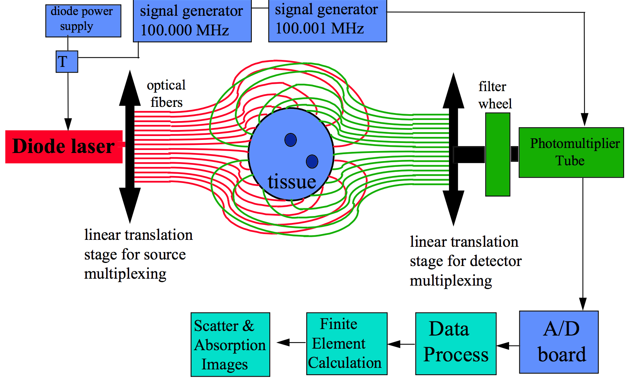
Diffuse Optical Tomography
Diffuse optical tomography uses near infrared light – penetrates several cm into tissue.
Object surrounded by multiple light transmitter & receiver pairs – distance between them determines spatial resolution.
Have time-resolved & spatially resolved methods to obtain spatial distribution of tissue optical properties.
How do image reconstruction algorithms recover optical properties distribution for DOT?
Image reconstruction algorithms are iterative models - recover optical properties distribution.
Forward model - predict detected light using initial guess optical properties (optical absorption, reduced scattering).
Based on diffusion theory.
Predicted optical properties compared with measured ones that minimize difference.
Why is Diffuse Optical Tomography useful for breast cancer imaging?
DOT has high optical contrast due to enhanced vascular density in tumour tissue from angiogenesis process.
X-ray: not sensitive for dense breast, generates ionizing radiation.
Ultrasound - poor soft tissue contrast, high false positive rate.
MRI - expensive, requires contrast agent for imaging vasculature.
Poor spatial resolution (5-10mm).
Diffuse Optical Tomography system for breast cancer imaging
Optical fibres arranged in ring shaped frame.
Some fibres transmit light & others receive.
3D images reconstructed from linear translation of imaging frame.
Diffuse Optical tomography properties that make it suitable for wearable devices
Portable & applicable to a range of environment.
Have bulky optical fibre arrangements.
Wearable design: modular light source & receiver unit design, where module has several sources & detectors in printable circuit board.
Future: continuous measurement of cerebral oxygenation, brain function & neurodevelopment.
Diffuse Optical Tomography in Neurovascular coupling in infants
Neurovascular coupling in infants is relationship between neuroactivities & vasodilation.
Cortical brain activation, neuro excitation generates increased metabolic demand leading to local changes in oxygen consumption, vasodilation, increased blood flow & oxygenation.
Effective indirect response of cortical functions - consistent hemodynamic response.
Provide information on functional cerebral development - intrinsic brain activity at rest.
Imaging changes in blood oxygen saturation - associated with neuron activities.
Strong correlation with fMRI
Soft tissue contrast, spatial resolution, maximum imaging depth, function, non-ionizing radiation, data acquisition & cost of X-ray imaging
Soft tissue contrast = Poor
Spatial resolution = Excellent
Maximum imaging depth = Excellent
Function = None
Non-ionizing radiation = No
Data acquisition = Fast
Cost = Low
Soft tissue contrast, spatial resolution, maximum imaging depth, function, non-ionizing radiation, data acquisition & cost of Ultrasound imaging
Soft tissue contrast = Good
Spatial resolution = Excellent
Maximum imaging depth = Good
Function = Good
Non-ionizing radiation = Yes
Data acquisition = Fast
Cost = Low
Soft tissue contrast, spatial resolution, maximum imaging depth, function, non-ionizing radiation, data acquisition & cost of fMRI
Soft tissue contrast = Excellent
Spatial resolution = Good
Maximum imaging depth = Excellent
Function = Excellent
Non-ionizing radiation = Yes
Data acquisition = Slow
Cost = High
Soft tissue contrast, spatial resolution, maximum imaging depth, function, non-ionizing radiation, data acquisition & cost of optical imaging
Soft tissue contrast = Excellent
Spatial resolution = Mixed
Maximum imaging depth = Good
Function = Excellent
Non-ionizing radiation = Yes
Data acquisition = Fast
Cost = Low
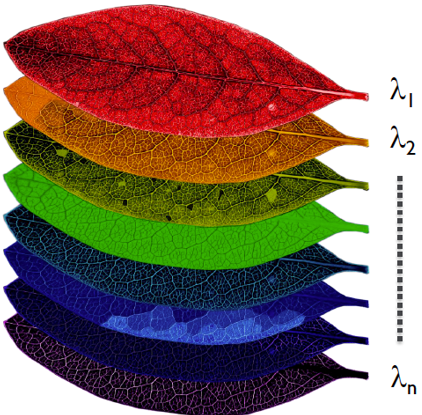
Spectral imaging definition & properties
Uses wavelength dependent light penetration depths of tissue.
Tissue illuminated at 400nm: see outmost skin layer.
Tissue illuminated at 600nm: see dermis & blood vessels.
Has many wavelength (>10): colour only has 3 (rgb).
Spectral imaging process
Multiple images taken by camera - when biological tissue is illuminated by light at different wavelengths.
Each image corresponds to a different wavelength.
Image processing algorithm - extracts tissue’s quantitative information for analysis
Spectroscopy definition & spectral imaging categories
Spectroscopy - spectral imaging at particular spatial location (pixel).
Categories of spectral imaging:
Multispectral imaging - less number & smaller range of wavelengths compared to hyperspectral.
Hyperspectral imaging
What are the 4 categories of spectral imaging instrumentation
Point scan: acquires 3D dataset of (x, y) spatial location & optical wavelength.
Line scan - acquires 2D dataset of 1 dimension spatial location, other for wavelength.
Wavelength scan
Snapshot imaging - acquires 3D dataset with 1 snapshot & no scans.
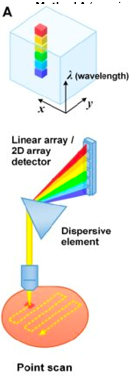
Describe point scan spectral imaging process & give spectral resolution & speed
White light focused as point on image target.
Raster scans point to form 2D image.
Reflected light from every scan position passes through dispersive element.
Linear array of photodetectors receives separated light at different wavelengths.
Spectral resolution: high
Speed: low
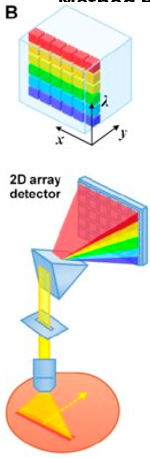
Describe line scan spectral imaging process & give spectral resolution & speed
White line focused as line on image target.
Translated to form 2D image.
Form 2D pattern by passing reflected light at every scan position through dispersive device
2D array of photodetectors measure 2D pattern
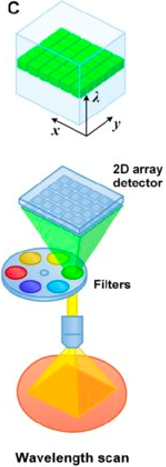
Describe wavelength scan spectral imaging process & give spectral resolution & speed
Entire object illuminated by white light source.
Camera captures reflected light.
Filter wheel separates colour.
Spectral resolution: low-high
Speed: medium/high
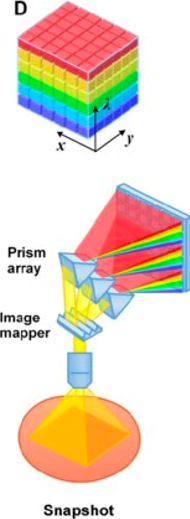
Describe snapshot spectral imaging process & give spectral resolution & speed
Tissue target illuminated by white light source.
Reflected light passes through image mapper & array of prisms.
Each line on object is converted to 2D pattern in 1 snapshot
Spectral resolution: low-high
Speed: high
Applications of spectral imaging
Differentiating tissue chromophores based on tissue optical absorption.
Chromophore concentration distribution using signal processing algorithms.
Conventional linear spectral unmixing algorithm - obtain chromophore concentration maps from spectra dataset by inverting reference spectra.
Blinded unmixing - when there’s no reference spectra & the main absorbing chromophore is not clear.
Oxygenation saturation maps - extracts oxygen saturation maps of superficial vasculature as haemoglobin optical absorption is highly dependent on oxygen saturation level.
Tumour removal - differentiate cancerous & non-cancerous tissue during surgical procedure.
Guiding brain tumour surgery
Define how spectral imaging is used in Chromophore concentration distribution
Obtained 3D spectral imaging data at any 𝜆 & spatial location is linear combination of different absorbing chromophores contribution.
Purpose of spectral imaging in Guided brain tumour surgery
Identify functional brain areas during simulation as blood oxygen saturation is an indirect indicator for brain activities.
Ambiguity in tumour delineation & brain shift in pre-operative MRI & CT.
Spectral imaging extracts fluorescence concentration from fluorescent dyes used to label the tumour cells to highlight the tumour region.
Process of blinded unmixing for spectral imaging
Use when there's no reference spectra and main absorbing chromophore not clear.
Apply component analysis principle (reduces original spectral dataset dimensionality).
Represent principal components (eigenvectors = reference spectra) & weight (chromophore concentration).
Properties of photoacoustic imaging & definition of photoacoustic effect
Photoacoustic imaging - has scalable spatial resolution & imaging depth.
Photoacoustic effect - modulated sunlight striking a material produces sound.
Photoacoustic imaging process
Short laser pulse is delivered to tissue surface.
Light propagates diffusely into the tissue.
Light-absorbing structures (e.g. haemoglobin, melanin) absorb a fraction of the energy.
Absorbed energy causes a tiny, rapid temperature rise (1/1000 of a degree).
Thermal expansion launches broadband ultrasound waves in MHz range.
Initial pressure waves travel to surface & are detected by ultrasound transducers to form images of absorbing structures.
Types of Photoacoustic microscopy (PAM)
Optical Resolution photoacoustic microscopy (ORPAM) - optical focusin
Acoustic-resolution PAM (ARPAM) – acoustic focusing.
Optical Resolution photoacoustic microscopy (ORPAM) process
Focus excitation light using objective lens & correction lens to a tight focal spot.
Acoustic signals generated & deflected by the interface between the 2 prisms.
These are received by a focused ultrasound transducer.
Generated time-varying acoustic signals can be converted to depth-scan based signal time of flight.
Optical Resolution photoacoustic microscopy (ORPAM) properties
Lateral resolution determined by optical focal spot size.
Axial resolution determined by ultrasound detector bandwidth.
Imaging depth ~1mm.
No staining/tissue processing required – optical absorption contrast is endogenous (e.g. haemoglobin, melanin).
Acoustic-resolution Photo Acoustic Microscopy (ARPAM) process
Tissue target illuminated by quasi-focused light beam.
Focused single element US detector scans over tissue target in 2D.
Acoustic-resolution Photo Acoustic Microscopy (ARPAM) properties
Lateral resolution determined by size of acoustic focus (few tens of 𝜇𝑚).
Axial resolution determined by bandwidth of ultrasound detector.
Imaging depth (less acoustic scattering): 3-5mm.
How can Photo Acoustic Microscopy be used to visualize oxygen saturation of blood haemoglobin?
By taking multi wavelength measurements.
Haemoglobin absorption changes with oxygen-saturation level.
Haemoglobin absorption is wavelength dependent.
Signal amplitude is product of local optical fluence & optical absorption coefficient.
Can measure oxygen saturation of individual blood cells at high speed to study metabolism dynamics of RBC.
Photoacoustic tomography process
Acoustic light is delivered and diffusely propagates into tissue.
Ultrasound waves generated & received by an array of US detector.
Can use 1 element detector scanned mechanically to act as array.
Spatially resolve object using speed of sound & time of flight of acoustic signals.
Apply reconstruction algorithm to map signal back into 2D/3D image.
Requirements for achieving ideal tomographic reconstruction
Ultrasound scanning must enclose the resource region to fulfil the required 4pi solid angular aperture.
Use representative detection geometries.
Describe a hemispherical modelling geometry
Hundreds of ultrasound detector elements are distributed in inner surface of hemispherical tank.
Hemispherical tank is filled with water as an acoustic coupling medium.
Illuminate the subject with a light delivered through a transparent window at bottom of tank.
Describe a planar modelling geometry
Uses ultrasound sensor based on Fabry-Perot interferometric cavity.
FP cavity has 2 dielectric mirrors separated by a thin polymer spacer (1/4 wavelength of probe light).
Incident ultrasound waves compress the spacer, shifting the cavity resonance & changing the reflectivity.
Focused interrogation beam is raster-scanned over sensor to read out pressure at each point, creating a dense virtual detector array.
Advantages of planar geometry
Broadband detection, large acceptance angle.
Properties of clinical ultrasound arrays (photoacoustic Tomography)
Use conventional clinical ultrasound imaging probe:
Dual-mode photoacoustic & ultrasound imaging system.
Provides both function, molecular and structural tissue information.
Applications of Photoacoustic Tomography
Breast cancer diagnosis - detect photoacoustic signals from tumour (stronger than that of surrounding tissue).
Detect vulnerable plaques (rich in lipid) in coronary arteries.
Obtain photoacoustic imaging from exogeneous contrast agents.
Process of using Photoacoustic Tomography to detect vulnerable plaques in coronary arteries
Side-looking optical fibre delivers 1210nm light.
Single-element ultrasound transducer sits alongside the fibre.
Probe is rotated & pulled back through artery to get 3D cylindrical dataset.
Ultrasound provides vessel wall structure & photoacoustic maps lipid distribution in plaque.
Used to guide stent placement & risk stratify plaques without biopsy.
How does Photoacoustic Tomography obtain photoacoustic imaging from exogeneous contrast agents?
Contrast genes contain signalling compound to generate US, target ligand that reacts with interest tissue.
Example: methylene blue, indocyanine green.