2.1 Demand & supply
1/48
There's no tags or description
Looks like no tags are added yet.
Name | Mastery | Learn | Test | Matching | Spaced | Call with Kai |
|---|
No analytics yet
Send a link to your students to track their progress
49 Terms
What is the price mechanism
The means of allocating resources in a market economy (self-regulating)
What is demand
The quantity of a product that consumers are willing and able to buy at different prices per period of time, other things equal, ceteris paribus
What is effective demand
The quantity buyers are willing and able to purchase at different prices per period of time, ceteris paribus. Desire must be backed by ability to pay.
- Demand that is supported by the ability to pay
What is notional demand
Where buyers may want to buy a product but which is not always backed up by the ability to pay
How does effective demand differ from notional demand
Notional demand is wanting a product; effective demand is want + ability to pay.
Only effective demand appears on the demand curve.
What is individual demand
The quantities a single buyer is willing and able to purchase at different prices over a given time period.
What is market demand and how is it derived
The total quantity demanded by all buyers at different prices, found by horizontal summation of individual demand curves.
Why does a demand curve slope downwards
Because of an inverse relationship between price and quantity demanded: as price falls, quantity demanded rises due to income and substitution effects (other things equal).
What is a demand schedule and how does it link to the curve
The data from which a demand curve is drawn on a graph
- A table of prices and quantities demanded per period.
Plotting the pairs and joining the points gives the market demand curve (linear for simplicity, but can be curved).
What key features define the demand curve in the text
It shows a continuous, time‑based relationship; movements along the curve are changes in quantity demanded caused by price changes, ceteris paribus.
Exam tip – demand
Do not confuse demand (the whole curve/schedule) with quantity demanded (a point on the curve). A price change causes a movement, not a shift.
What are the determinants of demand ( 6 non‑price factors)
Income
2. Prices of related goods (substitutes/complements)
3. Fashion, taste and attitudes (including advertising)
4. Population and demographics
5. Expectations
6. Seasonal factors.
In general what is the relationship between income and demand
Positive relationship
- A increase in the ability to pay usually leads to an increase in demand
- This is the case of normal goods
How does income affect demand for normal vs inferior goods
Normal goods: income ↑ ⇒ demand shifts right. (positive relationship)
Inferior goods: income ↑ ⇒ demand shifts left. (negative relationship)
How do substitutes and complements affect demand
Substitute’s price ↑ ⇒ demand for the good rises.
Complement’s price ↑ ⇒ demand for the good falls.
What are substitutes
Alternative goods that satisfy the same want or need
What are complements
A good consumed with another (joint demand)
How do tastes, population, expectations, seasons affect demand
Favourable tastes, larger population, expected future price rises, or seasonal peaks shift demand right; the opposite shifts left.
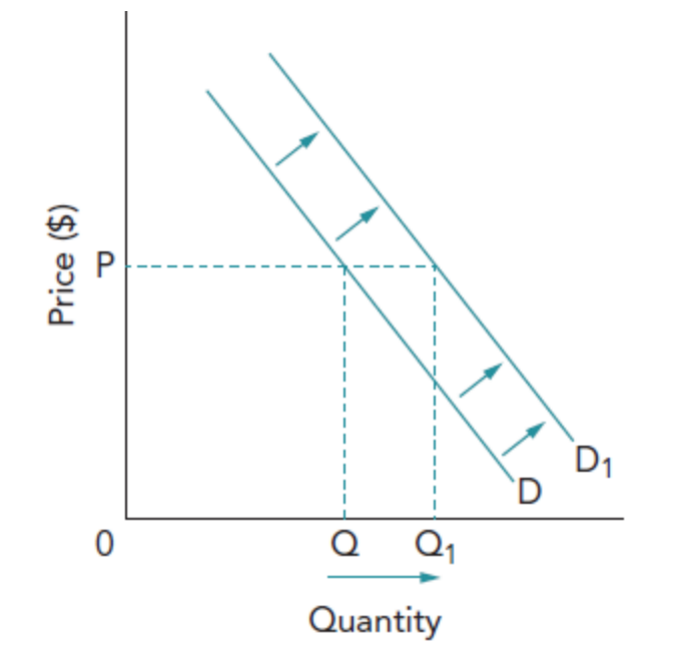
What is an increase in demand (diagram) and what causes it (7)
A rightward shift of the demand curve, caused by:
1. higher income (for a normal good)
2. higher substitute prices
3. lower complement prices
4. favourable tastes
5. population growth
6. expectations of higher future prices
7. seasonal boosts.
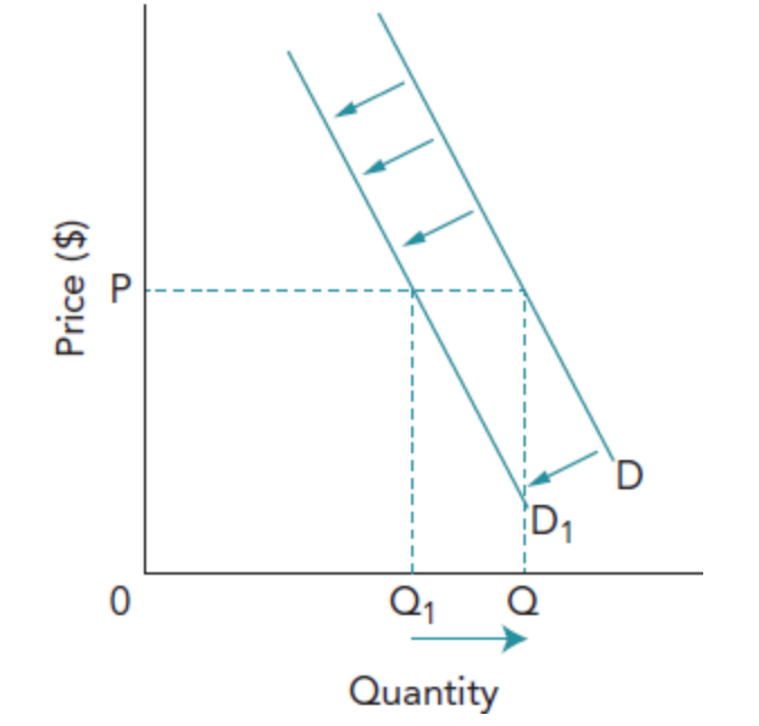
What is a decrease in demand (diagram) and what causes it (6)
A leftward shift due to:
1. lower income (normal good)
2. lower substitute prices
3. higher complement prices
4. unfavourable tastes
5. population decline
6. adverse expectations.
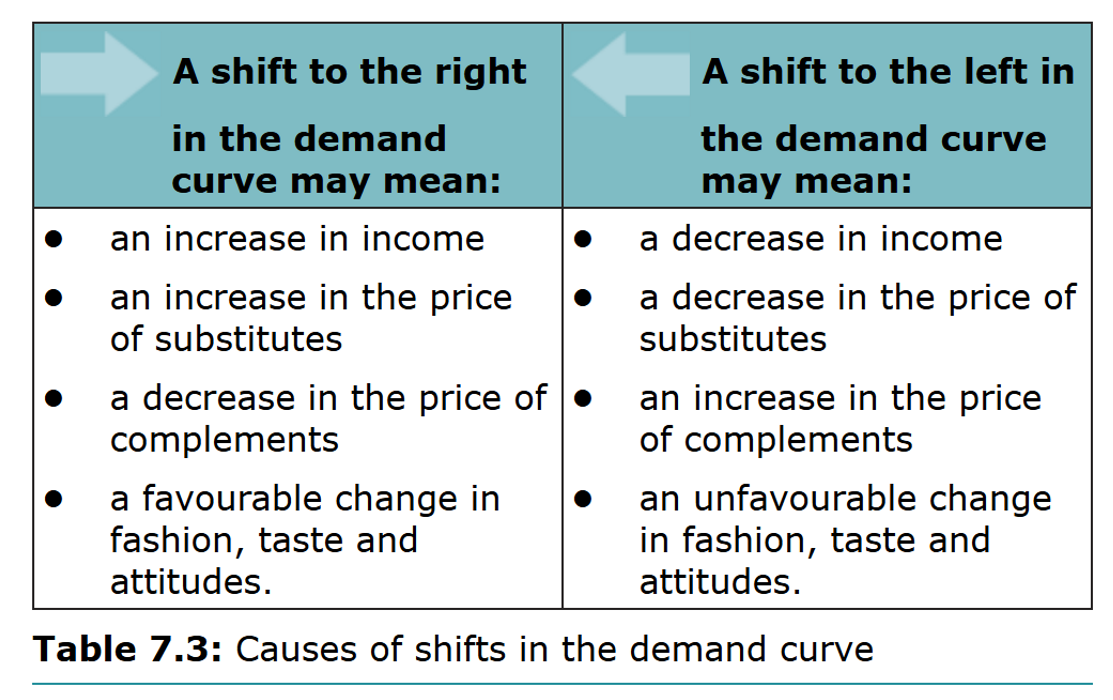
Causes for shift in demand curve table
What is supply
The quantity of a product that producers are willing and able to sell at different prices within a period of time, other things equal, ceteris paribus
What is the supply chain
All the stages of a product's progress from raw materials, production and distribution until it reaches the consumer
What is individual supply
The quantities a single seller is willing and able to offer at different prices per period.
What is market supply and how is it derived
The aggregate quantity supplied by all sellers, found by horizontally adding individual supply curves.
What is the supply curve
A line plotted on a graph that represents the relationship between the quantity supplied and the price of the product
Why does a supply curve slope upwards
Because of a direct relationship between price and quantity supplied: higher prices give greater incentive to produce and cover marginal costs.
Why are market curves often more elastic than individual ones
Aggregating many buyers/sellers creates more scope to substitute and more capacity to respond, so the market quantity is typically more responsive to price changes.
What is a supply schedule and how does it link to the curve
A table of prices and quantities supplied per period. Plotting the pairs gives the market supply curve.
What key features define the supply curve in the text
It assumes other influences fixed; price changes cause movements up or down the curve (changes in quantity supplied).
Exam tip – supply
State the time period (“per week”, “per month”) and ceteris paribus when using a supply curve.
What are the determinants of supply (non‑price factors)
Costs of production (wages, raw materials, energy, transport
2. Technology/productivity
3. Size and nature of the industry (entry/exit)
4. Prices of other products (switching)
5. Government policy (indirect taxes and subsidies)
6. Other factors (e.g., weather in agriculture).
What are subsidies
Direct payments made by governments to producers of goods and services
How do taxes and subsidies affect supply
Indirect tax ↑ raises costs ⇒ supply shifts left.
Subsidy ↑ lowers costs ⇒ supply shifts right.
How do costs, technology and industry size affect supply
Costs ↑ ⇒ supply left; productivity/technology ↑ ⇒ supply right; more firms entering ⇒ supply right.
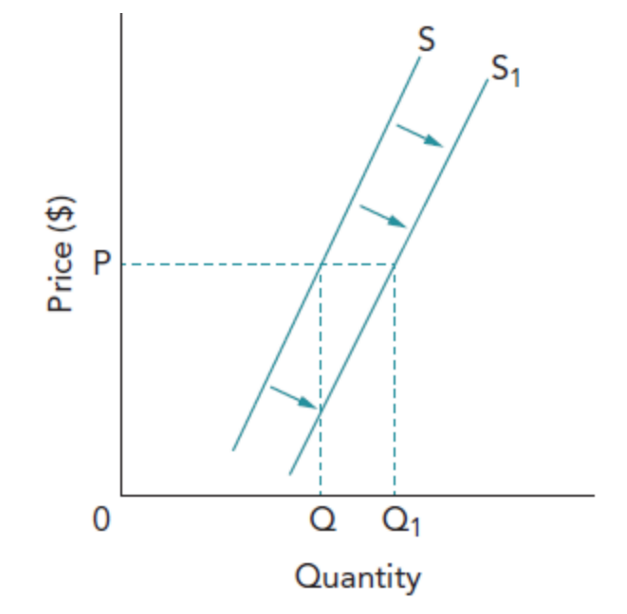
What is an increase in supply and what causes it (5)
A rightward shift from:
1. lower costs
2. better technology
3. more firms
4. lower indirect taxes or higher subsidies
5. favourable natural conditions.
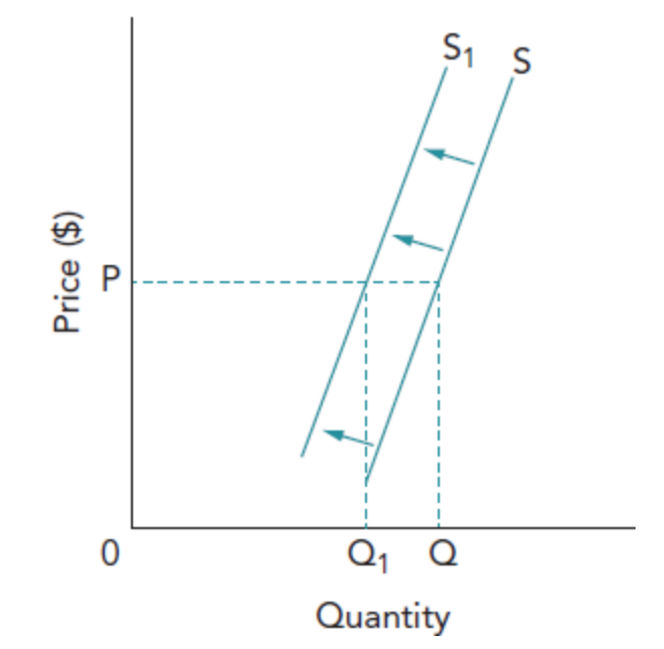
What is a decrease in supply and what causes it (5)
A leftward shift from:
1. higher costs
2. firm exit
3. higher indirect taxes/lower subsidies
4. unfavourable weather
5. rising prices of alternative outputs.
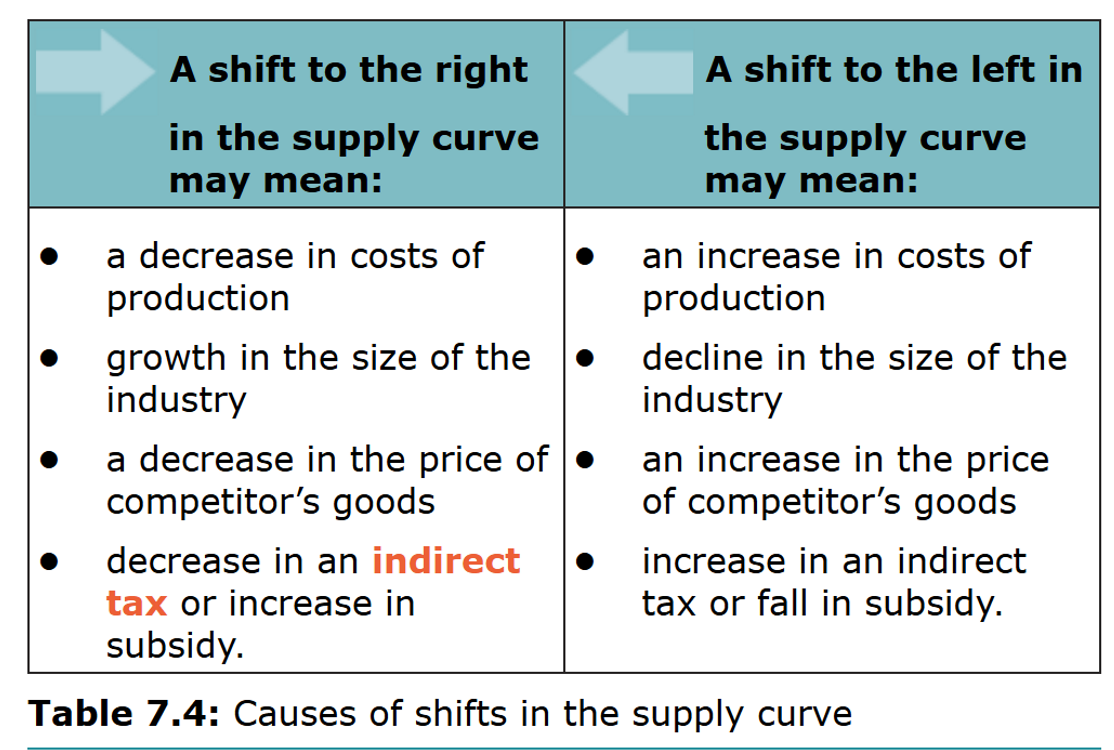
Causes for shift in supply curve table
What is a movement along the demand curve
A change in quantity demanded caused only by a price change for that good.
What is a movement along the supply curve
A change in quantity supplied caused only by a price change for that good.
What is the difference between a shift and a movement (demand)
Shift = change in non‑price determinant; movement = change in price of the good.
What is the difference between a shift and a movement (supply)
Shift = change in non‑price determinant; movement = change in price of the good.
What are extension and contraction of demand
With other things equal, a fall in price causes an extension (movement down the demand curve); a rise in price causes a contraction (movement up the curve).
What are extension and contraction of supply
A rise in price causes an extension (movement up the supply curve); a fall in price causes a contraction (movement down the curve).
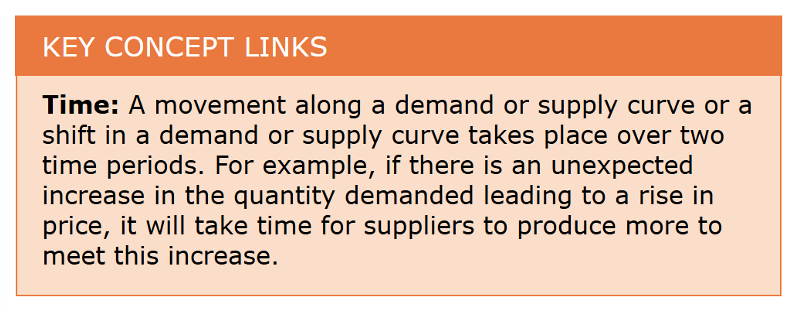
Key concept link
How do ‘fashion, taste and attitudes’ operate in demand
They reflect individual choice and advertising; what counts as a normal or inferior good can vary by income group.
What practical issues arise when building real‑world demand/supply schedules
Data are difficult to collect; relationships may be non‑linear; figures often represent estimates, so curves are stylised.
Why must curves reference a time period and the ceteris paribus assumption
Because quantities are flows per period, and isolating a single relationship requires other influences to be held constant.