year 2
1/31
There's no tags or description
Looks like no tags are added yet.
Name | Mastery | Learn | Test | Matching | Spaced | Call with Kai |
|---|
No analytics yet
Send a link to your students to track their progress
32 Terms
reporting psychological explanations
it is essential to describe the results as accurately and effectively as possible. also if all studies are written in the same standardised way then it is easier to replicate findings, check results and peer review. the basic requirements are to communicate: what was done, why was it done, what was found and what it means
the report takes the following format: abstract, introduction, method, results, discussion and references
abstract
150-200 words
allows the reader to get a picture of the study and its results
must very briefly mentions the aims, hypothesis, method, results and conclusions
introduction
begins with a review of previous research so the reader knows that other research has been done and understands the reasons for the current study
the focus of this research review should lead logical so the reader is convinced of the reasons for the particular research.
introduction should be like a funnel - beginning broadly and narrowing down to a particular research hypothesis
the researcher states their aims, research prediction and hypothesis
method
this section contains a detailed description of what the researcher did. it needs to be in enough detail that it could be easily and precisely replicated it must include:
design - the design is clearly stated e.g. laboratory experiment, repeated measures, IV?DV but all of the design decisions must be justified
participants - information about sampling methods and the people who took part in the study e.g. how many, ages, jobs etc.
apparatus - detail of any materials used that would be needed for a full replication
standardised procedure - this is a step by step description from beginning to end of everything that was done and everything that was said to participants to allow a full replication. this must include standardised instructions, debriefing, briefing
ethics - an explanation of how these were addressed within the study
results
the results section should summarise the key findings from the investigation and should include:
descriptive statistics - this is the key findings outlined in a straightforward way so that readers can ‘eyeball’ the data and should include tables, graphs, measures of central tendency and dispersion
inferential statistics - should include a choice of statistical test with justification, calculated and critical values, the level of significance and whether the test was one or two tailed. the outcome is explained in terms of acceptance or rejection of the experimental and null hypothesis
discussion
after the results section in the investigation report, the researcher will include a discussion of the results. this will include a discussion of:
summary of results - the results and what they tell us
relationship to background research - whether the study is in line with what the research studies quoted in the introduction suggest
limitations and modifications - strengths and weaknesses of the research and how it could be improved
implications and suggestions for further research
referencing
the full details of any journal articles or books that are mentioned in the research report are given
for journals - authors name, date, title of article, journal title, volume (issue number), page numbers
books - authors name, date, title of book, place of publication, publisher
nominal data
the simplest form of data, represented in the form of categories
is discreet in that only one item can appear in each category
doesn’t get a numerical score
ordinal data
data is put into some sort of order
does not have equal intervals
receives a numerical score
not standardised
memory tests are always ordinal
interval data
data has units with equal intervals between points
receive a numerical score
is standardised
the sign test
when to use?
- if a difference is predicted between two data sets
- the data is related e.g. a repeated measures design or matched pairs
- if it is nominal datahow to do a sign test?
- test the null hypothesis
- convert data into nominal data (subtract data form each other)
- add up all the + and -
- calculate an observed value (s value) which is the one with the fewest scores
- compare our answer with the critical value to see if our results are significant
- it states that the value of s must be equal to or less than the critical value to be significanthow to report the conclusion that can be drawn
- if the results are not significant then we accept the null hypothesis and reject the alternative hypothesis as the results are not statistically significant
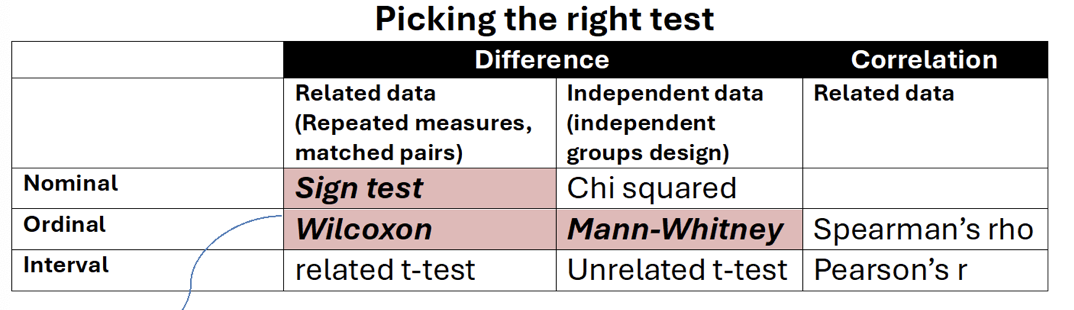
how to decide what test to use
difference or correlation - whether the research is testing for differences between groups
level of measurements - nominal, ordinal or interval
experimental design - related (repeated measures or matched pairs) or independent
inferential statistics
inferential statistics are tests that allow judgements (inferences) to be made about whole populations based on just the sample used in a study. we can’t obviously test everybody in the world so inferential statistics is a way of dealing with this issue. using inferential statistics allow us to see if there actually is a genuine effect and if there is then we can generalise to other people. if the results are judged to be caused by a genuine effect, they are called significant
null hypothesis
inferential tests allow us to reject or retain the null hypothesis. null hypotheses state that there is not significant different between the two conditions and that any difference is due to chance factors. if the null hypothesis is retained the research hypothesis (alternative hypothesis) must be rejected. if the null hypothesis is rejected then the alternative hypothesis is retained.
probability
even if tour results do ‘work’ we are not saying that we are 100% sure that the findings are significant. this is because there may be chance factors. we work this out using probability.
psychologists have tp decide how certain they want to be that results are not just down to chance. normally psychologists say they want to be 95% sure which means there is a 5% chance that the findings weren’t because of the energy drink but they just occurred by chance. we call this level of chance our level of significance. however, when a piece of research is socially sensitive or considering something like the effects of a new drug on health for instance, it is particularly important not to accept the study as significant if its not and was caused by change alone. in this instance, a 1% level of significance is likely to be used. this means that we are only prepared to accept a 1% chance or less of wrongly rejecting the null hypothesis.
level of significance
the level of significance is the point at which the researcher can claim to have discovered a significant difference (or correlation) within the data and can reject the null hypothesis and accept the alternative hypothesis. in psychology this is normally 5%
type 1 errors
when a null hypothesis is rejected when it should not have been. in other words, they have accepted that our results are down to chance, when in fact they are down to chance alone. the likelihood of a type 1 error mirrors the level of significance employed. also known as a false positive
type 2 error
occurs when a null hypothesis is retained when it should not have been. in other words, we have accepted that our results are down to chance, when they are in fact not, a type 2 error is often referred to as a false negative. it is more likely with a higher level of significance
assessing validity
face validity - a quick “eyeballing” where you just look over the questionnaire to see if on the face it looks like its measuring what its meant to
concurrent validity - this is when you use a well established, validated test to compare with your new test
improving validity
questionnaires
- review questionnaires or tests if when assessed they have low face or concurrent validity
- assure responses are anonymousExperimental research
- Use a control group so that the researcher is better able to assess whether changes in the DV were due to the IV
- Standardise procedures to reduce investigator effects and participant reactivity.
- Reduce demand characteristics by using double blind (research doesn’t know the aims) or single blind (participants don’t know the aims) procedures.
Observations
- Observations tend to have high ecological validity especially if covert.
- Make sure that behaviour categories are not too broad, overlapping or ambiguous.Qualitative methods
- Interviews and case studies that produce qualitative data are said to be higher in ecological validity because of the depth and detail involved being better able to reflect the participants reality.
- Interpretive validity (the extent to which a researchers interpretation of events matches the participant) can be demonstrated by using direct quotes and being coherent in reporting.
- Triangulation can be used to improve validity by using a number of different sources as evidence for example interviews with friends, family, personal diaries, observations etc.
assessing reliability of observations
use inter-observer reliability as a way of assessing how reliable an observation is. you need two or more observers to carry out an observation to ensure reliability. you compare their observation schedules or records to see if they are similar by correlating the observer’s scores. if there is a correlation of 0.8 or 80% then you can say it is reliable
improving observational reliability
always have more than one observer
have clearly defined (operationalised) and separate observational criteria
train observers do they know exactly what they are looking for
do a pilot study so you know the observers are applying the observational categories properly
assessing reliability of self-report techniques
split half method - assesses internal reliability by splitting a test in two and making the same participants do both halves. if the results are the same for both halves then it indicates the test has internal reliability
test-retest method - assesses external reliability by giving participants the same tests on two occasions with normally a week or two apart so they don’t remember the answers. if the results are the same then the external reliability is established
improving reliability
make a question clear and precise
pilot a questionnaire beforehand to check the questions are clear enough
use the same interviewer with each participant
assessing the reliability of experiments
Lab experiments are thought to be the most reliable as they can have the most carefully controlled procedure, instructions, conditions. So when looking at research you want to see if these things are all carefully controlled and that participants were all tested under the same conditions.
Also reliability could be to do with the measurement of the DV. For instance in Rutter’s research they used IQ tests as one of the ways to measure Romanian orphans progress so we would be looking at the reliability of these tests.
improving reliability
use the exact same procedure for all participants
use the same conditions for all participants
if repeated by other researchers they need to replicate the research in exactly the same way as the original
features of science
t - theory construction
h - hypothesis testing
e - empirical method
f - falsifiable
o - objective
r - replicability
k - Kuhn (paradigm shifts)
objectivity
the findings should not be influenced by any biases. to lessen the possibility of this unconscious bias researchers aim to:
- use standardised instructions
- fully operationalise variables
- use double blind technique
- use carefully controlled conditions
replicability
if it is possible to carry out the research again and find the same or similar results then the research is replicable. if a piece of research is not replicable then it is either fake or has methodological failings
falsifiability
Karl popper argued that a key criterion of a scientific theory was its falsifiability. a good scientific theory should have the possibility of being proved false and should stand up to hypothesis testing. popper believed that unfalsifiable theories were unscientific and called them pseudoscience. theories that survive attempts to be proved false become the strongest theories
paradigm shifts
Kuhn argued that scientific advancement occurs not through steady progress but instead by paradigm shifts. A change of paradigm, or scientific revolution, can occur when the evidence is mounting up against the existing paradigm; this is known as a paradigm shift. The new paradigm can explain not only all the findings that fitted the previous paradigm but also all the findings that did not fit in with it. Paradigm shifts can be swift but they do require scientists to significantly change their thinking about their subject.
An example of a paradigm shift would be Darwin’s theory of evolution. Previously it was believed god created all of the universe and all the animals within it but Darwin showed that humans are part of nature, not above it, and that all animal life, including human, is related by descent from a common ancestor
theory construction
Science tests theories. Initial observations (that are carefully arranged and unbiased) yield up information about the world which is then made into theories that try and account for this information. Predictions in the form of testable hypothesis are formulated and tested, producing data that can be statistically analysed to see if the theory can be refuted or falsified.
There are two schools of thought as to how you should construct your theory. Should it be straight after you observations (deductive model) or at the end once you have tested your hypothesis and drawn conclusions (inductive)