edexcel a level economics theme 3 diagrams
1/103
There's no tags or description
Looks like no tags are added yet.
Name | Mastery | Learn | Test | Matching | Spaced | Call with Kai |
|---|
No analytics yet
Send a link to your students to track their progress
104 Terms
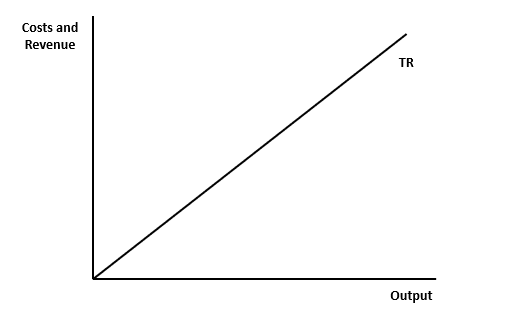
total revenue (perfect competition)
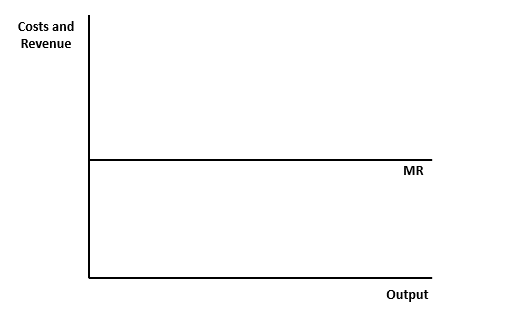
marginal revenue (perfect competition)
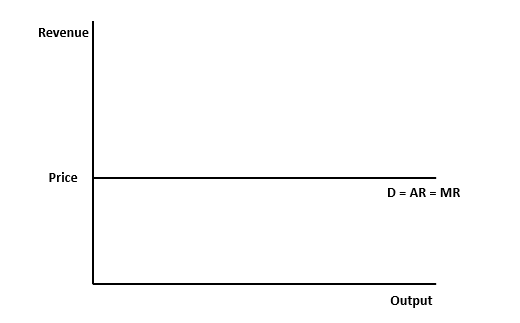
D = AR = MR ( perfect competition)
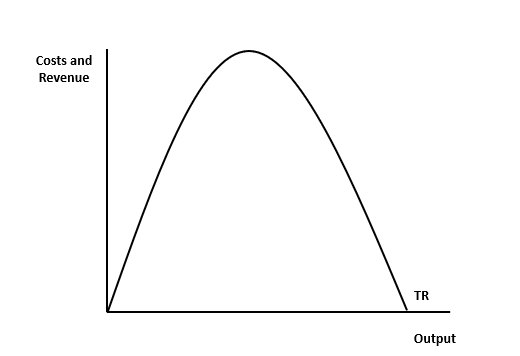
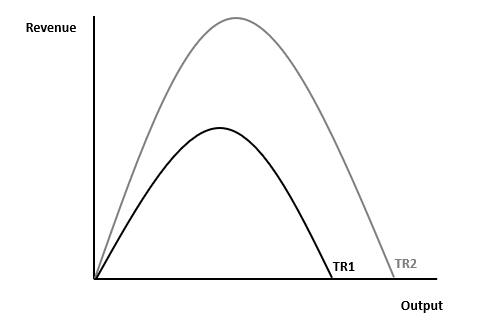
total revenue (imperfect market)
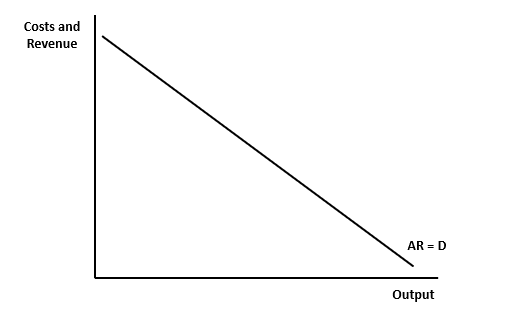
average revenue
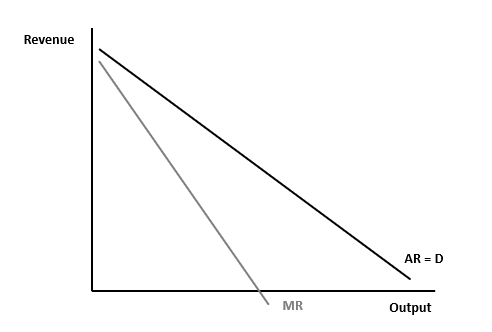
AR and MR (imperfect competition)
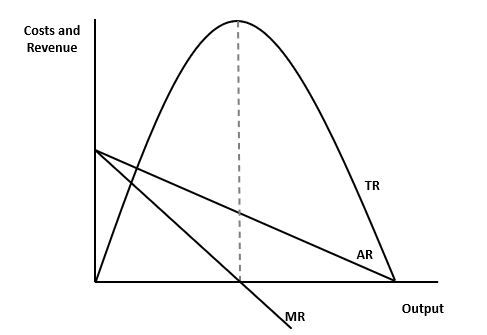
AR, MR, TR for price takers
PED shown on AR=D curve

increase in TR (imperfect competition)
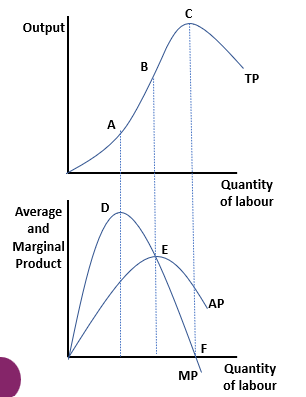
AP, TP and MP curves comparison
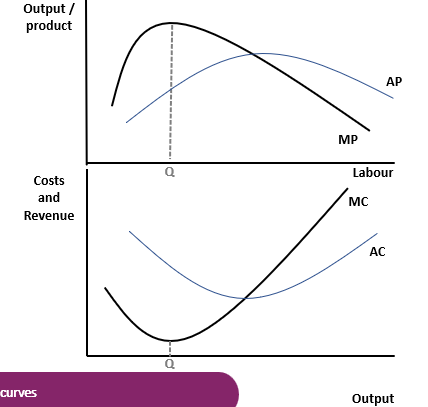
cost and product curves (used on most theme 3 diagrams)
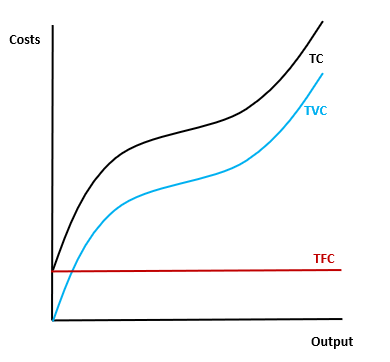
TFC + TVC = TC
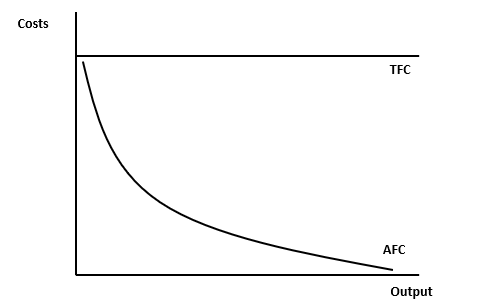
AFC = TFC/Q
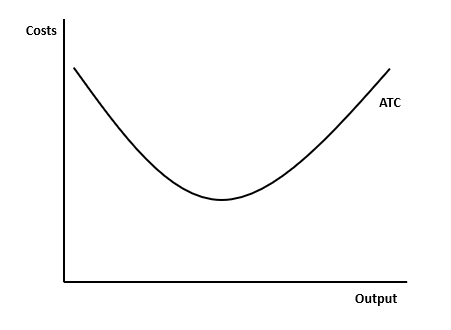
average total cost curve ATC = AFC + AVC
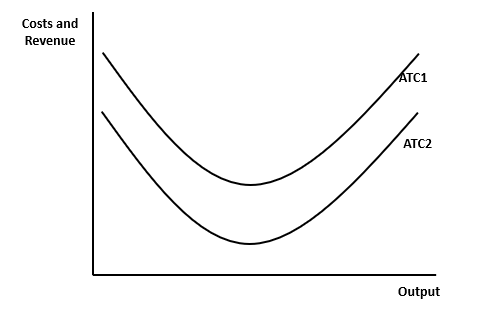
fall in average total costs
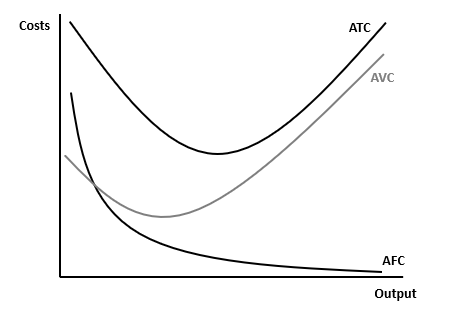
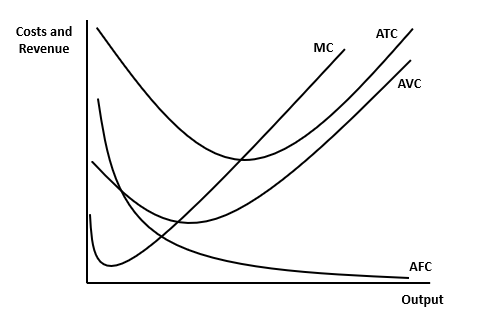
average fixed / variable and total cost curves
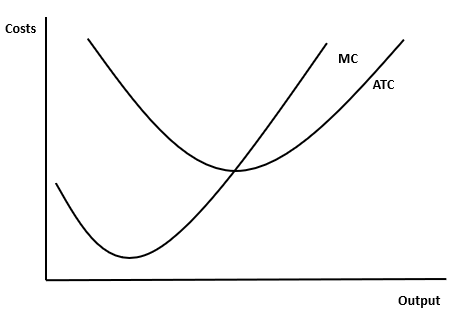
short run cost curves (MC always cuts ATC and AVC curves at their minimum points)
MC must cut ATC at its minimum point
the SRAC/LRAS envelope curve
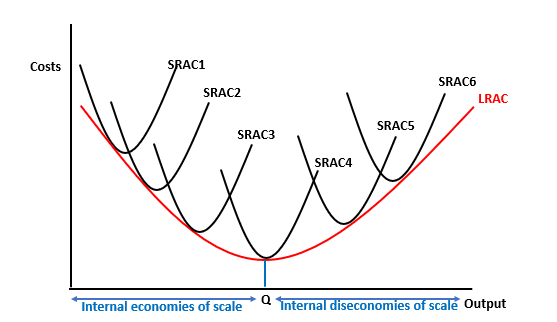
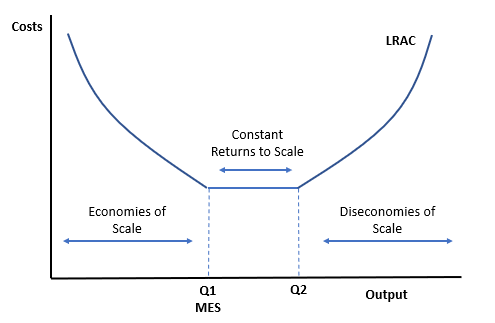
LRAC showing the returns to scale
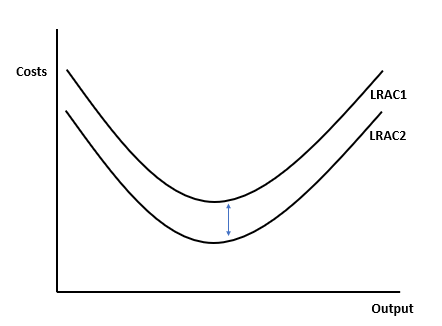
external economies of scale
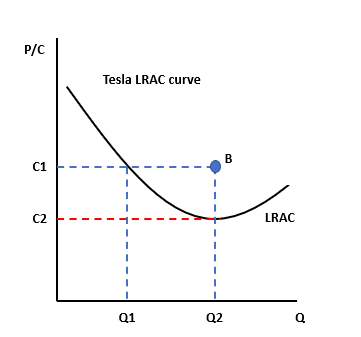
tesla LRAC curve
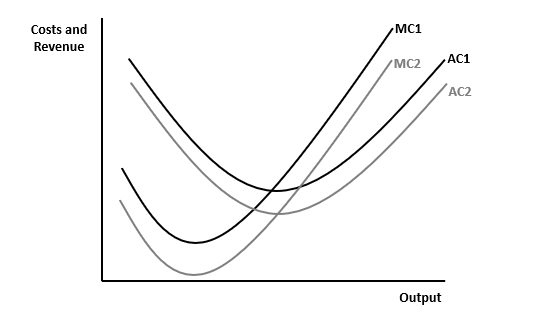
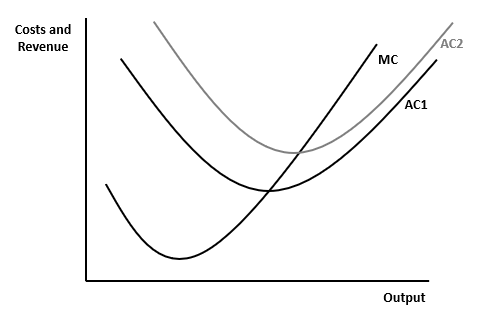
shift of MC and AC after a decrease in variable costs
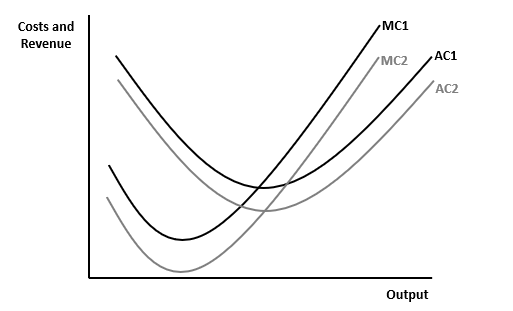
shift down in MC and AC after decrease in VC
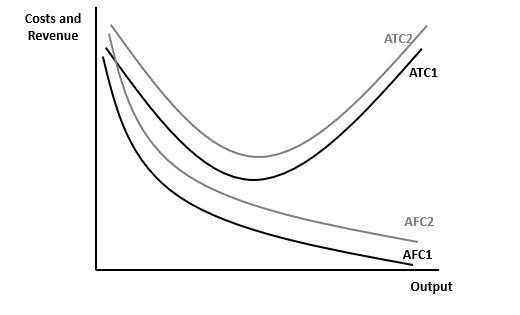
increase in FC impact on ATC (no change in MC)
increase in FC impact on AFC and ATC curve
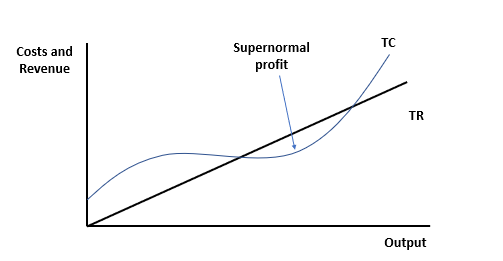
TC and TR for a price taker (perfect competition)
profit maximisation where MC = MR

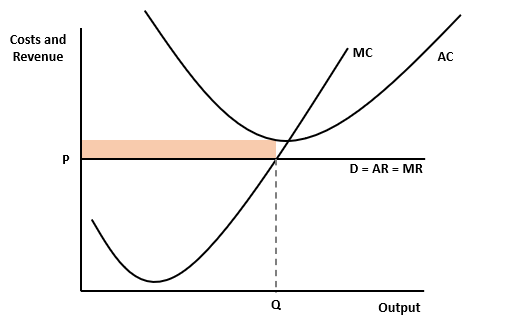
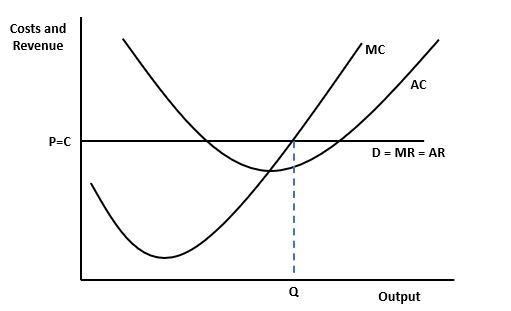
perfect competition - short run equilibrium
short run equilibrium (perfect competition)
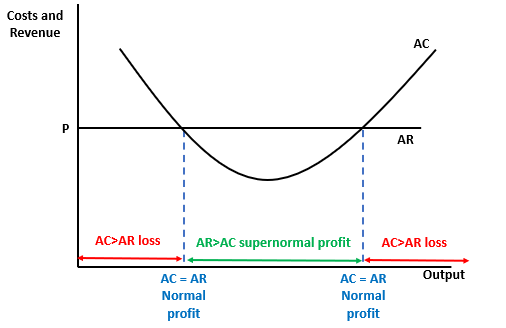
short run supernormal profits (perfect competition)
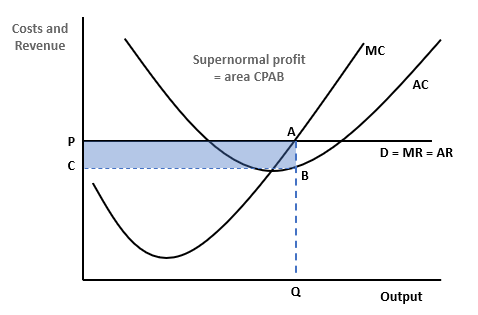
short run profit maximising equilibrium (perfect competition)
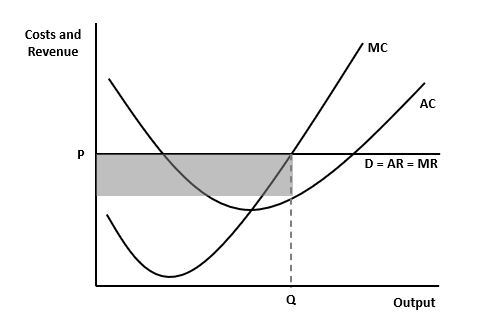
short run loss minimising equilibrium (perfect competition)