Forest Stats Midterm 2 Notes
1/49
There's no tags or description
Looks like no tags are added yet.
Name | Mastery | Learn | Test | Matching | Spaced | Call with Kai |
|---|
No analytics yet
Send a link to your students to track their progress
50 Terms
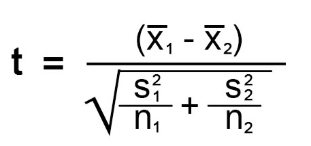
what is a t-test used for?
used to assess the statistical significance of differences between two means
what does the t-value measure?
it measures the size of the difference relative to the variation in your sample data
how is calculated t-value found?
through an equation
how is critical t-value found?
from the t-table
degree of freedom
n-1
if the calculated t-value is less than the critical t-value, then the null hypothesis is…
accepted—there is NO statistical difference between the means
if the critical t-value is less than the calculated t-value, then the null hypothesis is…
rejected—there IS a statistical difference between the means
a p-value set at 0.05 is
95% confidence
standard error=
mean +- t value * (s/n^0.5)
confidence interval =
mean +- standard error
when an initial sample doesn’t yield a useful estimate, what 4 possibilities should be considered?
- procedural or calculation error
- population is inherently variable and a sample cannot reduce the variation about the mean
- it might be necessary to subdivide the population to be sampled in a different way to reduce variation, ie keeping trees separate by species
- sample is too small and you need to keep measuring
sample size
n = ((s²)*(t²))/(e²)
options/methods for land measurement
- pacing
- hip chain
- GPS
- ultrasound
- tape or chain
- electronic distance meter or total station
pace
2 steps
Gunter’s chain
66 ft = 4 rods = 20.1 meters
Mile
80 chains = 5280 feet
Acre
660 chains = 43,560 sq ft
true north
aligns with the north star, the axis of earth’s rotation
compass measures direction from
magnetic north
declination
the angular difference between True North and Magnetic North
DD
decimal degrees
DMS
degrees minutes seconds
DD from DMS
DD = D + M/60 + S/3600
DMS from DD
D = integer part
M = integer of decimal part
S = 2nd decimal * 60
primary functions of GPS
- position and coordinates
- distance and direction
- travel progress reports
- accurate time measurements
what are the 3 segments of GPS?
1) space segment
2) control segment
3) user segment
forest stand
a community of trees that is more or les homogenous in composition, age, structure, spatial arrangement, and condition
stand parameters
species composition, height, age and growth, stand density, timber yield
100% cruise
used for scattered stands, high value stands, or small lots.
more accurate estimate of volume
high cost
BA/tree
0.005454(DBH²)
BA
sum of BA/tree * tree factor
tree factor/expansion factor
1/10th acre plot, 2 plots
TF/EF = 5
TF is constant for
area/plot centered
TF is variable for
probability proportional to size/variable radius plot
fixed area plots
probability proportional to frequency
advantages of circular plots
fewer decisions for trees near the plot boundary, no predetermined orientation, easier to correct slopover bias
advantages of line plot cruises
suitable for one person cruising, easy to spot check, allows for stratification by type/stand/area, and statistical analysis
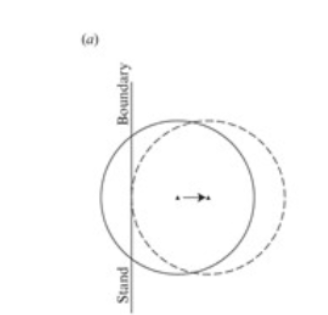
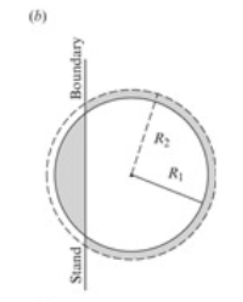
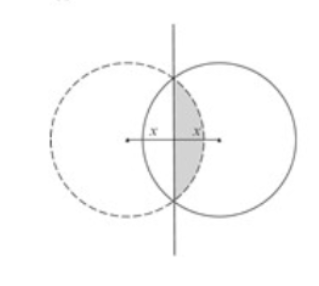
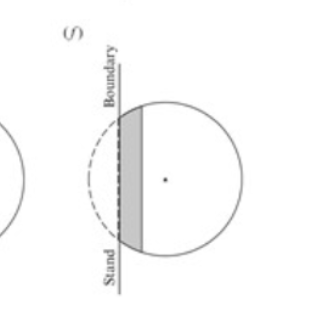
methods of boundary slopover correction
- plot shifting
- plot enlargement
- plot area adjustment
- half plot
- mirage method
- walkthrough method
plot shifting
plot enlargement
plot area adjustment
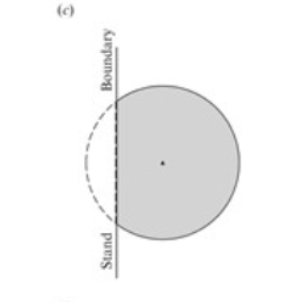
half plot
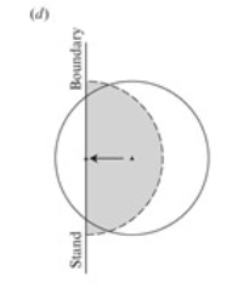
mirage method
walkthrough method
Trees Per Acre (TPA)
total number of trees for all plots * tree factor
strip cruising
sample areas are taken in continuous strips at uniform intervals and of uniform widths
advantages of strip cruising
less travel time between samples, fewer edge trees, safety
disadvantages of strip cruising
not great for statistical analysis, underestimates tree heights
recording equipment used for establishing plots
- compass and/or GPS
- clinometer or laser for determining slope
- D-tape
- 100 ft tape or hipchain
- flagging and/or paint
- prism or angle gauge for point cruising
- hypsometer
steps to establish a plot
1) locate plot center
2) mark center temporarily
3) plot size targets 5-12 trees per plot
4) use same plot throughout
5) plot radius checked with hipchain