AP Microeconomics: Graphs!
1/31
There's no tags or description
Looks like no tags are added yet.
Name | Mastery | Learn | Test | Matching | Spaced | Call with Kai |
|---|
No analytics yet
Send a link to your students to track their progress
32 Terms
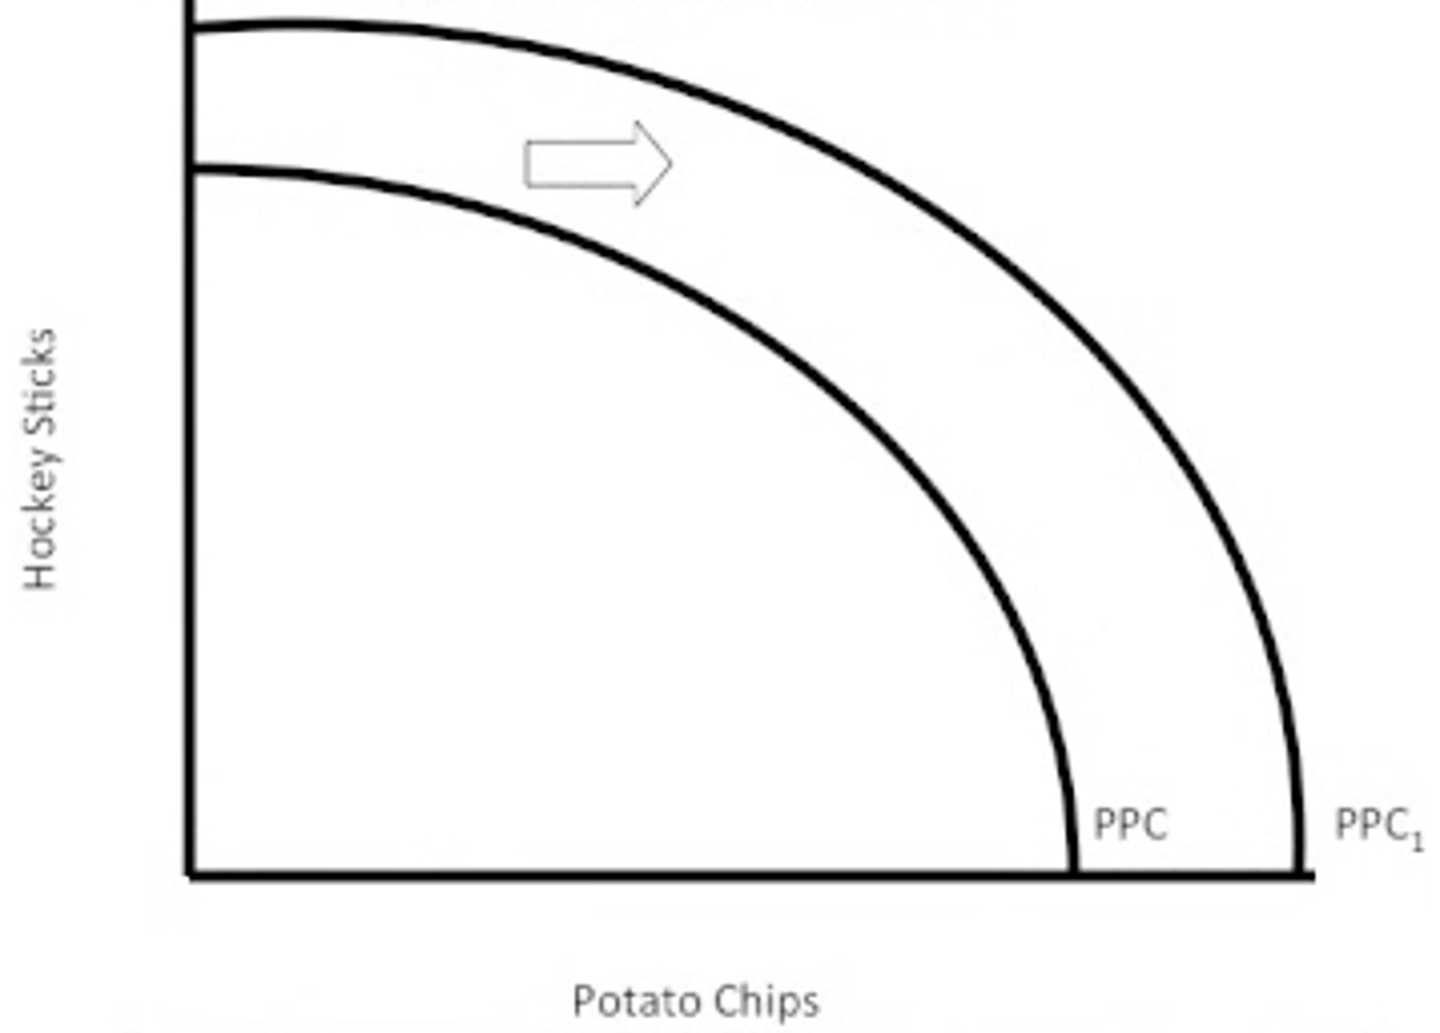
Production Possibilities; right shift indicates economic growth
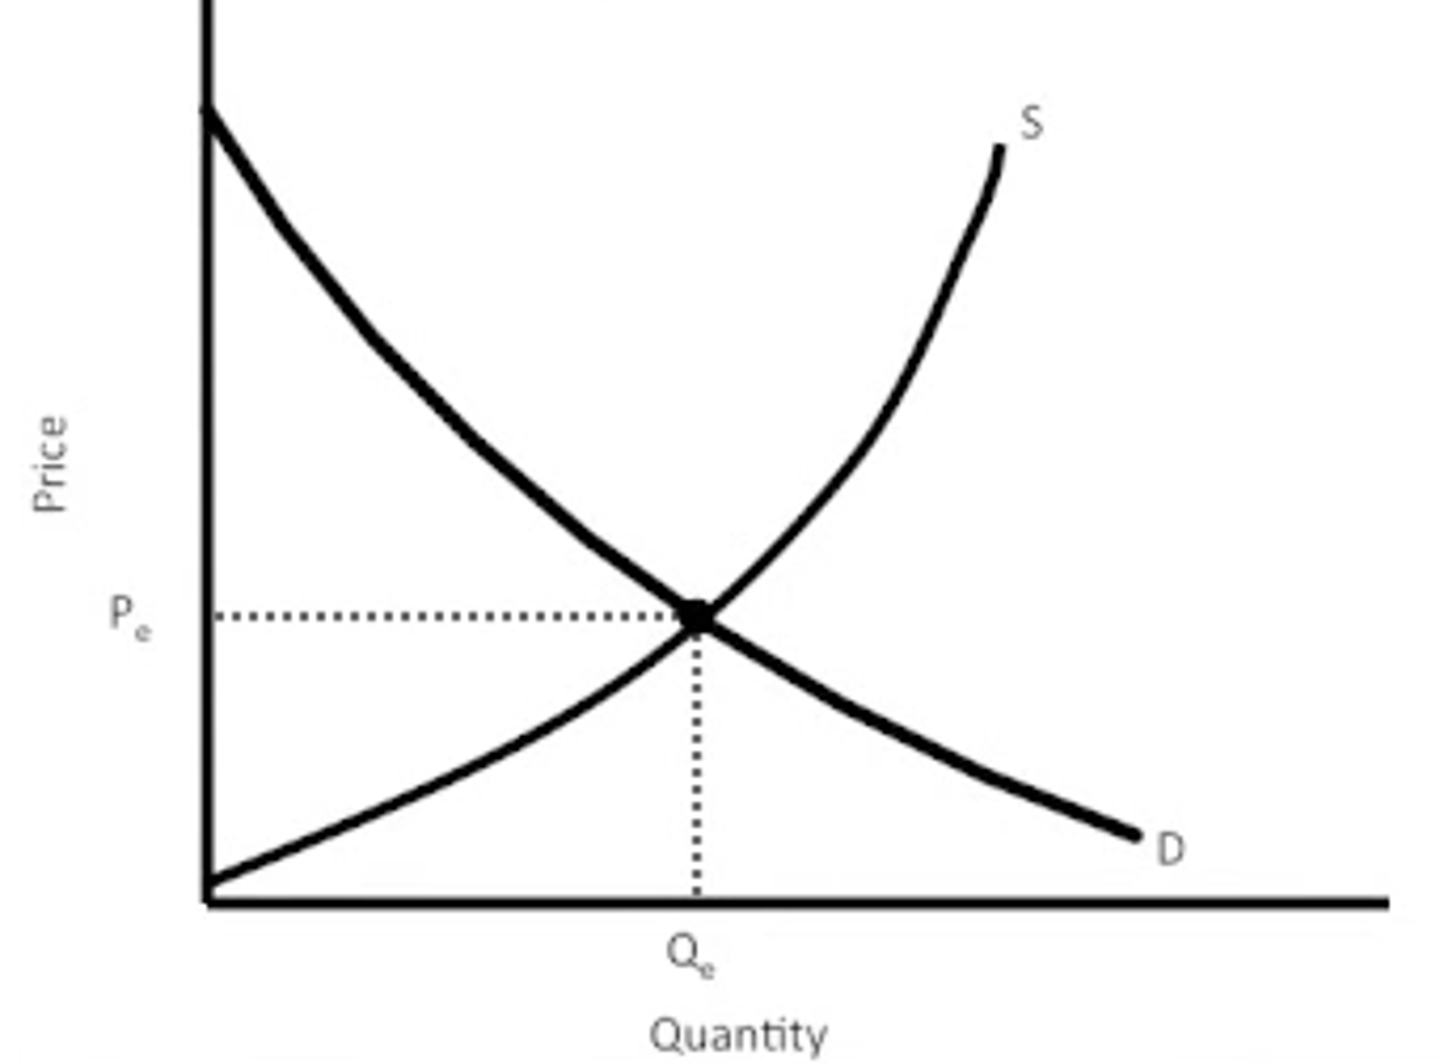
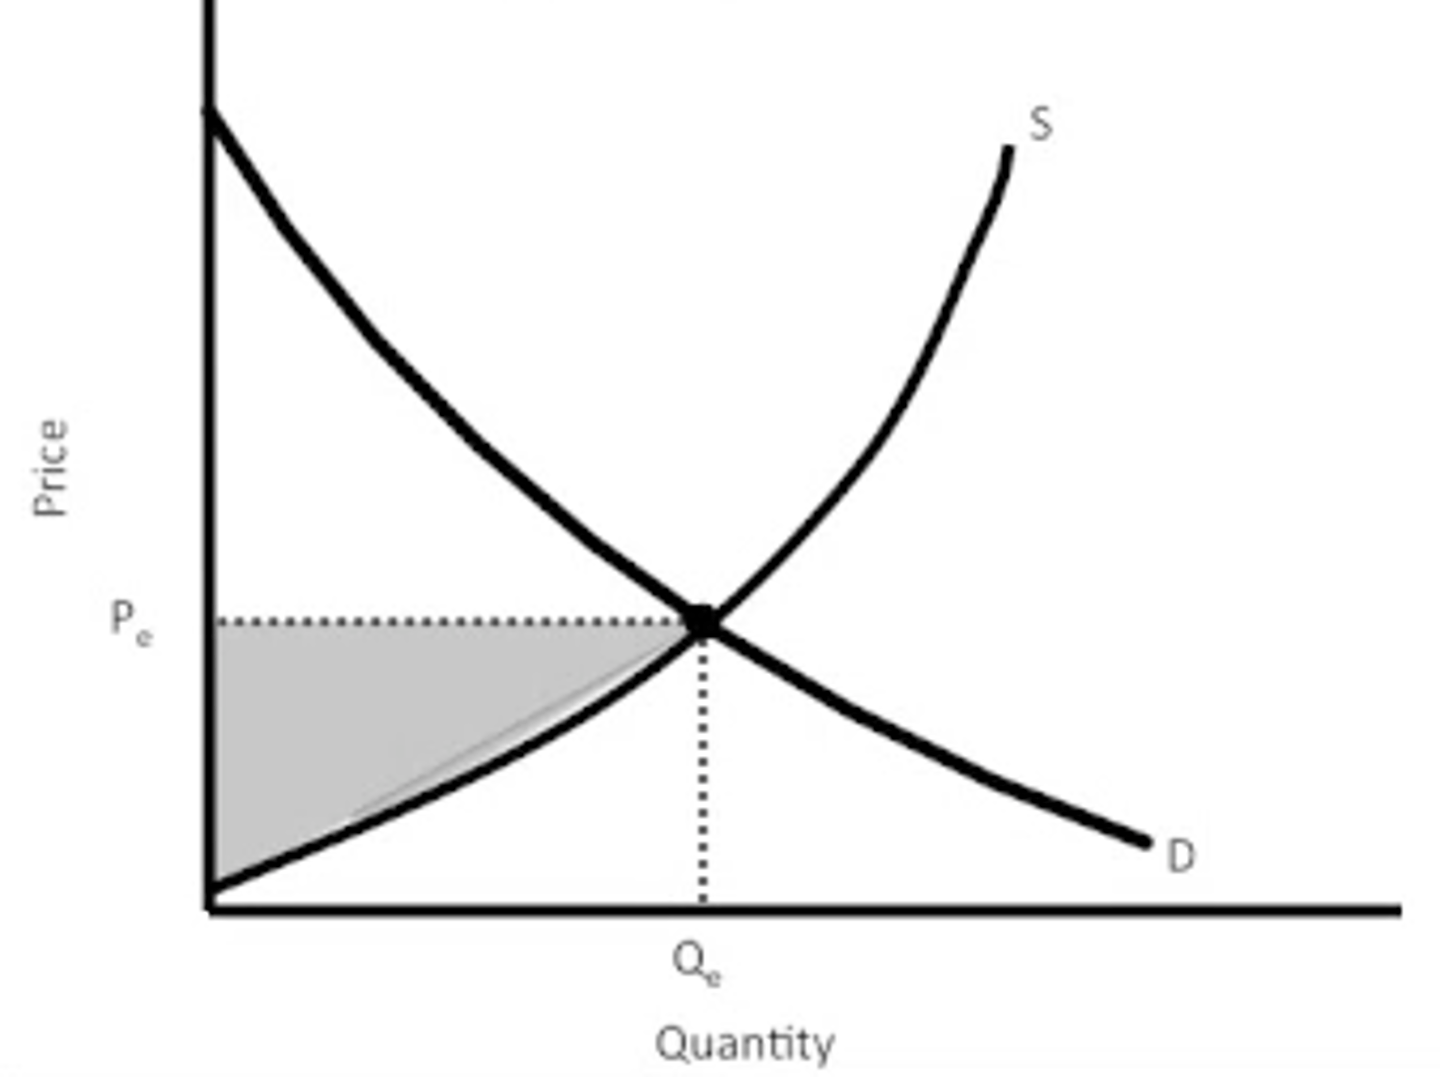
market equilibrium
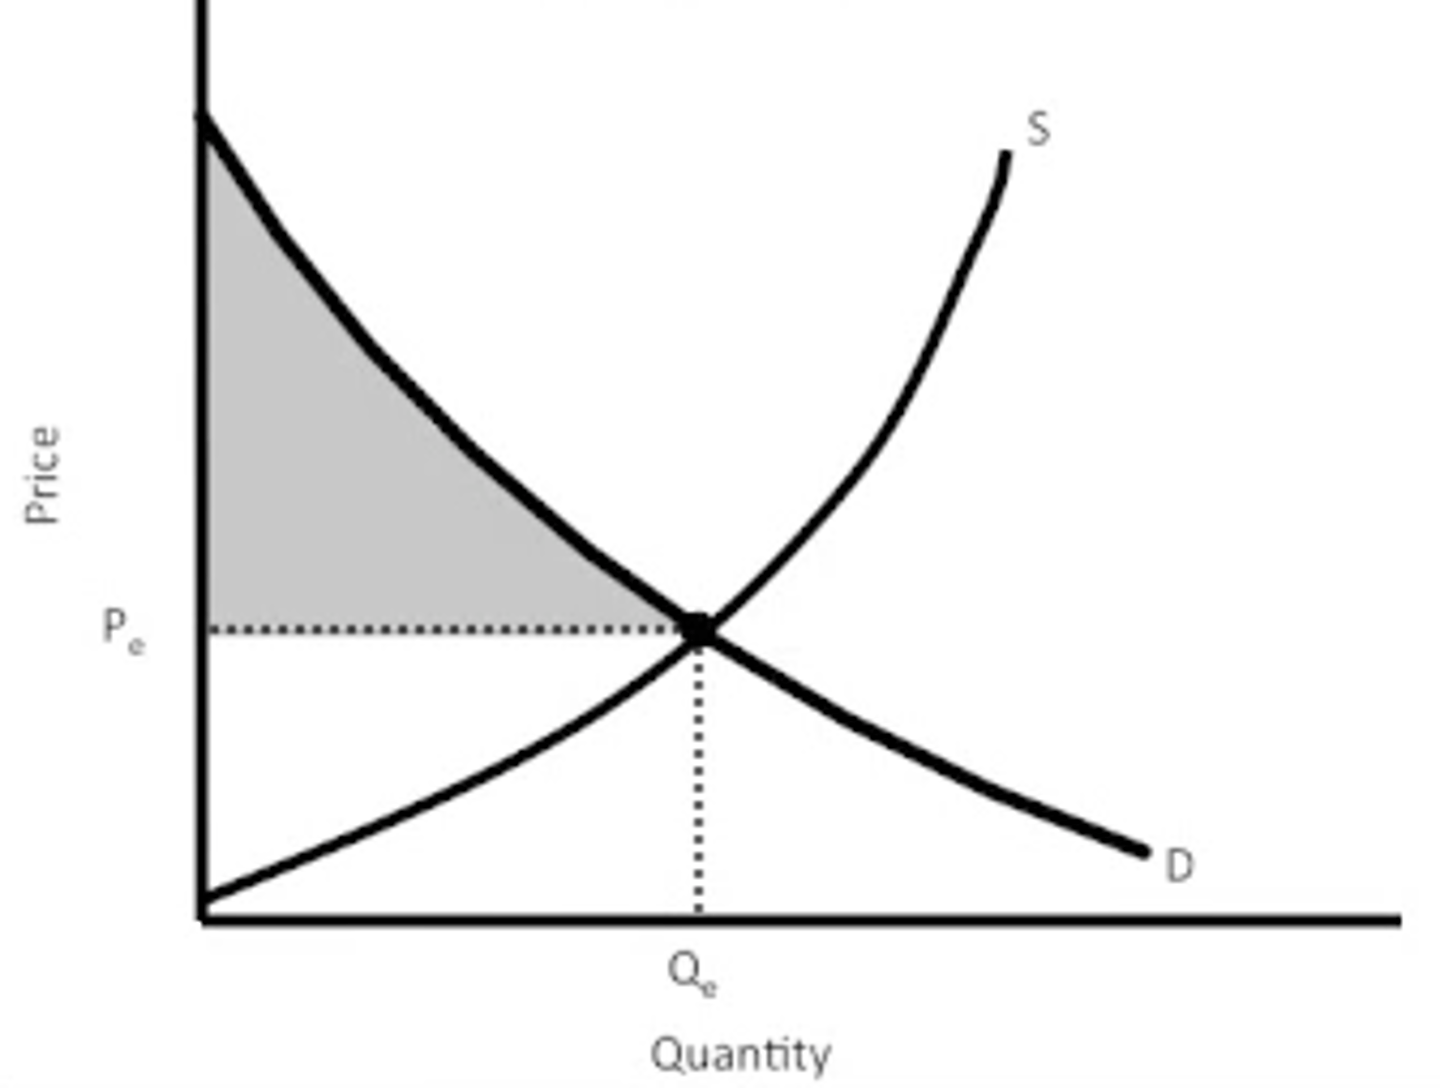
consumer surplus
producer surplus
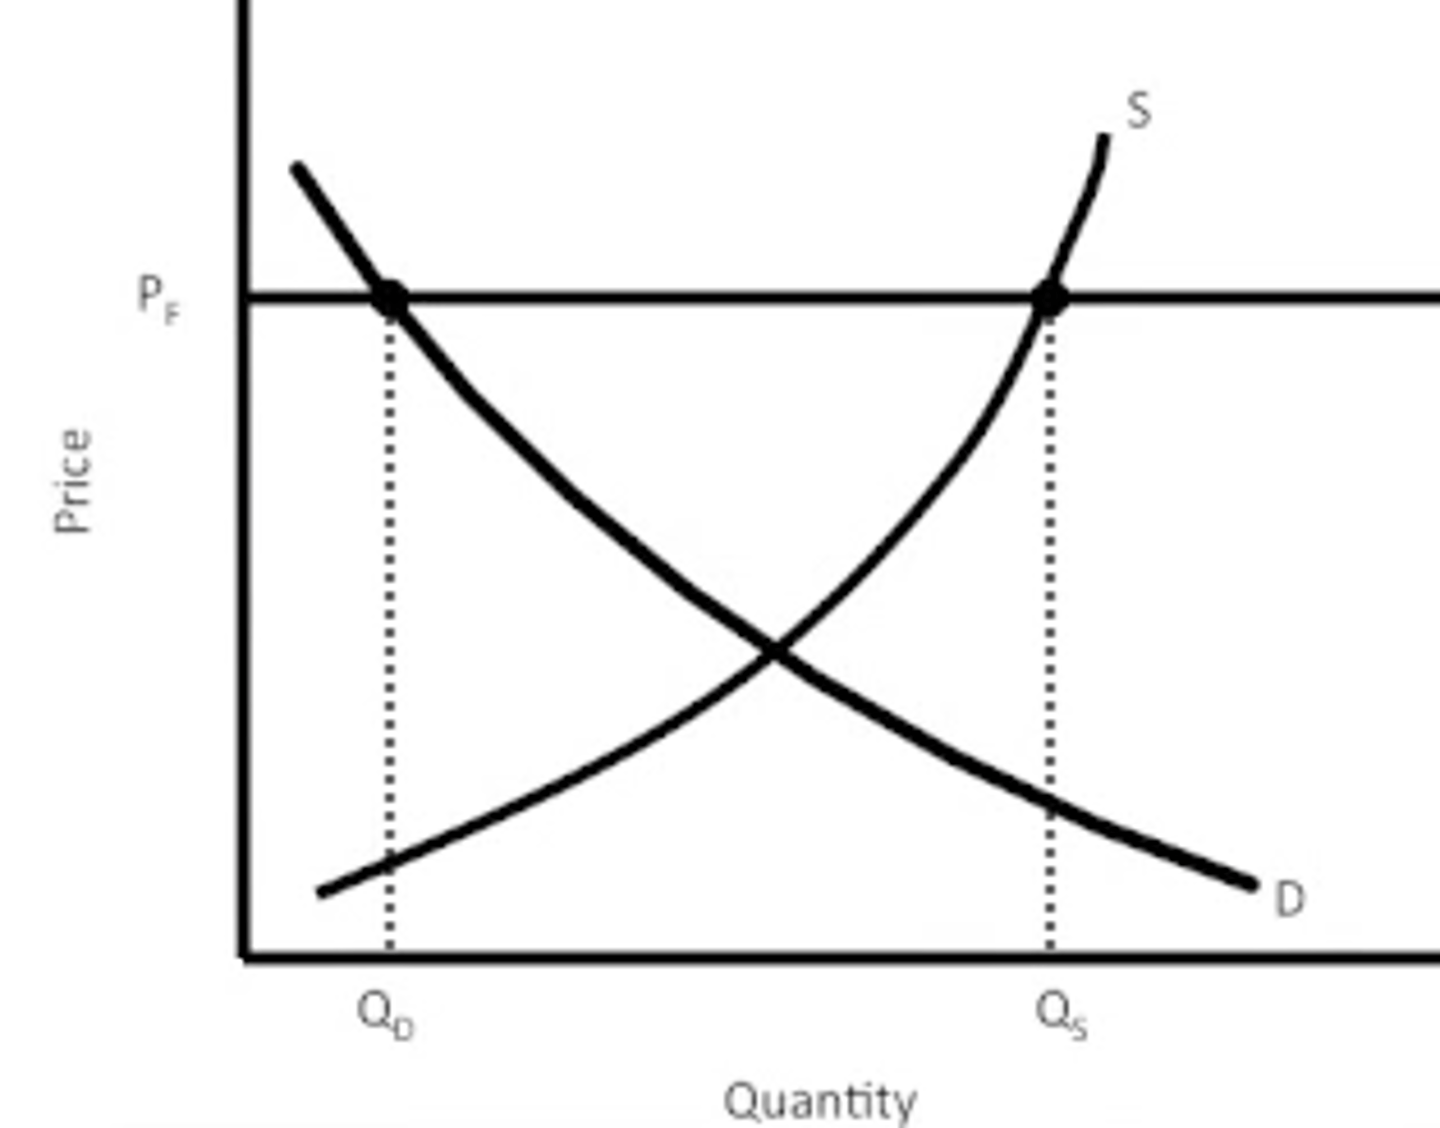
price floor; causes a surplus
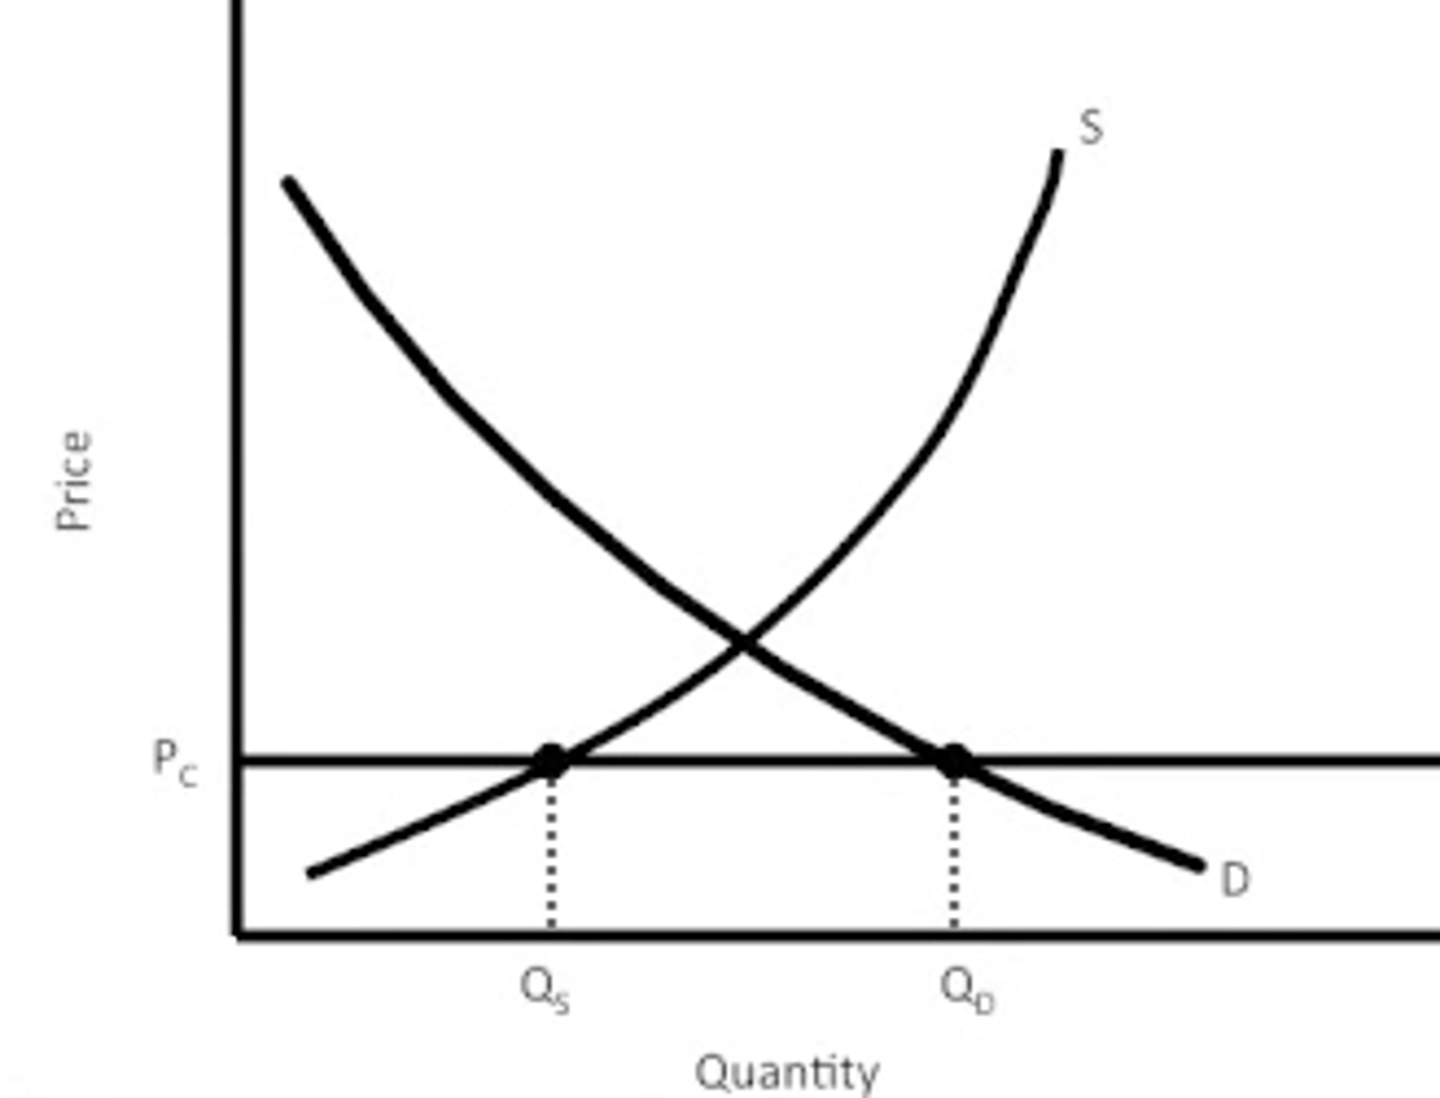
price ceiling; causes a shortage
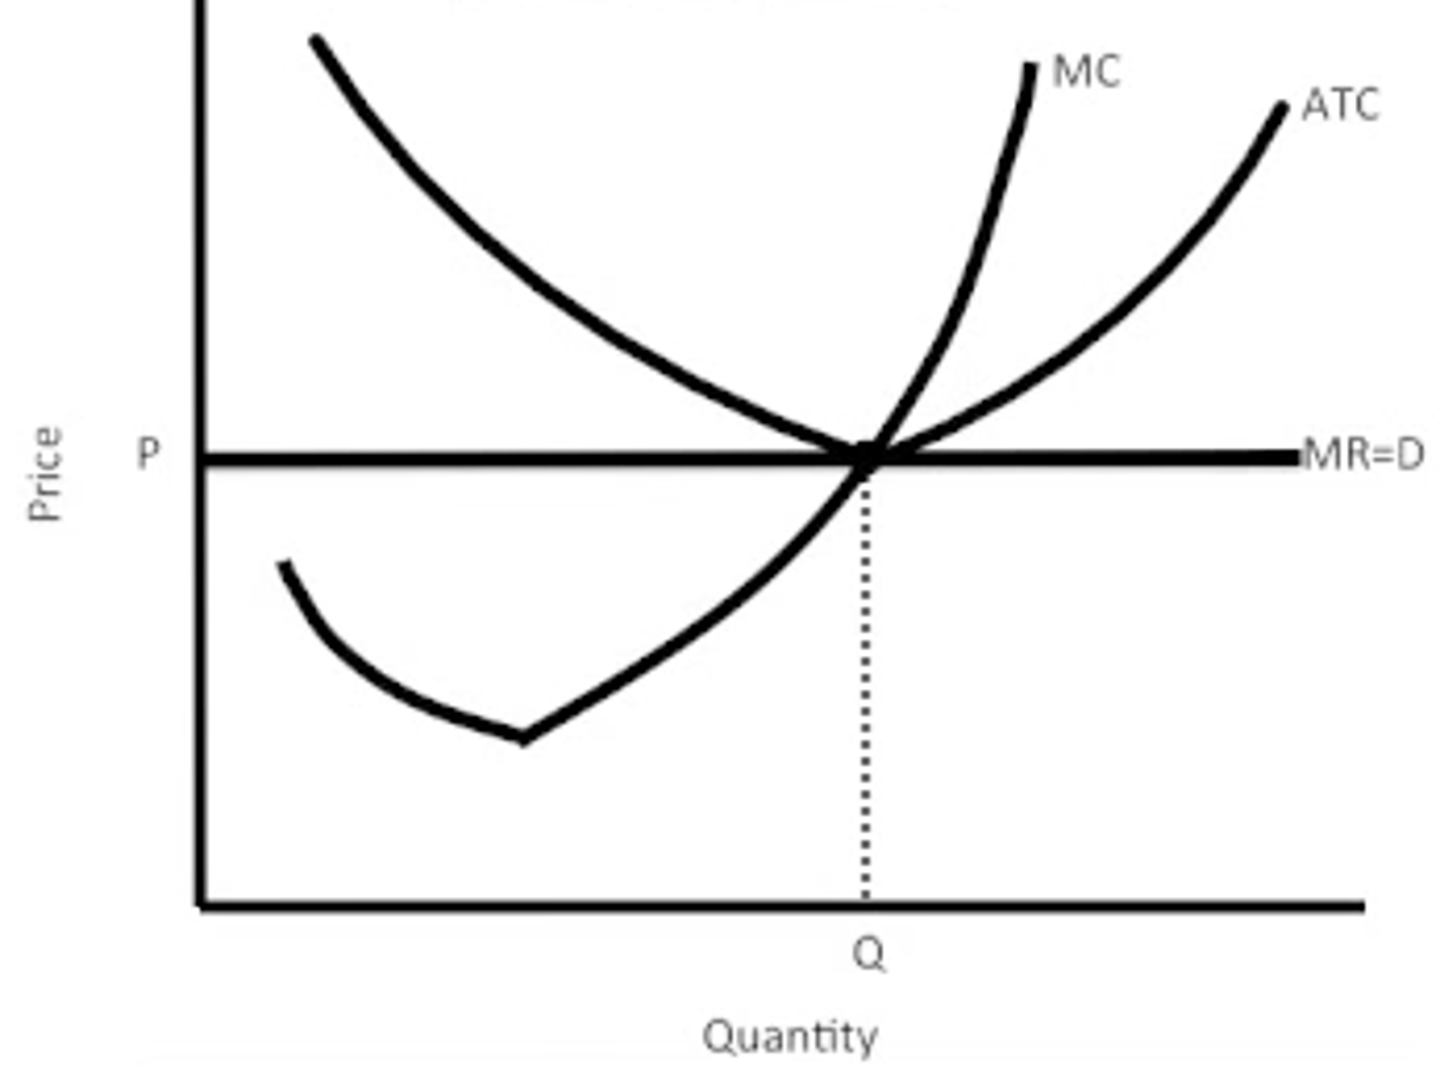
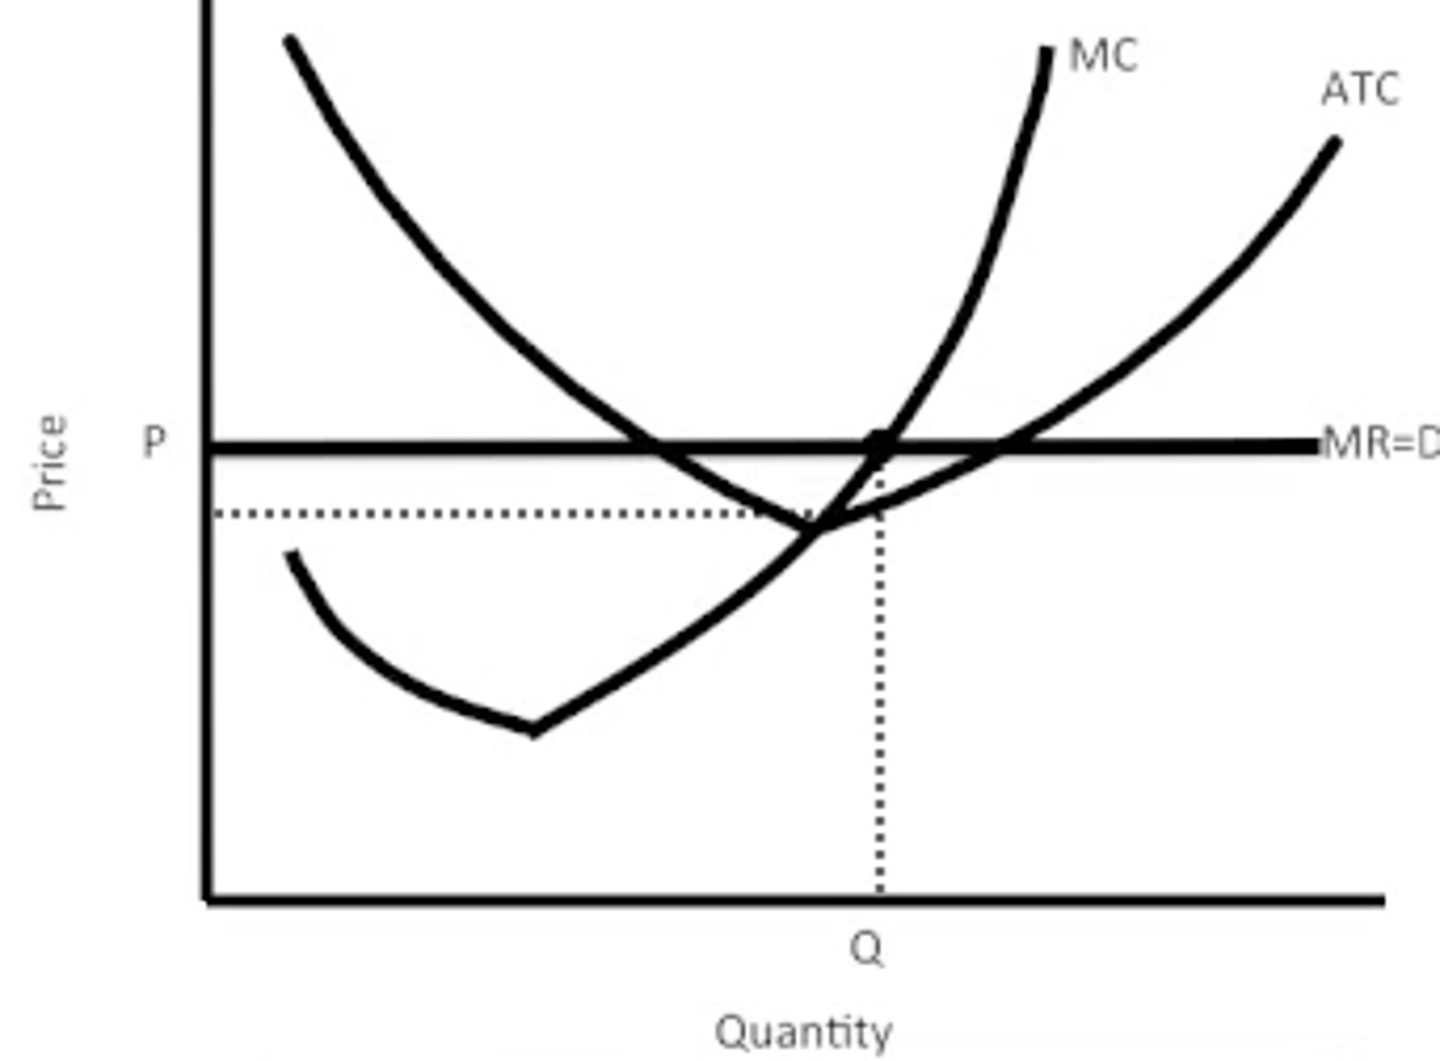
perfect competition at equilibrium
perfect competition making a profit
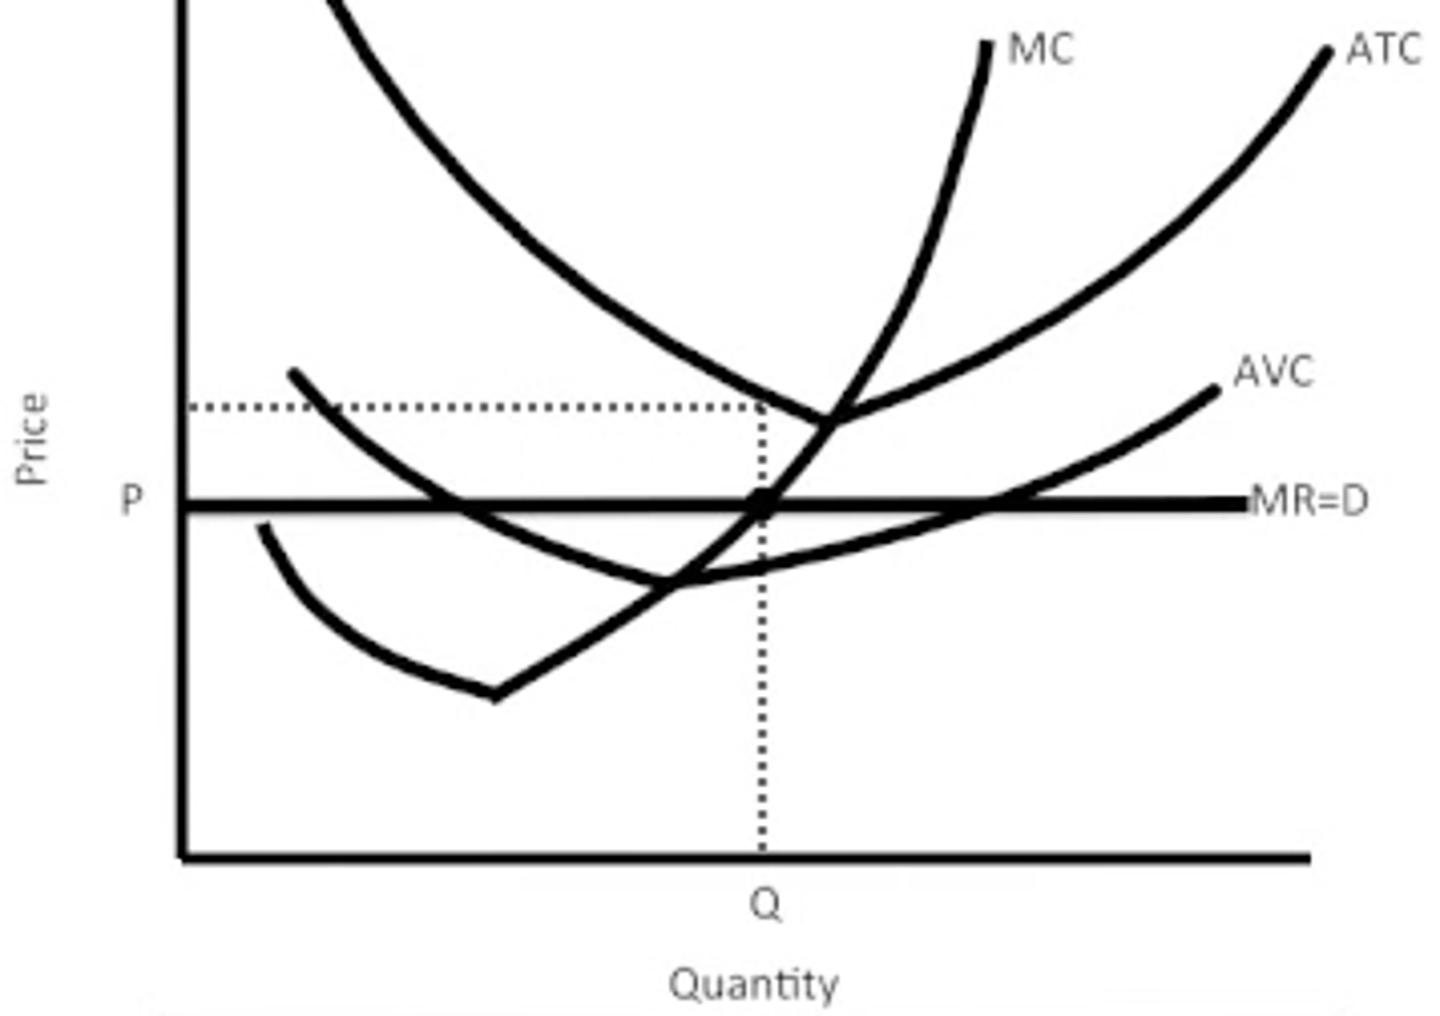
perfect competition making a loss
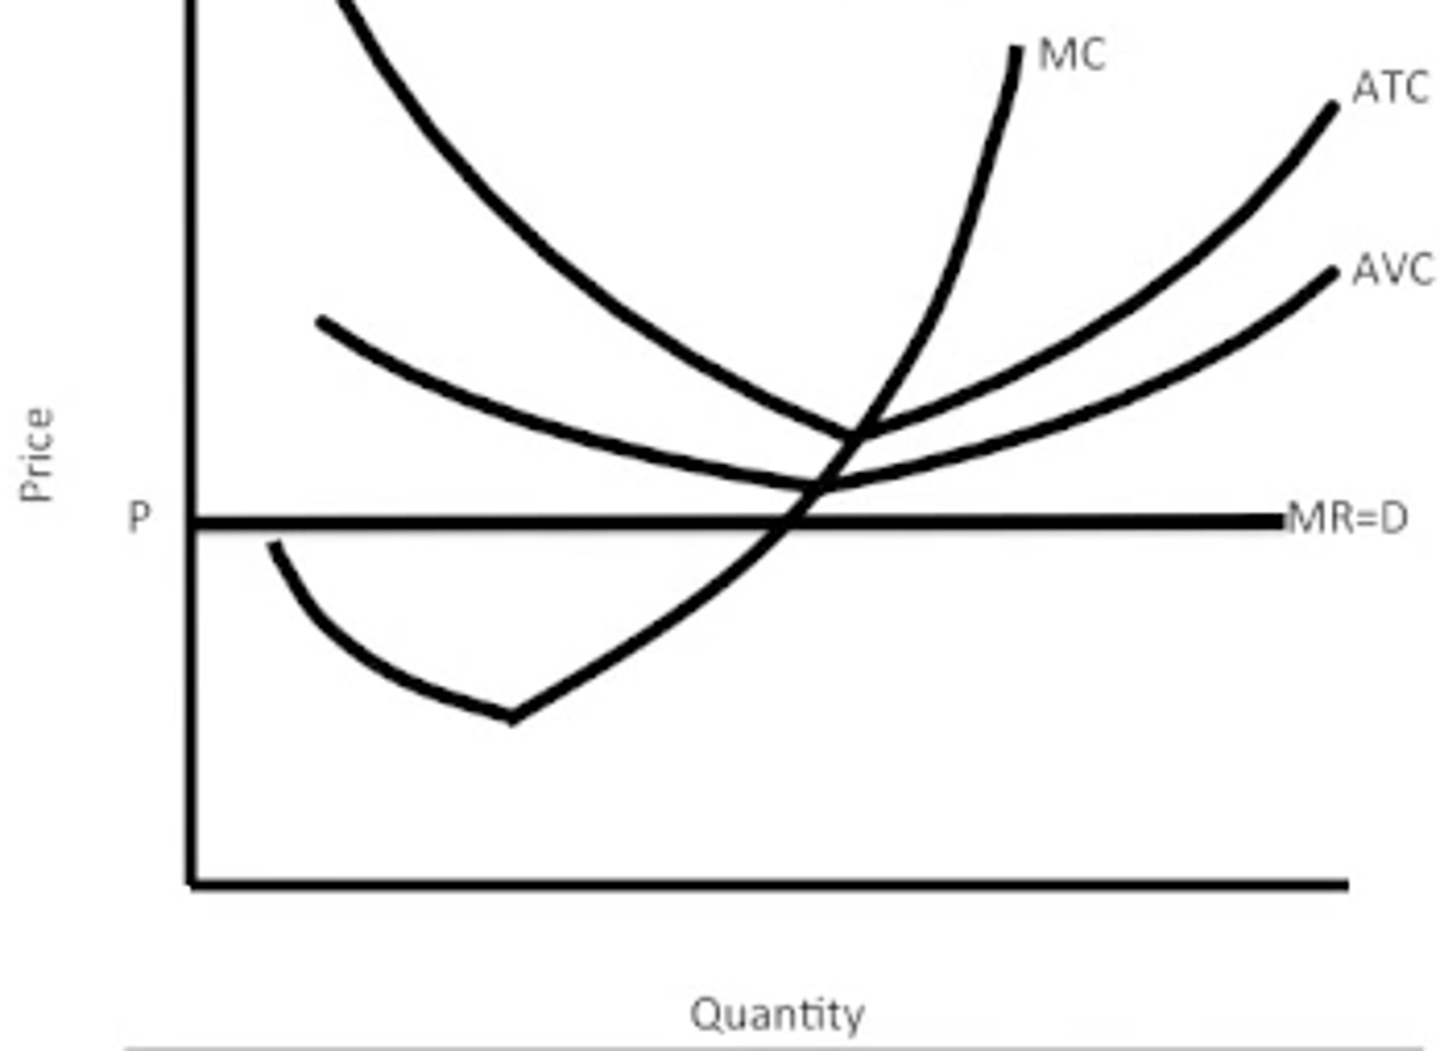
perfect competition in a "shut down" position
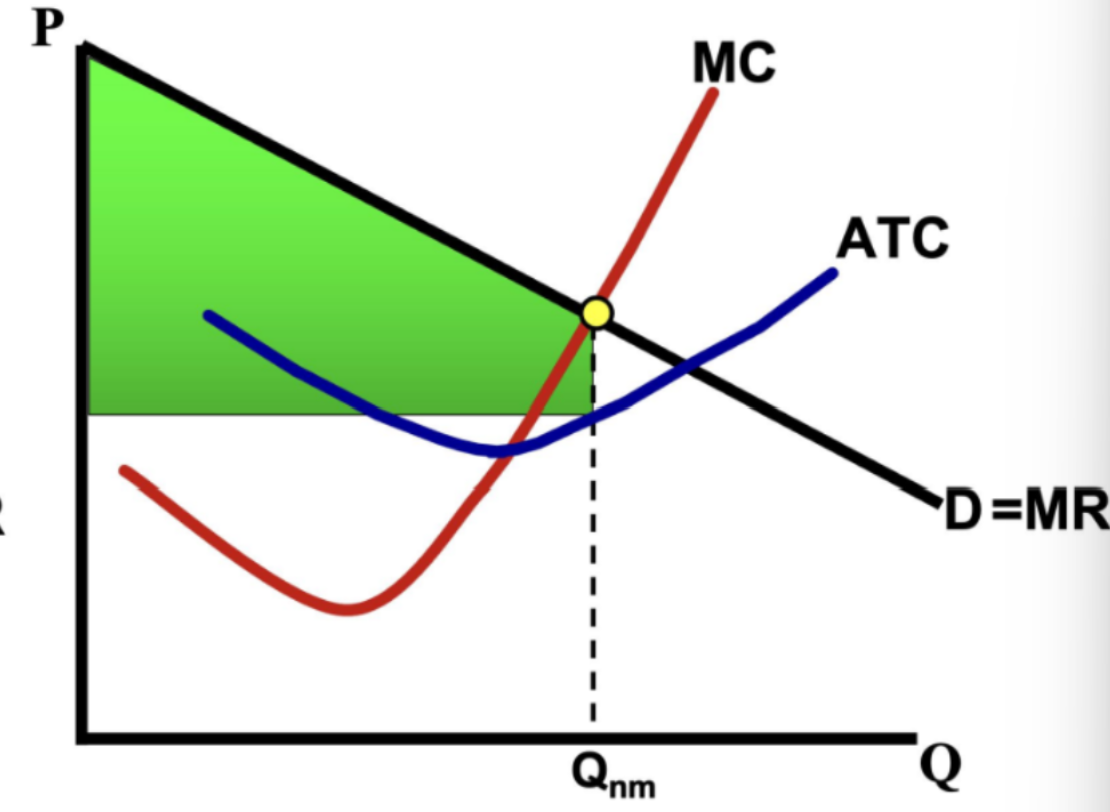
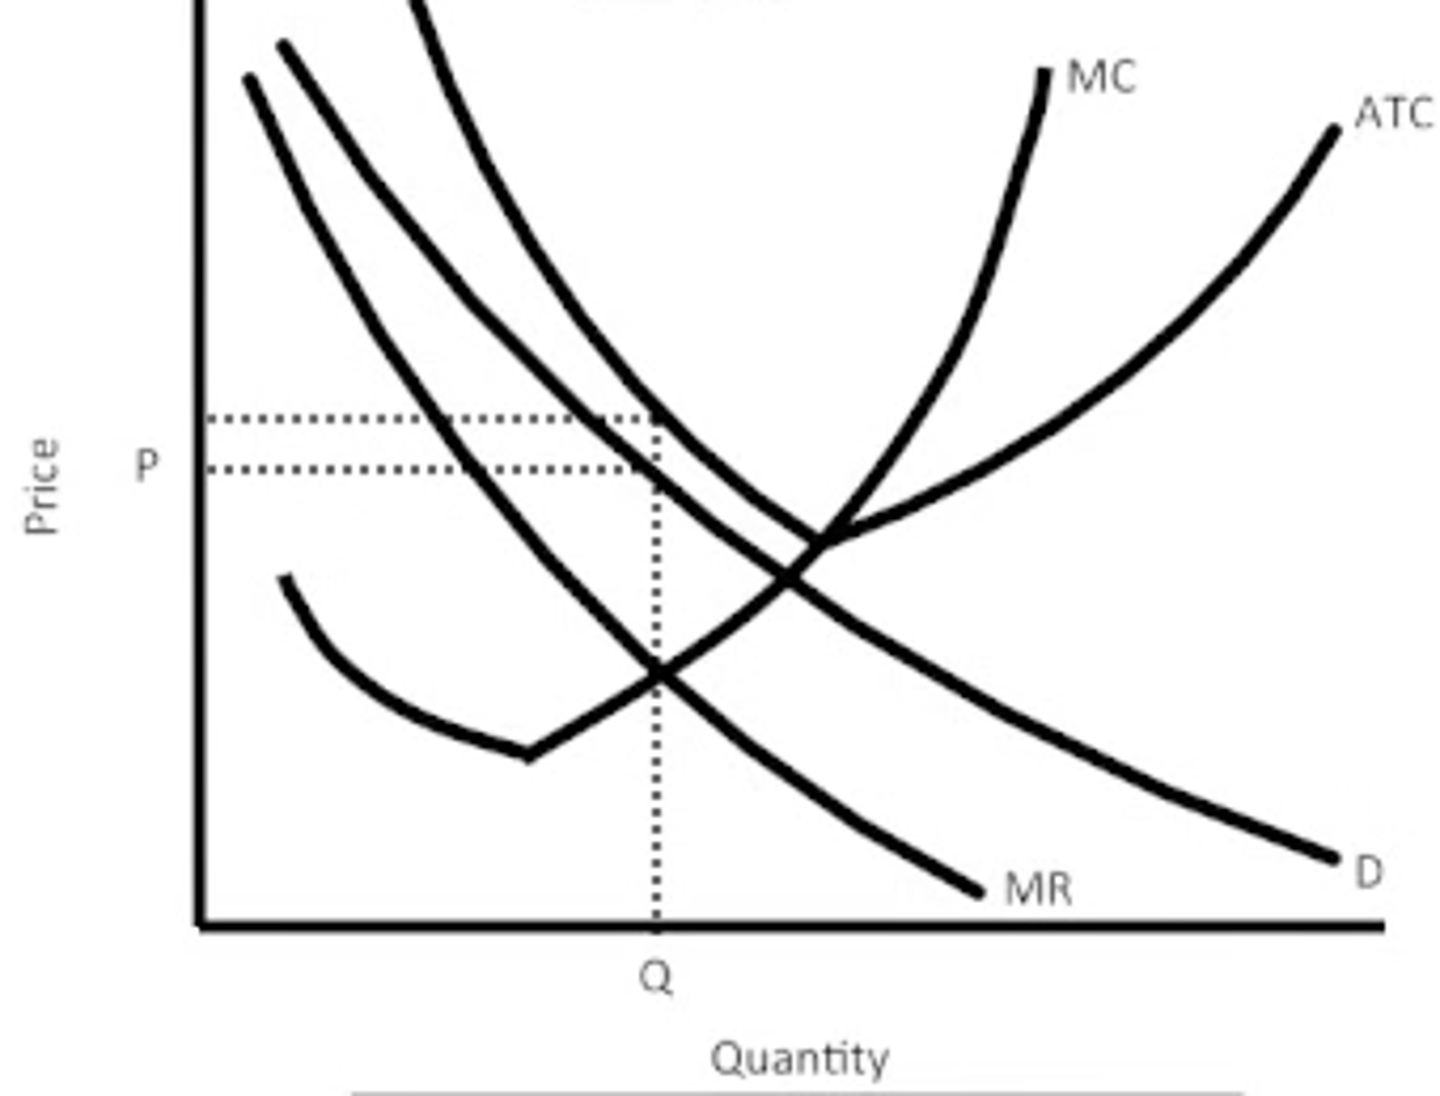
monopoly making a profit
monopoly making a loss
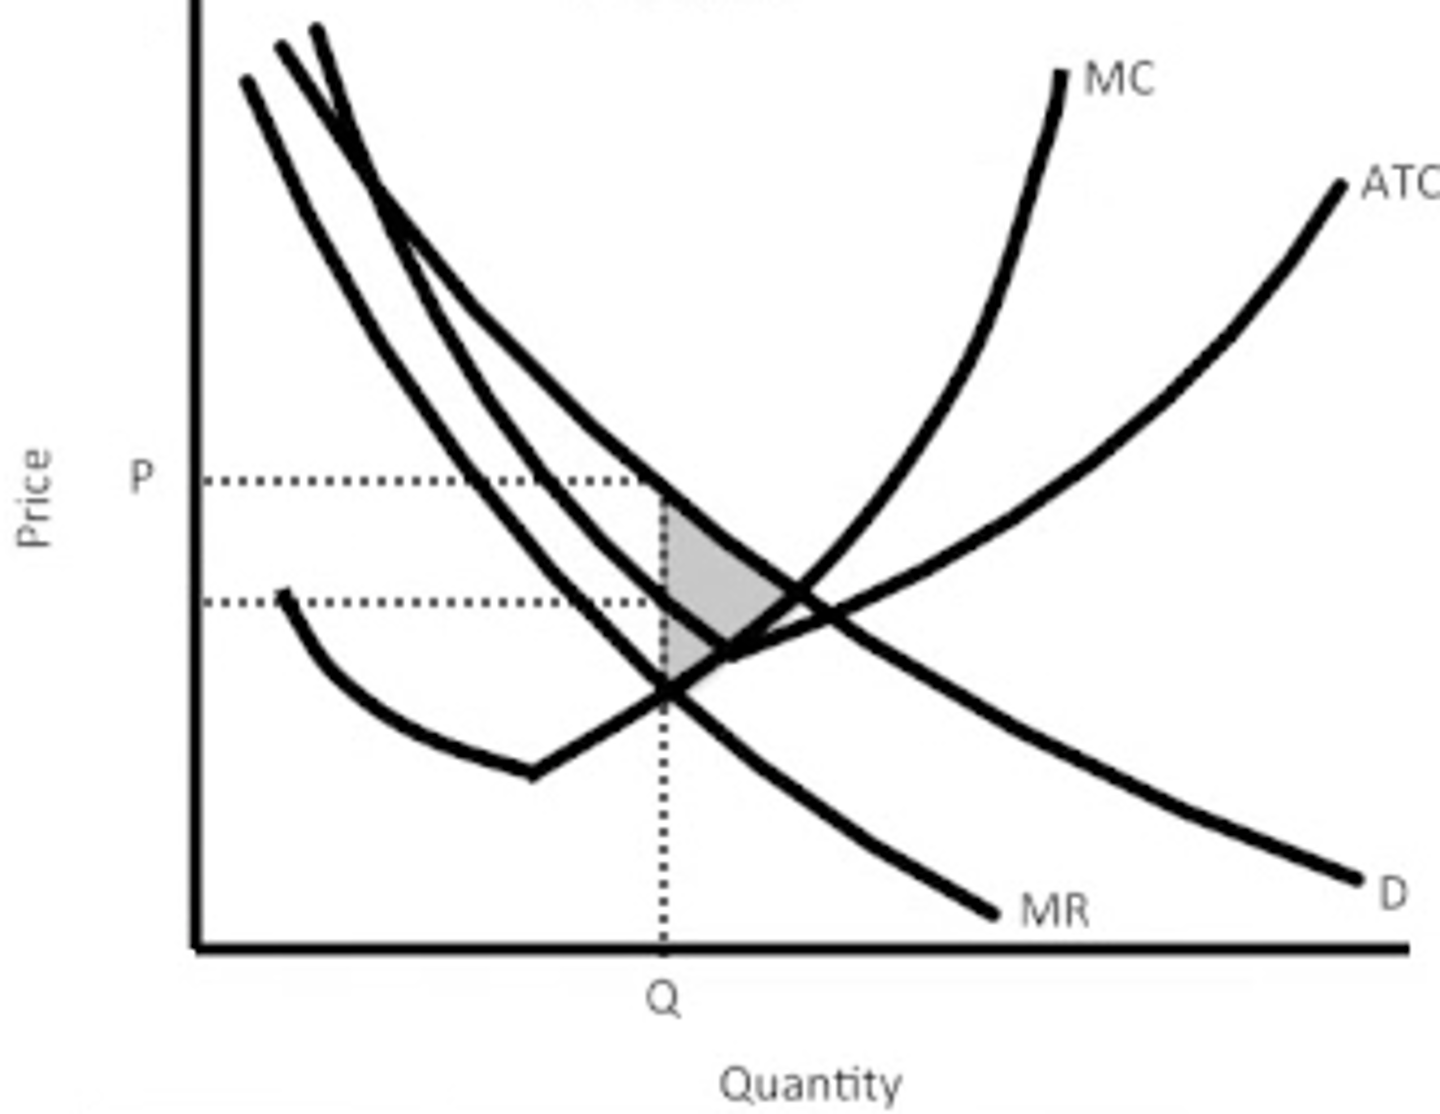
monopolistic competition at equilibrium
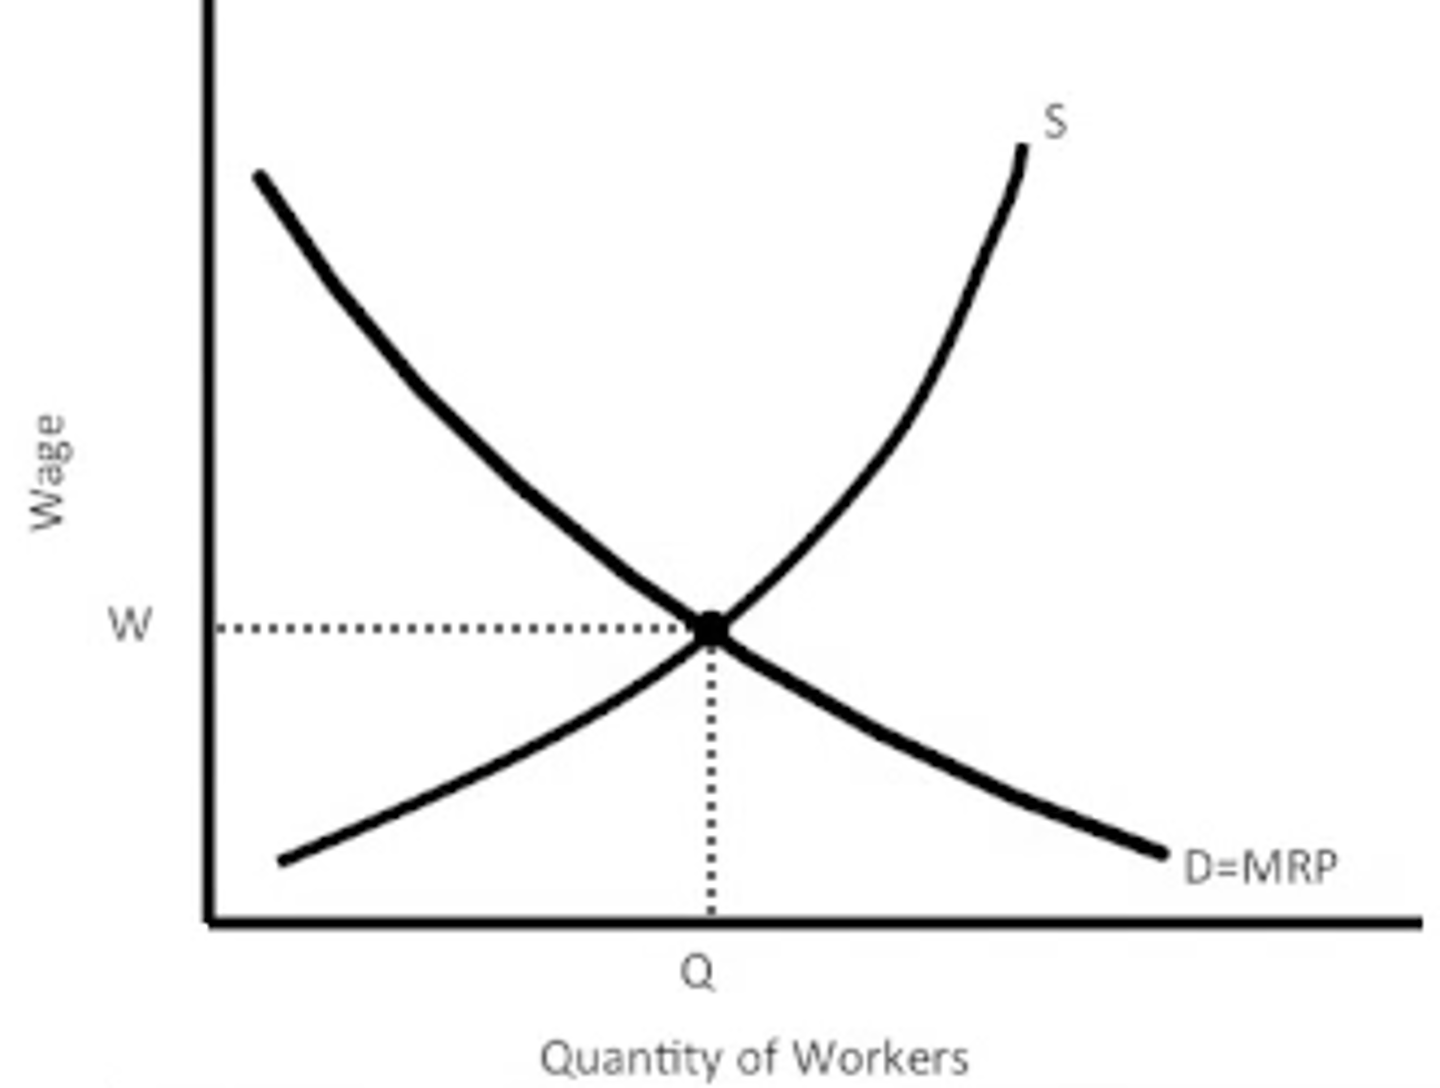
supply and demand for labor
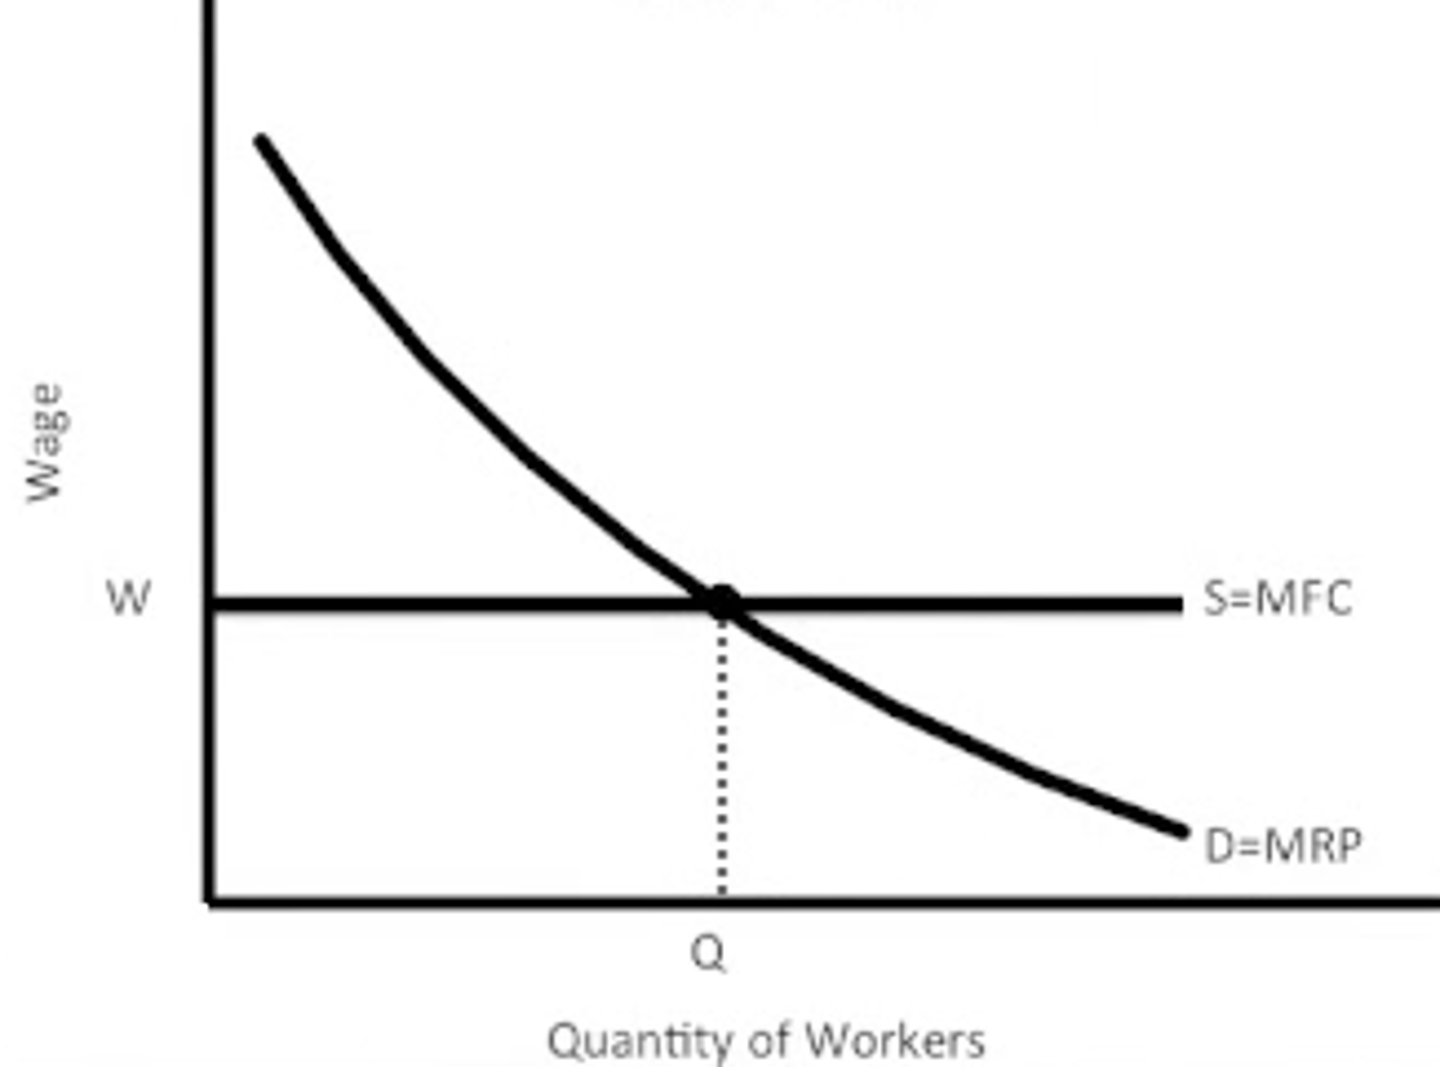
perfectly competitive demand for labor
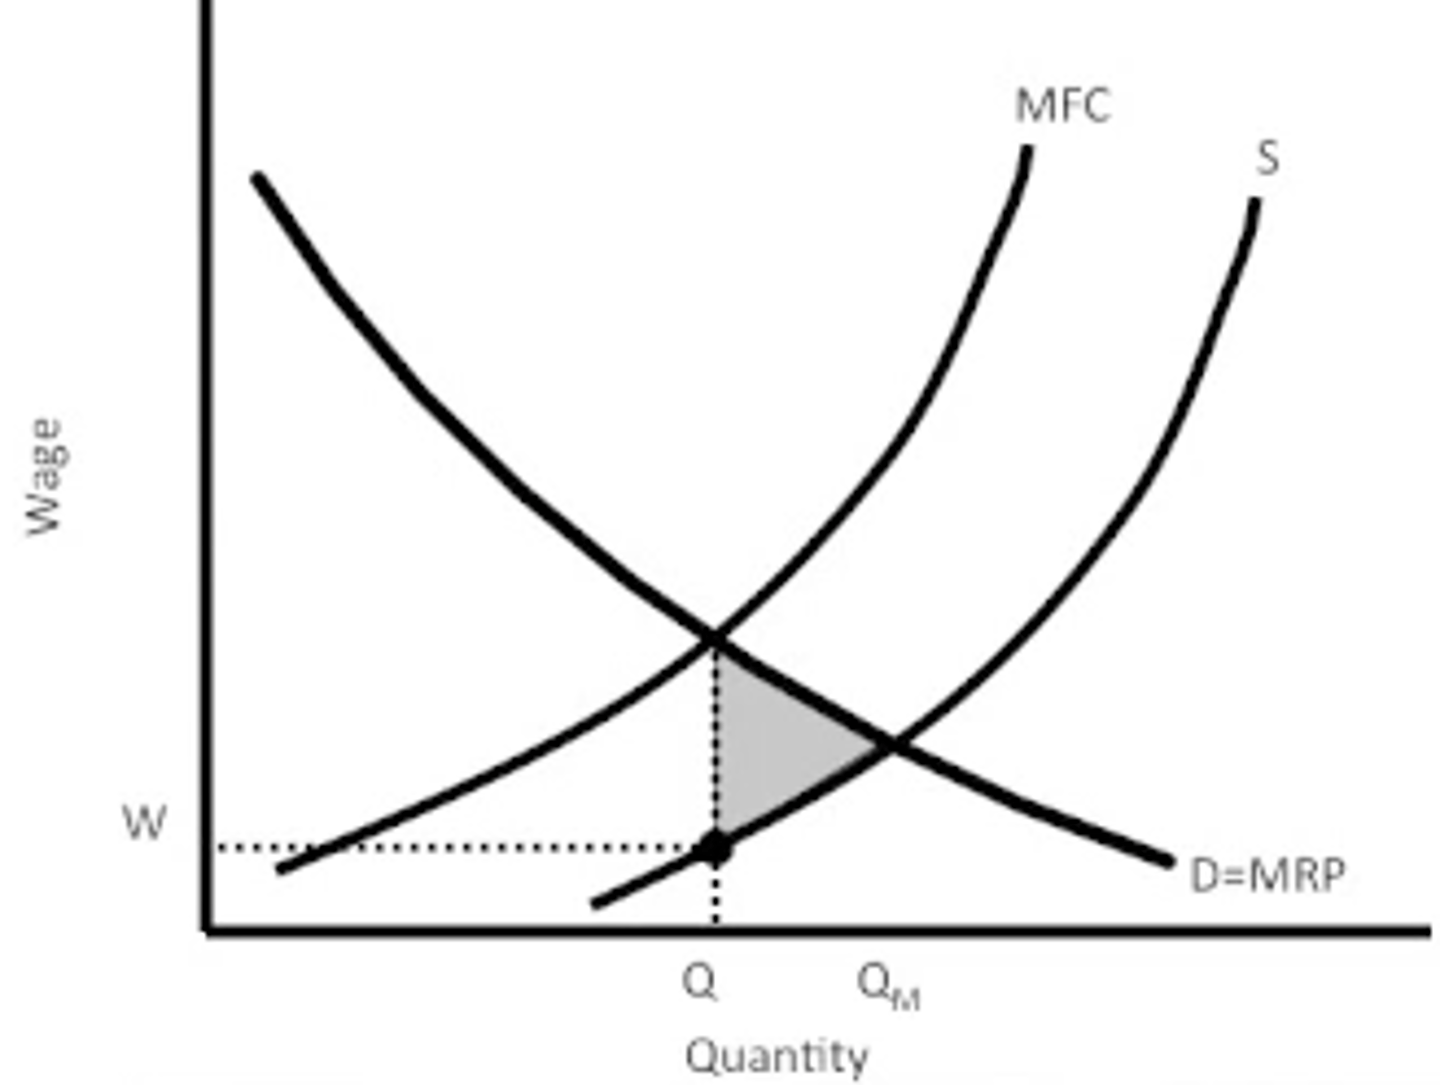
monopsonistic competition for labor
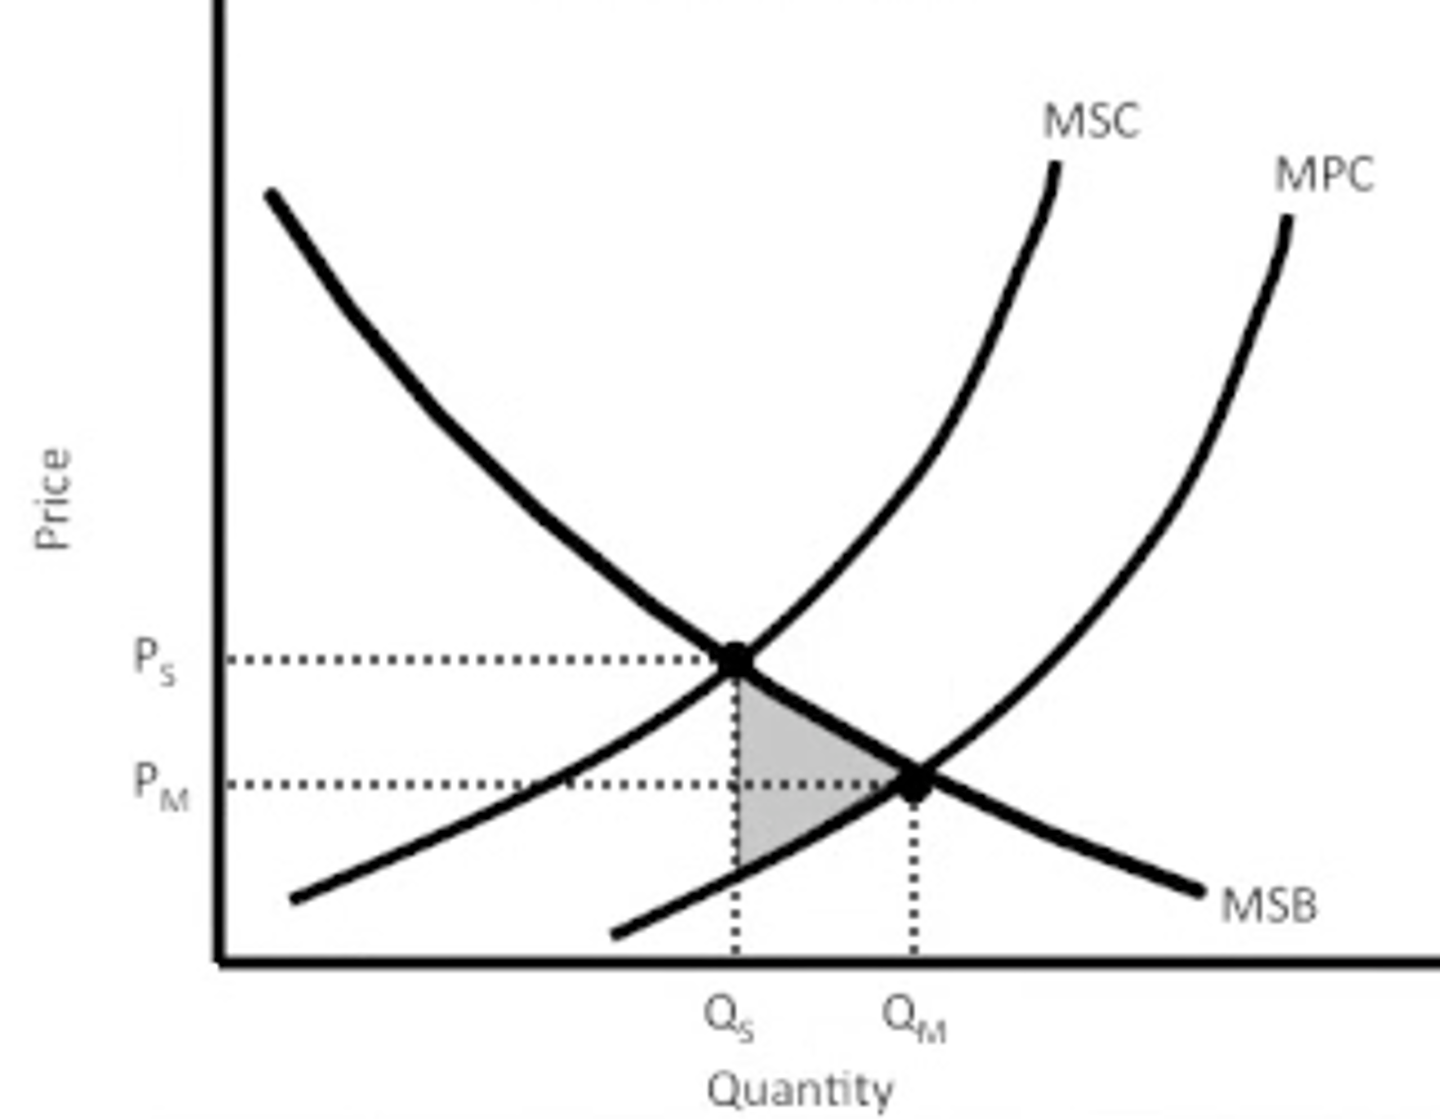
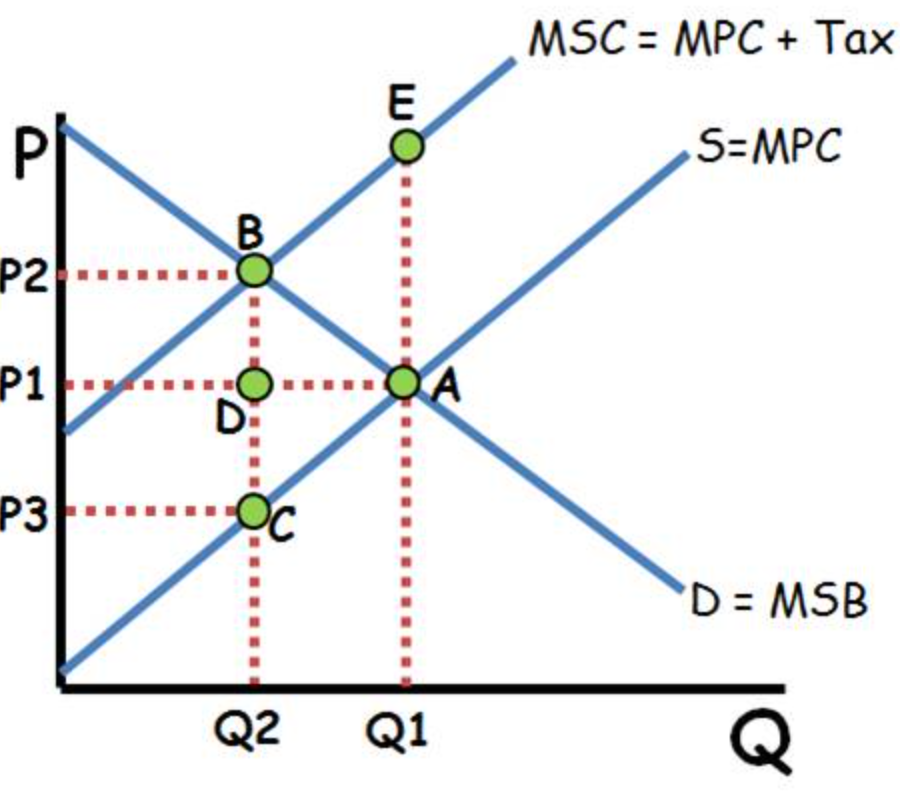
a negative externality causes too many to be produced at too low a price
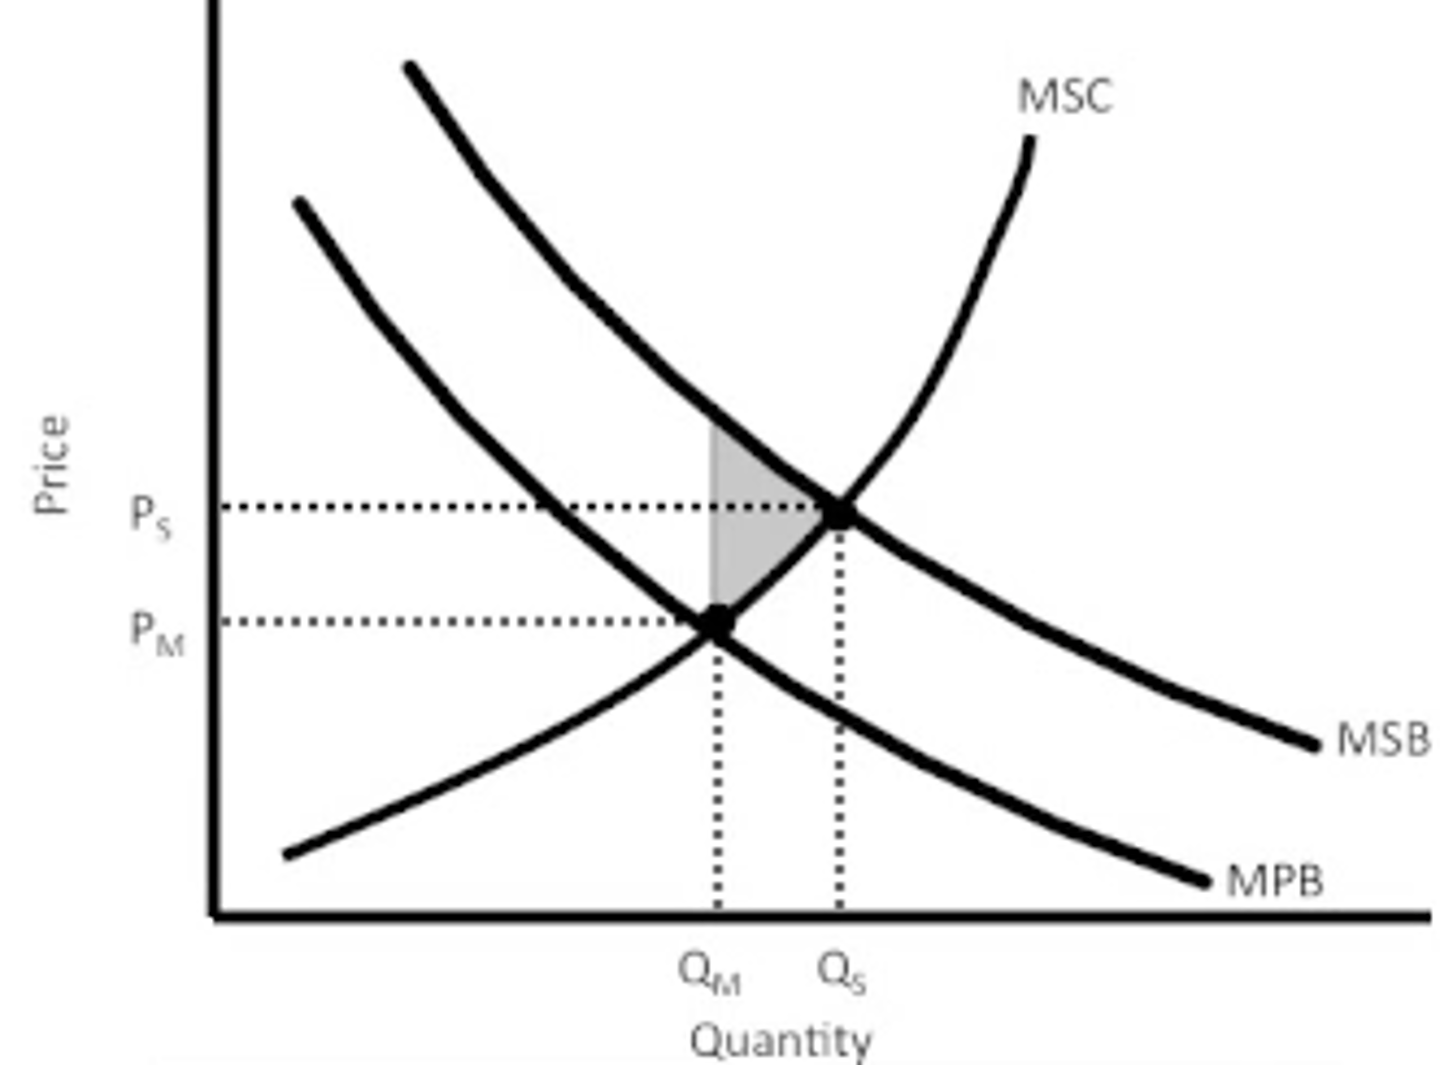
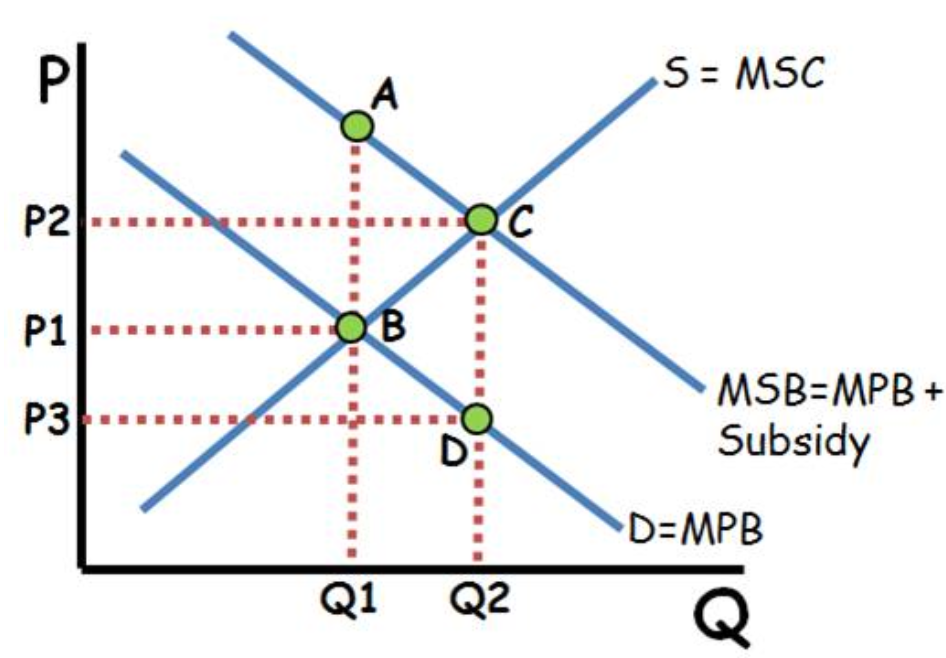
a positive externality causes too few to be produced at too low a price
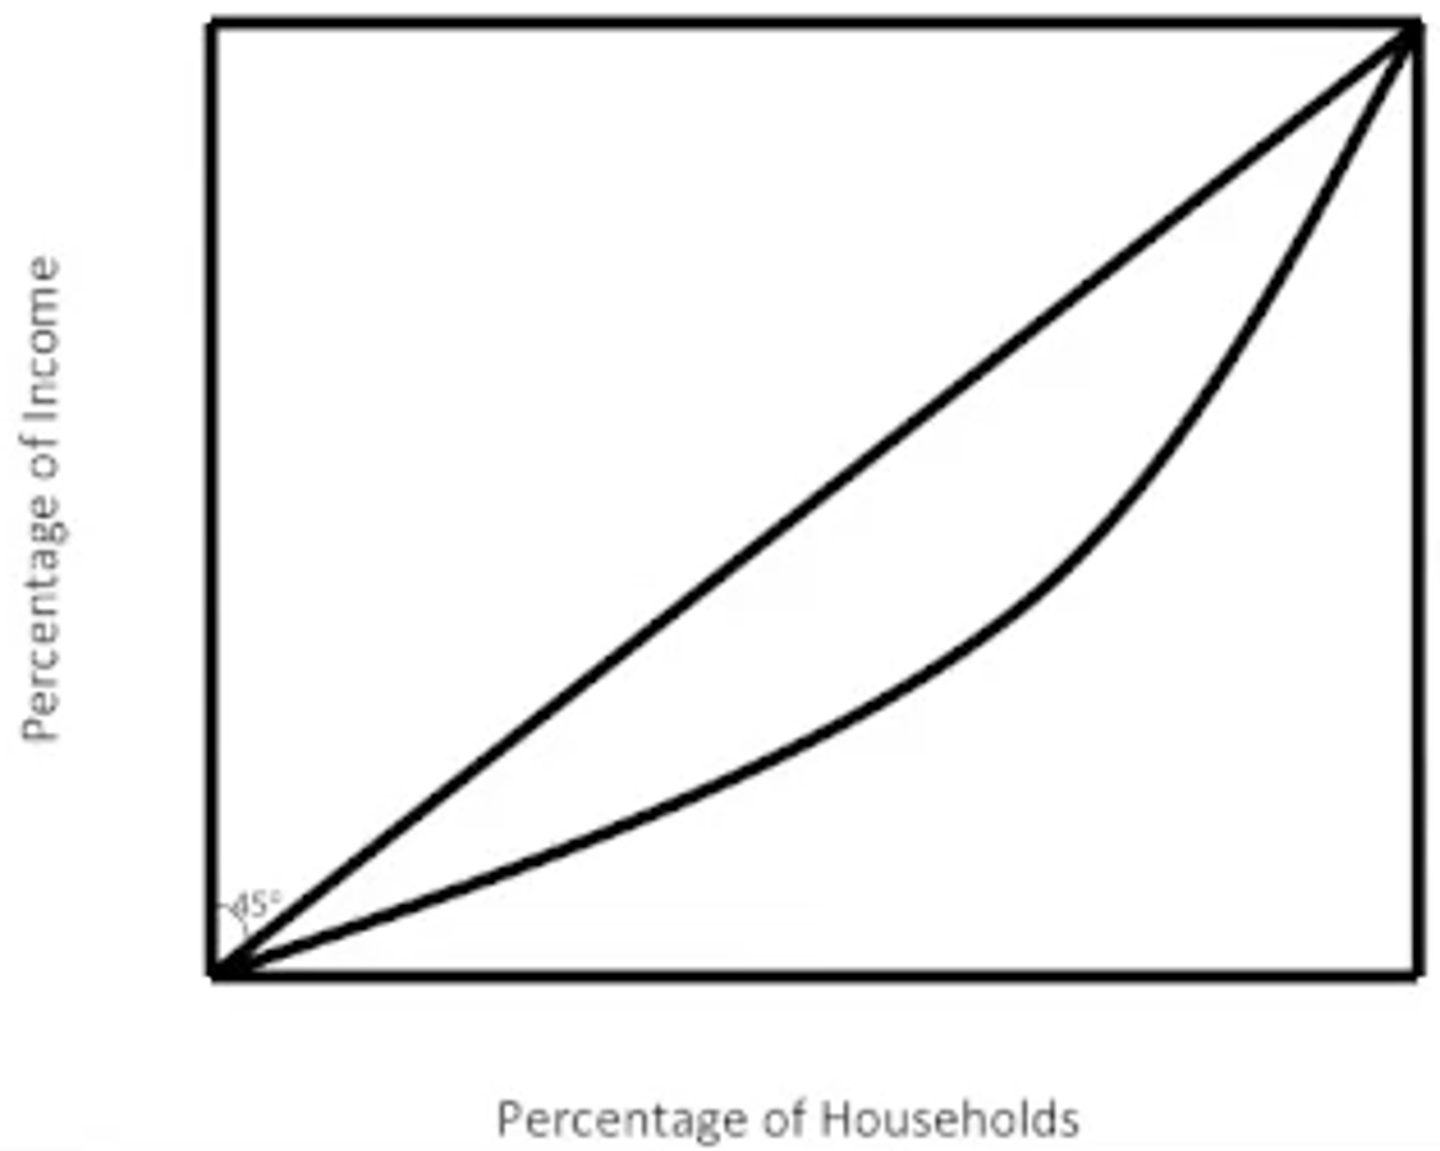
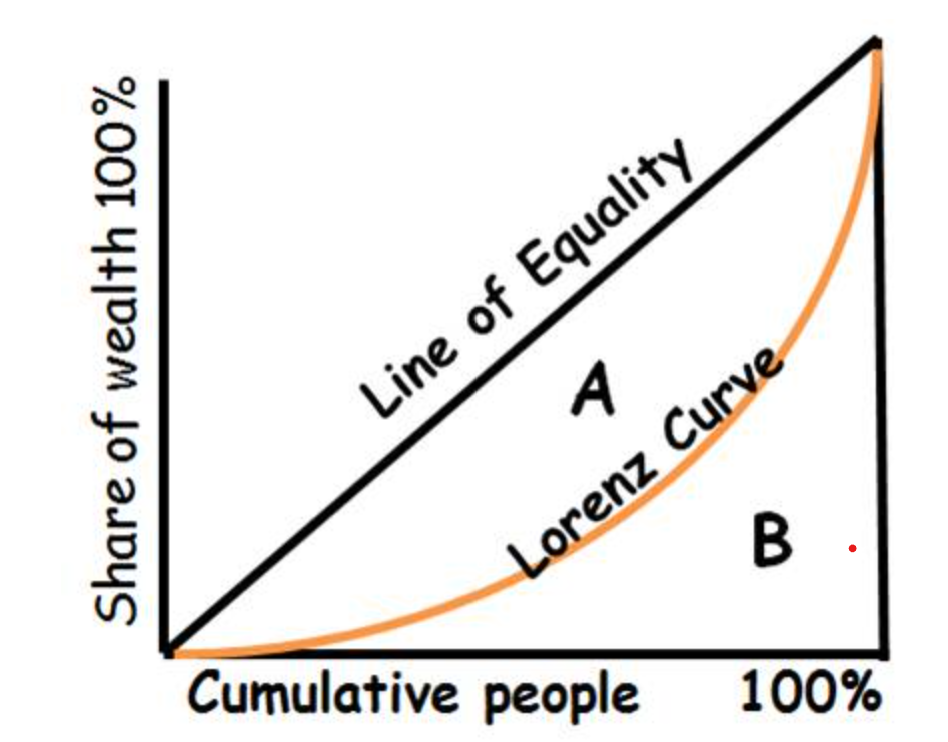
the lorenz curve; measures income inequality
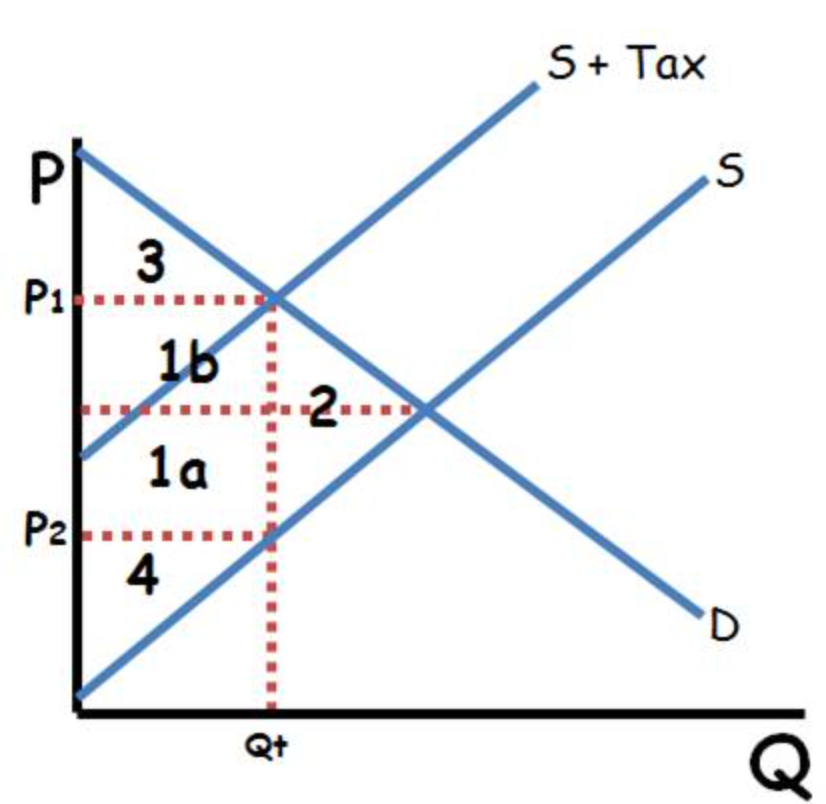
Tax Curve
show:
1a Producer tax burden
1b consumer tax burden
2.Deadweight loss
3.Consumer Surplus
4.Producer Surplus
•Price of tax = P1-P2
•P1=Price consumers pay
•P2=Price producers receive
•Qt= Quantity produced and demanded
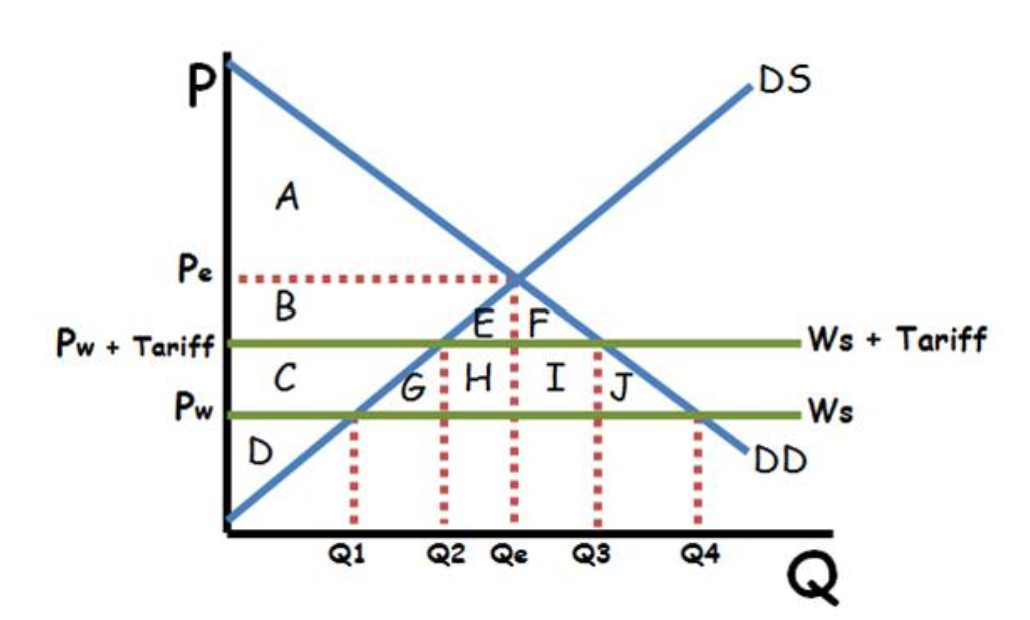
International Tariff:
•Pw+Tariff is the price
•Q2 domestically produced
•Q3 domestically consumed
•Q3-Q2 is imported
•Consumer Surplus ABEF
•Producer Surplus CD
•Tax Revenue HI
•Deadweight loss GJ
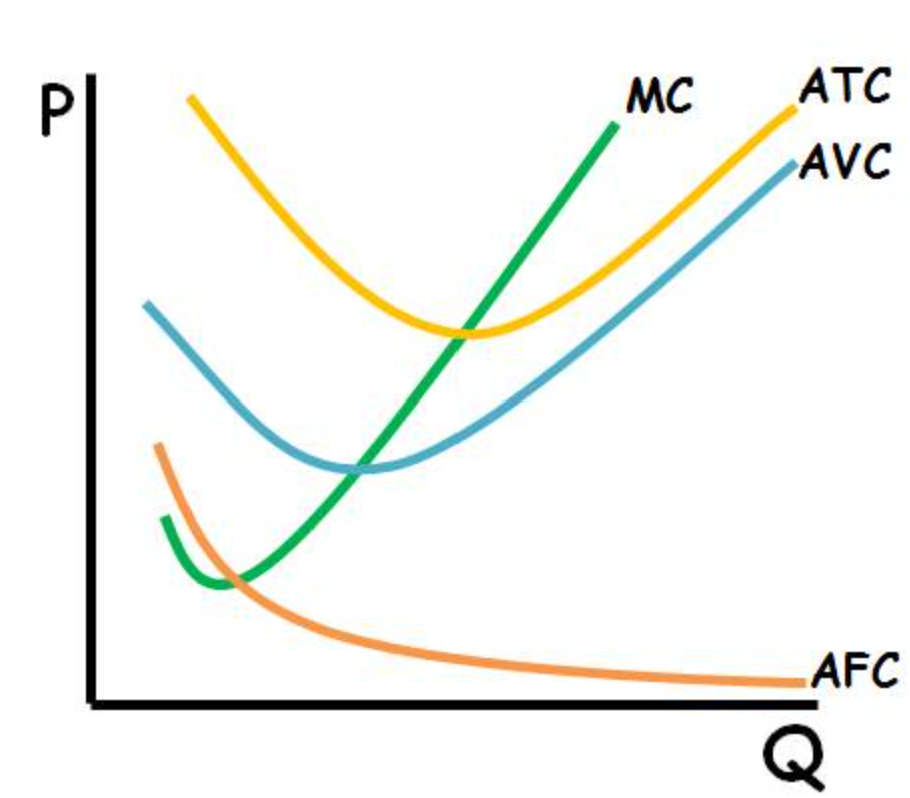
Cost Curve
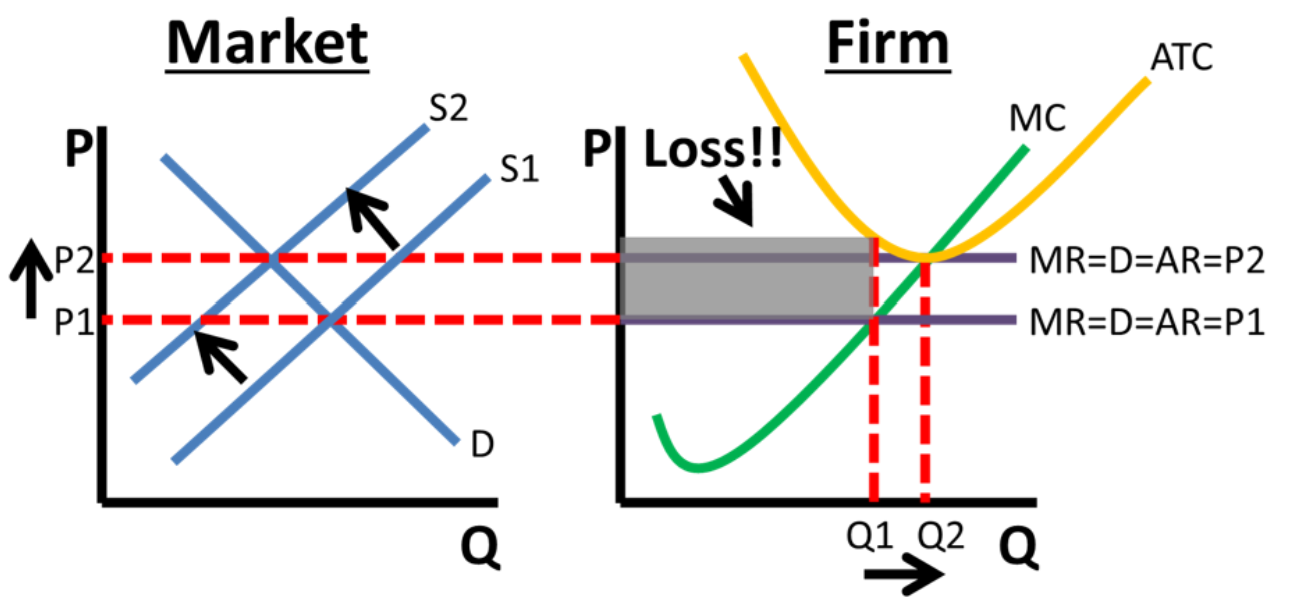
Show BOTH market and Firm graph of perfect competition w economic loss
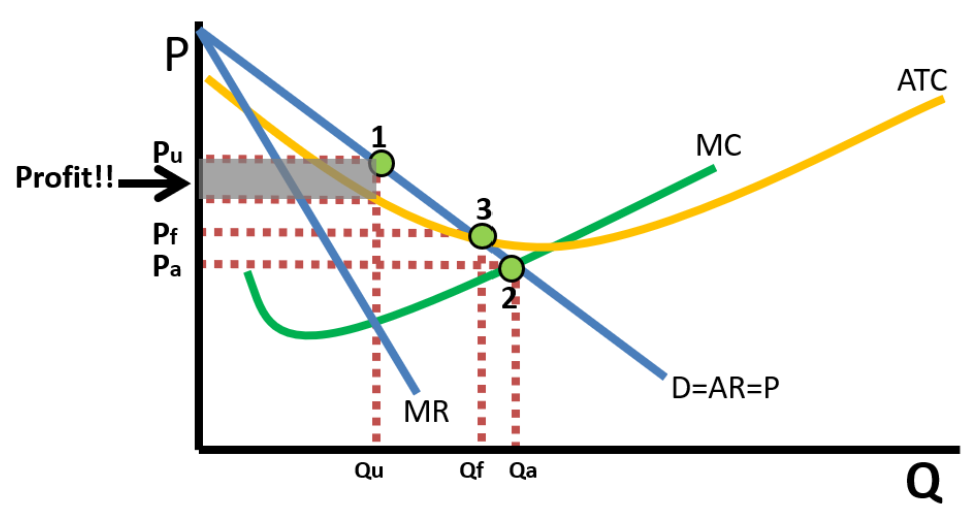
Monopoly Long-run profit
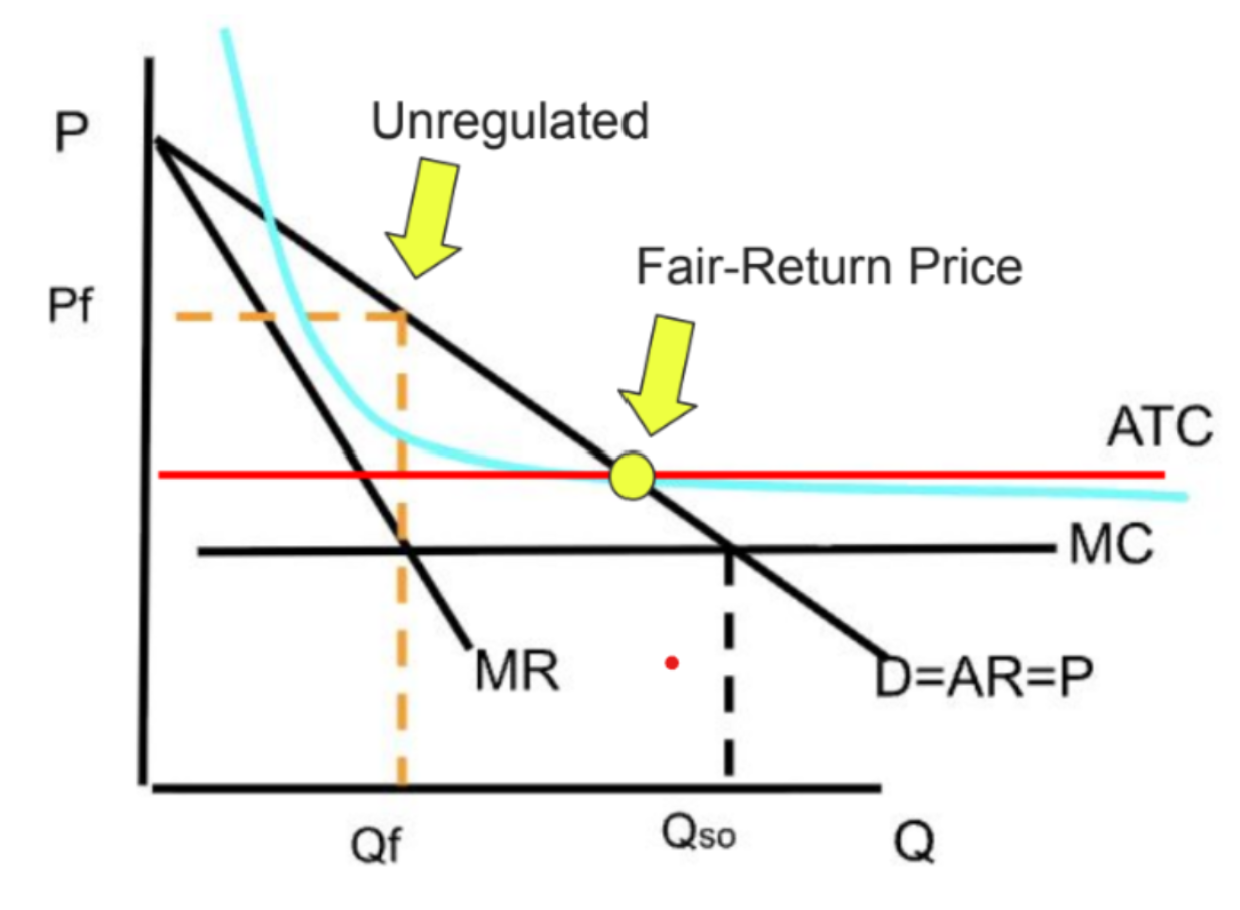
1.The monopoly price and quantity Pu and Qu when if it is unregulated.
2.The allocatively efficient price and quantity. A government price ceiling here would cause the firm to incur a loss.
3. Fair return price. A price ceiling here would still be inefficient, but there would be less deadweight loss and the firm would break even so it would continue to operate in the long run.
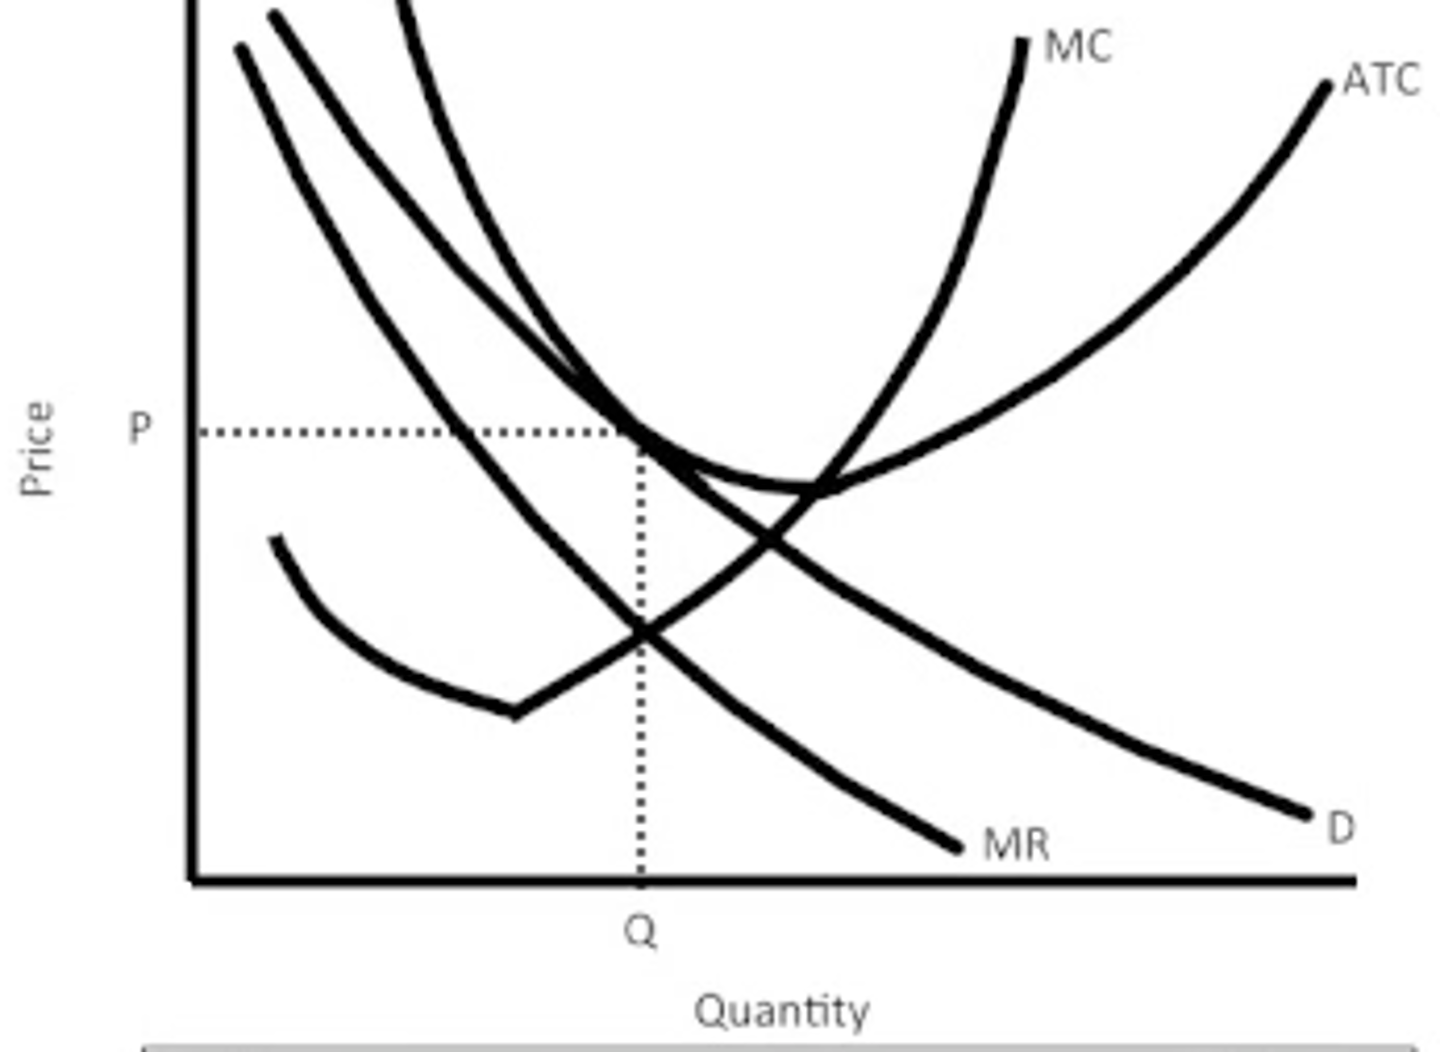
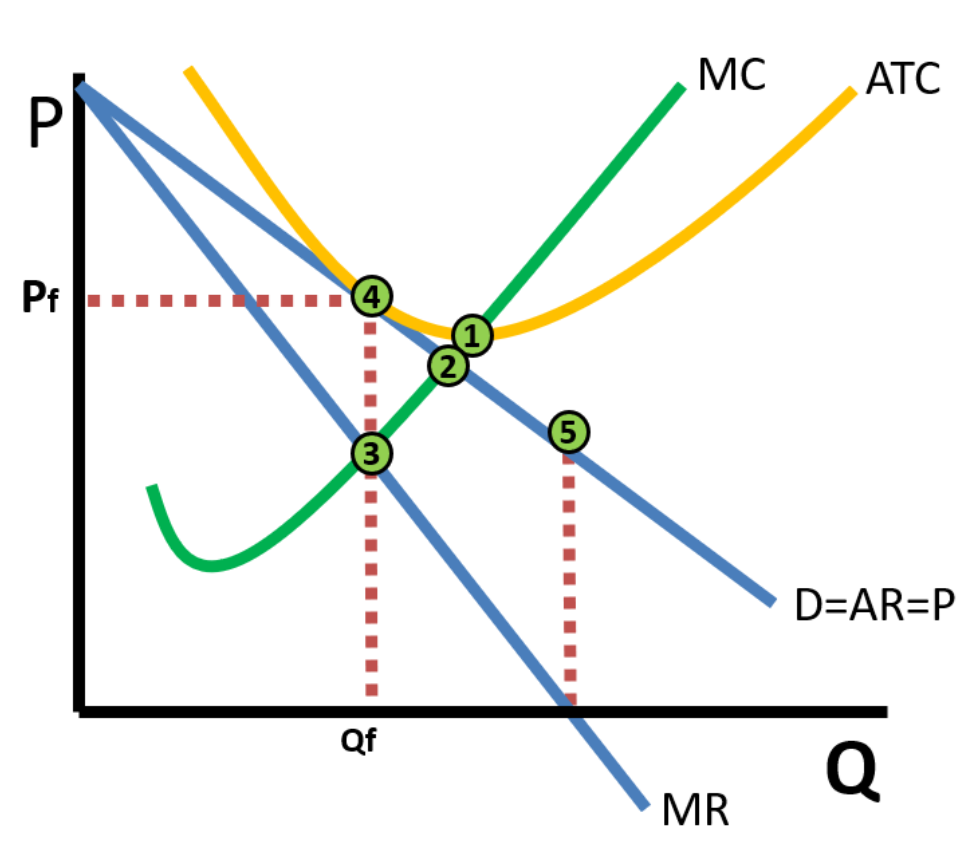
1.Productive efficient point
(Minimum of ATC)
2.Allocative efficient point
(MC=P) quantity below
3.Actual output (MR=MC) and price (DARP above MR=MC at point 4)
5.Unit elastic portion of the demand curve (where MR equals zero at that quantity). Demand is inelastic below and elastic above this point.
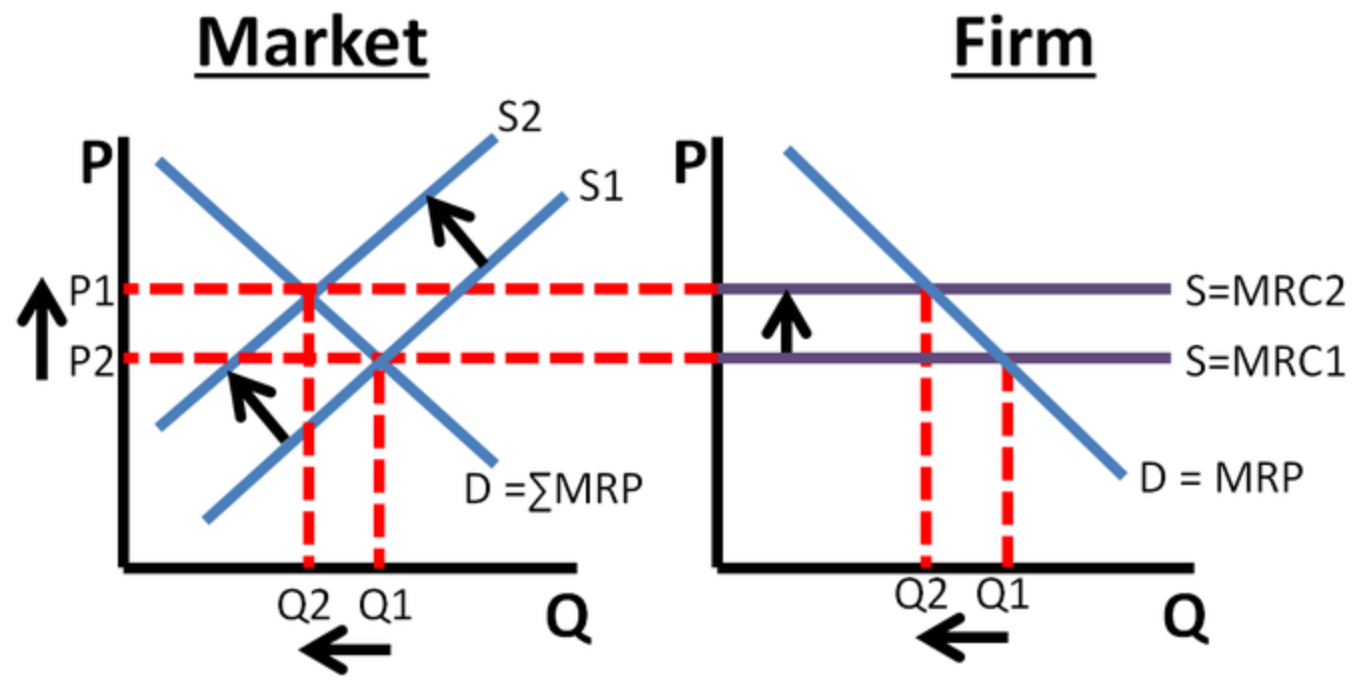
perfectly competitive market (supply decreases) (BOTH market and firm)
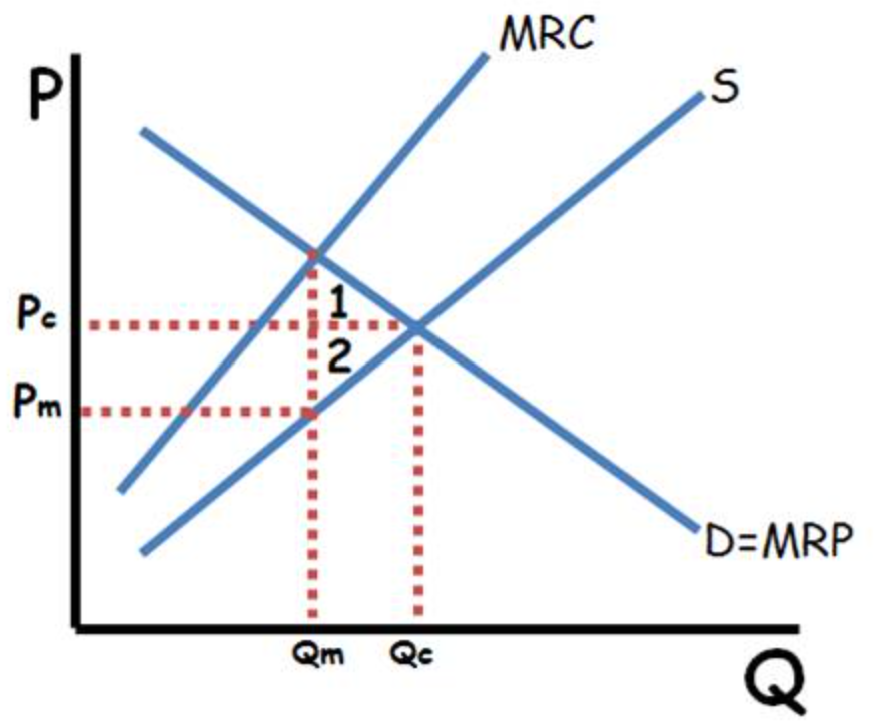
Monopsony Factor Market
Lorenze Curve
Negative Externalities with Per-Unit Excise Tax Correction on Producer
Positive Externalities with Per-Unit Consumer Subsidy Correction
Natural Monopoly (show unregulated, socially optimal, fair return)
socially optimal is when MC=P
Price discriminated monopoly (show where’s profit)