FINAL EXAM 2017
1/103
There's no tags or description
Looks like no tags are added yet.
Name | Mastery | Learn | Test | Matching | Spaced | Call with Kai |
|---|
No analytics yet
Send a link to your students to track their progress
104 Terms
Internal validity
•Can causal inferences be made?
•Not unique to experiments!
◦Degree to which the relationship between a predictor and outcome depends on another predictor
External validity
•To whom or what context can an association be generalized?
•cares about for whom or in what context
◦“depends on…”
“especially for…”
Construct
•How well was each variable measured?
Statistical
How well do the data support the conclusion?
Four big research validities
Internal, External, Construct, Statistical
The three claims
Frequency, Associative, Causal
Bivariate associations
How well do the data support the conclusion
An experiment may or may not have happened
Bi=two
Variate=variable
Continuous variable
•A variable with an “infinite” number of possible values
◦Height, for example, takes on a continuous range of values (0’0’’ to 7’0’’ or taller)
◦Other e.g., Likert ratings*, age, percentage of deep talk, anything* that can be denoted with a number
Categorial variable
•A variable with non-numerical categories as possible values
◦Class Standing, for example, takes on 4 possible categories
◦Other e.g., Class standing, Ethnicity, Experimental Treatment, Political Belief
example of continuous associations
Pearson’s r (continuous associations)
•A variable with non-numerical categories as possible values
◦Class Standing, for example, takes on 4 possible categories
◦Other e.g., Class standing, Ethnicity, Experimental Treatment, Political Belief
Correlation
standardized covariance: units have been removed
Forms of correlations
Person’s r
Spearmen’s rank correlation
Polychoric correlation
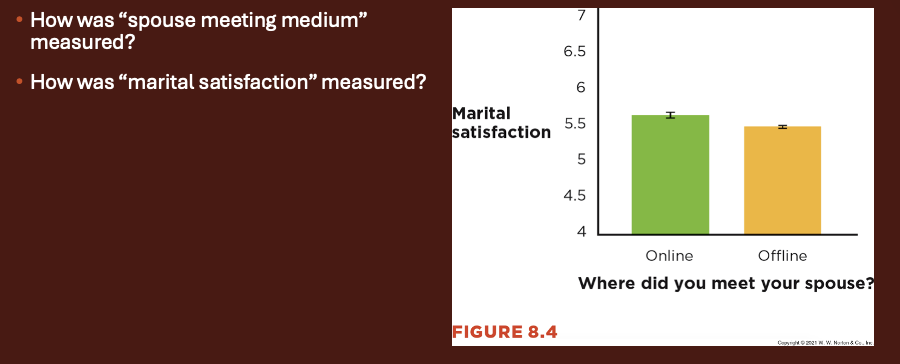
Continuous- categorical associations
•Sometimes one variable is categorical (e.g. meeting location) and the other is continuous (marital satisfaction)
•Scatterplots don’t show continuous-categorical associations very well
Which graph better depicts a continuous categorical association the best?
bar plots
Instead of a ___________, we can use a _________ which describes the difference in a continuous variable between groups of a categorical variable
Correlation analysis , t-test
Differe tn analyses are required when
normality assimtion is violated
Categorical associations examples
•Contingency tables
•Chi-square tests
•Appropriate correlations
Whey experiments support causal claims
1.Experiments establish covariance
2.Experiments establish temporal precedence
3.Well-designed experiments establish internal validity
Covariance picture example

Are the results correlated
Temporal precedence picture example

does the method establish which variable came first in time (if we cannot tell which came first, we cannot infer causation)
Internal validity picture example

is there a C variable that is associated with both A and B independently - if there is a plausible third variable we cannot infer causation
Correlation study
•– Type of study with no manipulated variables
◦Non-experiments
◦Doesn’t establish temporal precedence
◦Struggles to address other variables
Construct validity questions to ask
•Are data for the first variable valid and reliable?
•Are data for the second variable valid and reliable?
•If ever not, none of the proposed associations matter
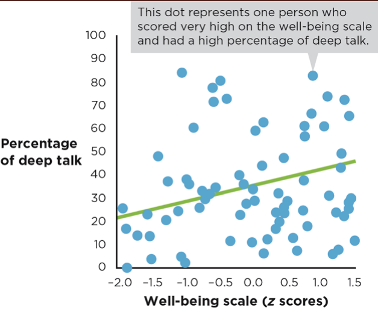
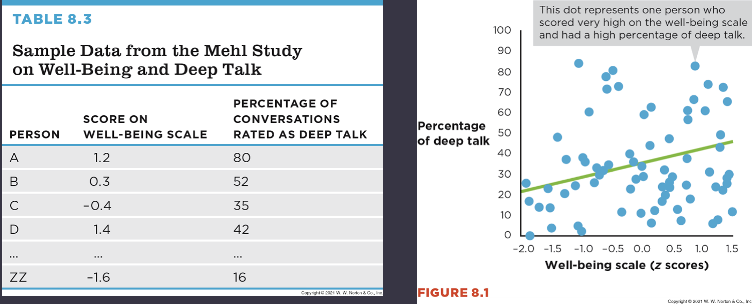
How was the percentage of deep talk measured?
How was Well-being measured?
Sound recorder worn for 2 to 10 days, recording 30 seconds at 12.5-minute intervals. Recordings were transcribed and coded
“subjective well-being scale
categorical variable
self-report scale- Likert scale
what are the questions you can ask to confirm construct validity? •“Standing at your desk can make you smarter!”
◦How was “Standing at your desk measured”?
◦Is that actually what was measured?
◦What does “smarter” mean?
effect size
Describes the strength of the association
◦Computation of effect sizes allows comparability across studies → Comparisons to “benchmarks”
how strong is the relationship
how many people were included in the study
precision
statistics that are estimates of the population values we actually care about
◦We don’t care about r, we care how well r estimates ρ
how precise is the estimate? - statistical significance
confidence interval
replication
•Studies and results should be replicated or conducted again
•Multiple studies act like multiple participants
◦Get a better understanding of where the true population value is
◦Meta-analyses
◦Can we get the same answer?
Has the result been replicated ?
Linearity
is the assumption of linearity satisfied?
outliers
•Values that are more extreme than expected or deviate substantially than expected from the rest of the sample
could bias the observed relationship between two variables
most problematic with small sample sizes
Are there any outliers? Have they been addressed?
Are there any restrictions on the range?
Effect size in a sample of 1,500 or more: r of .05 or -.05
very small or weak
Effect size in a sample of 1,500 or more: r of .3 or -.3
fairly powerful effect
Effect size in a sample of 1,500 or more: r of .4 or -.4
unusually large in psychology either very powerful or possibly too good to be true
Effect size in a sample of 1,500 or more: r of .1 or -.1
small or weak
Effect size in a sample of 1,500 or more: r of .2 or -.2
moderate
confidence interval
•Range of values for a statistic in which there is some probability (typically 95%) of containing the true population value
◦NOT that there is some percent chance that the true population value is within the interval (this would imply the true population value is a random variable – we’re not doing Bayesian statistics here!)
How to read CI’s
•APA style specifies how to write confidence intervals (CI’s) in results:
◦{stat} = ##, 95% CI [{lower ##}, {upper ##}]
•Example: r = -.57, 95% CI [-.77, -.37]
as sample size goes up….
certainty goes up, and confidence interval width narrows and goes down
Statistical significance or non-significance is the result of
hypothesis testing
◦Determining the likelihood that a sample statistic would be selected if the hypothesis regarding the population parameter were true
An estimate is statistically significant if
the probability of it occurring under the null hypothesis is less than some maximally acceptable cut off
p < .05
As sample size goes up, certainty goes up meaning…
◦If the effect isn’t zero, then statistical significance is even more likely
◦Meaning statistical significance is directly related to precision!
Linear associations: straight line
As X goes up or down, Y goes up or down
Assumption: ASSUMED by most statistical analyses typically used in psychological research.
Linear associations: curved line
As X goes up or down, Y might go up or down depending on the value of X (or another variable)
Assumption: NOT ASSUMED, but can be accounted for by entering quadratic or interaction effects
Assumption
a rule that data is supposed to follow
As study time increases, grades steadily increase
Not assumed
Violation (curvilinear reality):
Grades increase with study time… but after a point, too much studying leads to burnout and grades drop
Outlier treatment
Is it due to either user/experimenter error? or a legitimate data point
•Data should be analyzed with and without outlier to examine differences in outcomes
restriction of range
•when certain range of a variable is artificially excluded from the data. When range is restricted, the observed correlation may be attenuated (lowered)
spurious associations
•Association due to difference in means among subgroups
◦Somewhat a statistical and ex
Two variables appear related
BUT the relationship is actually caused by a third variable (a lurking variable) or group differences
interaction/moderation effects
•Not unique to experiments!
◦Degree to which the relationship between a predictor and outcome depends on another predictor
moderator
a variable that changes the relationship between two other variables
•A researcher studies the relationship between daily caffeine intake and test performance, finding a Pearson's r of .01. However, the scatterplot shows that students with moderate caffeine intake score perfectly, while those with zero or massive intake fail. What explains this near-zero correlation?
•
a.Restriction of range in the test scores
b.Pearson's r fails to detect non-linear associations
c.The relationship is spurious due to a third variable
B
•When a researcher is examining the bivariate association between exactly one categorical variable and one quantitative variable, which visualization is required?
•
a.A scatterplot showing the line of best fit
b.A bar graph showing the difference between group means
c.A correlation matrix showing the internal consistency
b
•A study reports a moderate positive correlation between video game hours and aggressive behavior. Further analysis reveals this correlation is strong for children who play alone, but completely non-existent for children who play with their parents. In this scenario, the playing context (alone vs. with parents) acts as a…
•
a.moderator
b.third variable
c.spurious association
A
•An organizational psychologist is hired to determine if typing speed predicts coding efficiency. They test 200 Senior Software Engineers at a highly competitive tech firm and find a correlation of r =.03. Which statistical validity threat is most likely responsible for this near-zero correlation?
•
a.A curvilinear relationship
b.The directionality problem
c.Restriction of range
C
•A university sends out a cross-sectional survey to its alumni. The results show a moderate negative correlation (r = −.42) between “current student loan debt” and “reported life satisfaction”. The university's financial office releases a statement saying “Having debt actively ruins our graduates' happiness”. What is the primary flaw in this causal claim?
•
a.The effect size is too small to establish true covariance.
b.The survey measured both variables at the same time, failing temporal precedence.
c.The survey used categorical data, which requires a bar graph rather than an r value.
B
•What is the relationship between moderators and external validity?
•
a.Moderators suggest that associations may be spurious.
b.Moderators suggest that an association between two variables will extend to another variable.
c.Moderators suggest that associations may not generalize to all subgroups of people.
d.Moderators are necessary for external validity to be established.
C
•RESEARCH STUDY 8.1: Dr. Guidry conducts a study examining the relationship between the number of friends one has and the experience of daily stress and life satisfaction. She randomly samples 1,500 elderly men and women in Nashville, Tennessee (the state capital), located in the southern United States. Below are her findings:
◦Life satisfaction and experience of daily stress: r = –.57, 95% CI [–.77, –.37]
◦Number of friends one has and experience of daily stress: r = .09, 95% CI [–.27, .45]
◦Number of friends one has and life satisfaction: r = .36, 95% CI [.12, .60]
•In determining whether the relationship between two of Dr. Guidry’s variables was statistically significant, which of the following must be considered?
a.sample size and effect size
b.sample size and number of variables analyzed
c.the number of outliers and the direction of the association
d.direction of the association and strength of the association
A