Enrgy and Nutrient Flow
0.0(0)
Studied by 0 peopleCard Sorting
1/36
There's no tags or description
Looks like no tags are added yet.
Last updated 1:24 AM on 4/11/26
Name | Mastery | Learn | Test | Matching | Spaced | Call with Kai |
|---|
No analytics yet
Send a link to your students to track their progress
37 Terms
1
New cards
Energy flow in ecosystems
Transfer of energy from the sun through producers to consumers in a unidirectional flow
2
New cards
Main energy source
Sunlight (solar energy)
3
New cards
Unidirectional flow
Energy flows one way because it is lost as heat at each trophic level
4
New cards
10% rule
Only about 10% of energy is transferred to the next trophic level; 90% is lost
5
New cards
Energy loss reasons
Respiration (heat), movement, faeces, uneaten parts
6
New cards
Trophic level
Position of organism in food chain or food web
7
New cards
Producer (autotroph)
Converts solar energy into chemical energy via photosynthesis
8
New cards
Consumer
Organism that obtains energy by feeding on others
9
New cards
Decomposer
Breaks down dead organic matter and recycles nutrients
10
New cards
Food chain
Linear pathway showing energy transfer
11
New cards
Food web
Interconnected food chains showing feeding relationships
12
New cards
Grazing food chain
Starts with living plants (producers)
13
New cards
Detritus food chain
Starts with dead organic matter
14
New cards
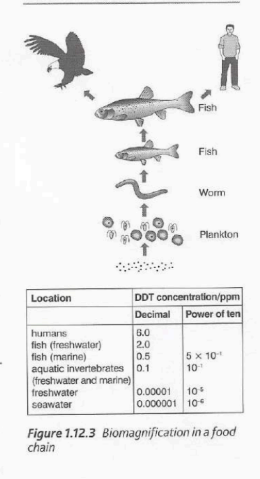
Bioaccumulation
Build-up of toxic substances in organisms from the environment
15
New cards
Biomagnification
Increase in concentration of toxins at higher trophic levels
16
New cards
Reason biomagnification occurs
Persistent, fat-soluble, biologically active pollutants accumulate in tissues
17
New cards
Example pollutant effect
Top predators have highest toxin concentration due to trophic transfer
18
New cards
Ecological pyramids
Diagrams showing energy, biomass, or numbers at trophic levels
19
New cards
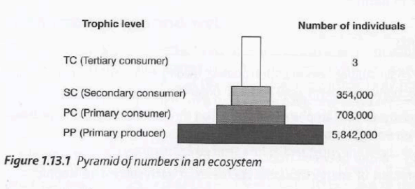
Pyramid of numbers
Shows number of organisms per trophic level per unit area
20
New cards
Shape varies
Can be upright or inverted depending on ecosystem
21
New cards
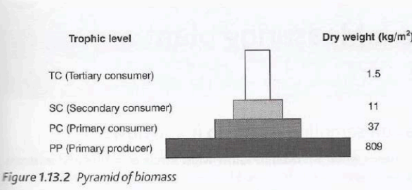
Pyramid of biomass
Shows total dry mass of organisms per trophic level
22
New cards
Terrestrial biomass pyramid
Upright (producers have highest biomass)
23
New cards
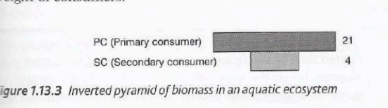
Aquatic biomass pyramid
Often inverted (phytoplankton < consumers due to rapid turnover)
24
New cards
Biomass
Total dry mass of living organisms in an ecosystem
25
New cards
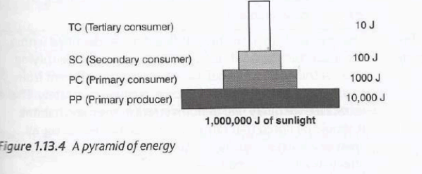
Pyramid of energy
Shows energy available at each trophic level per unit time
26
New cards
Energy pyramid shape
Always upright due to energy loss at each transfer
27
New cards
Example energy values
Sun → 1,000,000 J → producers 10,000 J → primary consumers 1,000 J → secondary consumers 100 J → tertiary 10 J
28
New cards
Productivity
Rate of production of organic matter in an ecosystem per unit time
29
New cards
Primary productivity
Rate at which producers convert energy into biomass
30
New cards
Secondary productivity
Rate at which consumers store energy as biomass
31
New cards
Gross Primary Productivity (GPP)
Total energy captured by photosynthesis
32
New cards
Net Primary Productivity (NPP)
Energy stored in plant biomass available to consumers
33
New cards
NPP formula
NPP = GPP − respiration
34
New cards
Units of productivity
g m⁻² day⁻¹ or kg m⁻² yr⁻¹
35
New cards
Importance of NPP
Represents energy available to all higher trophic levels
36
New cards
Energy efficiency conclusion
Short food chains are more efficient than long ones
37
New cards
Human energy implication
Eating plants (e.g. crops) provides more usable energy than eating animals