Synoptic Charts
0.0(0)
Studied by 0 peopleCard Sorting
1/8
Earn XP
Description and Tags
How to use synoptic charts.
Last updated 7:23 AM on 5/28/26
Name | Mastery | Learn | Test | Matching | Spaced | Call with Kai |
|---|
No analytics yet
Send a link to your students to track their progress
9 Terms
1
New cards
Synoptic charts
Charts used to display weather data.
2
New cards
Weather
Short term rain, temperature, and wind combined.
3
New cards
Climate
Long term rain, temperature, and wind combined.
4
New cards
Unit of measurement
Hectopascals (hPa)
5
New cards
Magic Number
1013hPa
6
New cards
Greater than 1013hPa
High pressure system.
7
New cards
Less than 1013hPa
Low pressure system.
8
New cards
How to read wind direction:
Where it’s coming from, not going to.
9
New cards
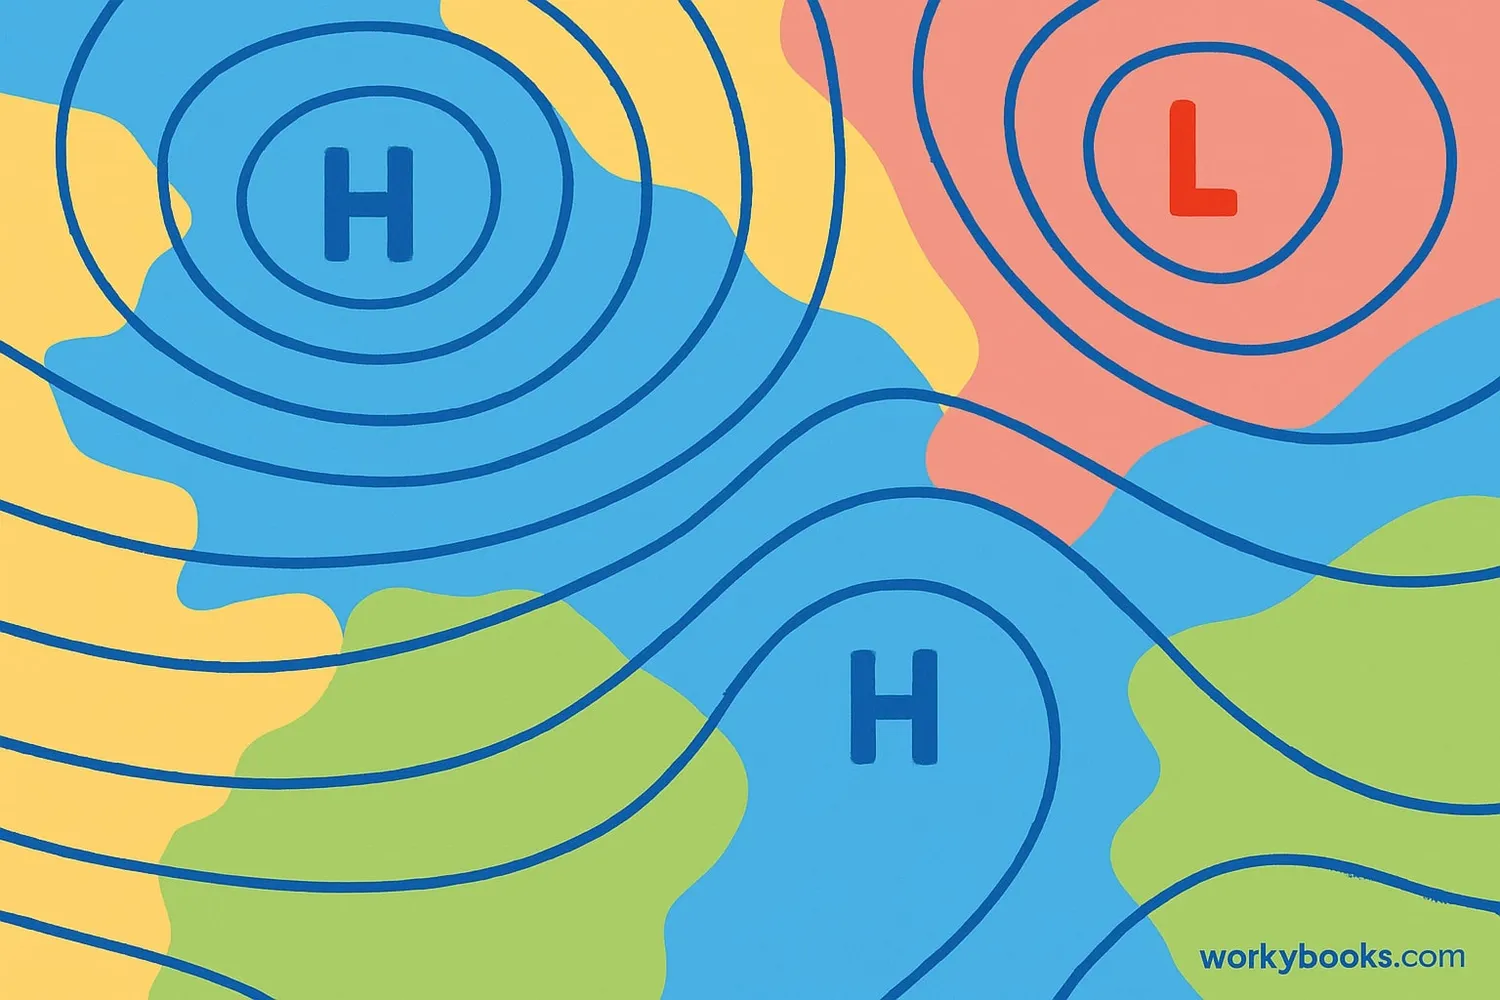
Isobar
Lines joining places of equal pressure.