EC140 Pre Midterm
1/63
Earn XP
Description and Tags
Chapters: 1, 2, & 2 Appendix 3, 5, 6, 8, 9. (more focus on chapters 5 and 6, then 8,9 then rest)
Name | Mastery | Learn | Test | Matching | Spaced | Call with Kai |
|---|
No analytics yet
Send a link to your students to track their progress
64 Terms
What is Economics?
Studies how society uses scarce resources to satisfy unlimited human wants
Economics is a social science
Examines issues and problems from a social perspective, not personal perspective
Key Idea: Scarcity
People and societies face trade-offs
So they must make choices
But making choices leads to costs
These costs are known as opportunity costs
Opportunity Cost
Definition: The best/highest alternative forgone
Ex. Suppose you have 3 activities (hiking, skiing, studying), if you choose to study, your opportunity cost of studying is the highest(in value) of skiing or hiking
Includes direct costs + indirect costs
Direct costs: Aka explicit costs are costs paid for out of pocket or paid directly in cash
Indirect costs: also known as implicit costs are not paid to anyone in cash but are forgone costs - ex. when a firm decides to operate a business and invests $5000, an indirect cost is the interest forgone if the $5000 was invested
Scarcity vs. Poverty
They are not the same
The poor and the wealthy alike face scarcity
Need is not a microeconomic/macroeconomic concept
Equity
The benefits from society’s resources are distributed fairly among its members
Efficiency
Society getting the most it can from its scarce resources
Margin
A choice at the margin is a decision to engage in one more unit of an activity
Incentive
A motivation to perform a particular activity
Sunk cost
A cost that has already been incurred and cannot be recovered
Positive Statement
A description of what is, can be proven true or false by examining facts
Ex. There are 5000 students enrolled in first year uni
Normative Statement
A description of what ought to be, a value judgement (not necessarily true of false)
Ex. People should not be gay.
Model
Description of how cause and effect work in some part of the economy
Factors of Production
Also known as inputs/economic resources (ex. land, labour, capital)
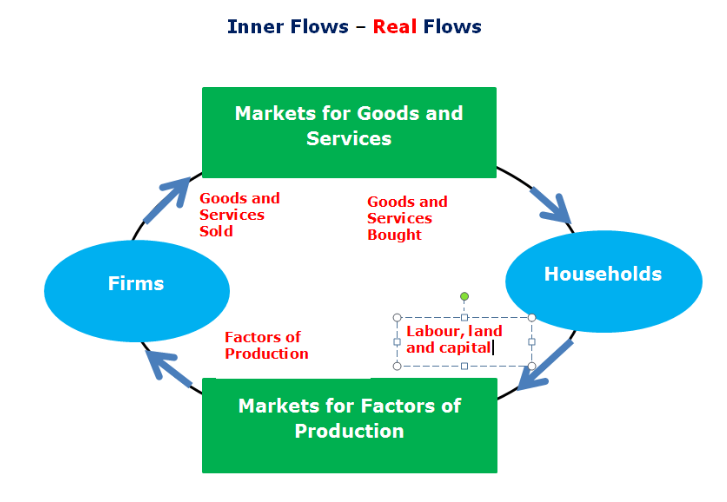
Circular flow diagram
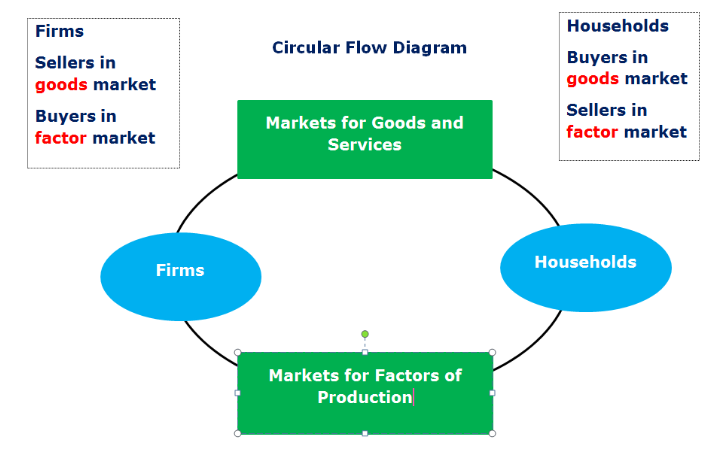
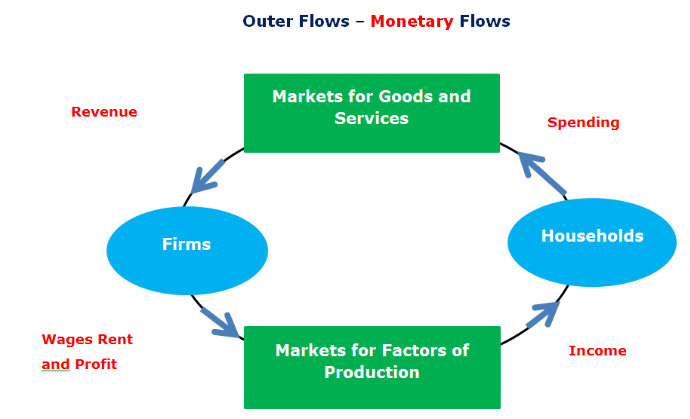
Inner Flow vs. Outer Flow
Gross Domestic Product (GDP)
The mv of all final goods/services produced (and income earned) within a country in a given period of time (such as a year) valued at market prices.
Nominal GDP
Ex. a 2-good economy that products laptops and ipads
Laptops ($15, 1000 count)
Ipads ($5, 2000 count)
Nominal GDP = $15 × 1000 + $5 × 2000 = 25,000
Essentially, this is the sum of price x quantity of all products
Important facts about GDP
GDP is a
Production concept
Flow variable (a variable with a time dimension
GDP does not include
Intermediate goods (ex. car engine in a car) - only final goods
Used or second hand goods
Non-marketed goods and services
Financial Assets
GDP Excludes
Used or second hand goodsh
Intermediate goods
Goods intended for resale or processing (ex. paper used in a greeting card)
Card is considered a final good so if we were to include intermediate goods in the definition of GDP, we could be overestimating the value of GDP
How do we measure GDP
For the economy as a whole, total expenditures must equal total income received. GDP measures these two things:
Expenditure approach
The total sum of expenditures on all final goods and services.
Adds up all that is spent to buy up this year's output.
Income approach
The total sum of all factor income payments.
The reason that GDP can perform the trick of measuring both total income and total expenditure is that these two things are really the same.
Expenditure Approach
Y (GDP) = C (personal consumption expenditures) + I (investment expenditures) + G (government expenditures) + NX (net exports)
Y = C + I + G + NX
Consumption Expenditures (C)
Includes spending by domestic households on final goods and services including those produced abroad
Excludes the expenditure on new homes, which is counted as part of investment
Accounts for 60% of GDP
Constitutes the largest component of GDP
Investment Expenditures
The purchase of goods that will be used in the future to produce more goods and services
Sum of purchases of:
Capital equipment
Inventories
Structures
Inventories
Finished or semi-finished goods
Changes to inventories can be positive or negative
Inventory change is included as a expenditure item when we compute GDP
Government Expenditures (G)
G - Government Purchases
Spending on goods and services by local, territorial, provincial and federal governments
Does not include:
Transfer payments
Examples - unemployment insurance, CPP, OAS and welfare
Transfer payments do not alter the economy's production
Net Exports (NX)
NX = purchases of domestically produced goods by foreigners (exports) - domestic purchases for foreign goods (imports)
All exports are considered final goods and counted in GDP
Imports contribute to another country’s GDP not to the domestic country’s GDP
Income Approach
measures GDP by adding together to incomes earned by all the factors that went into producing GDP:
Compensation of Employees
Wages, salaries and benefits
Makes up to 51% of GDP
Gross operating Surplus
income of corporation and government business enterprises
Gross Mixed income
Income paid to unincorporated businesses
Examples of unincorporated businesses include sole proprietorships and partnerships
Taxes less subsidies
Taxes include indirect taxes such as a sales tax or an excise tax
Taxes are added to GDP because their value is included in the market value of goods
Statistical Discrepancy
= GDP income based
Gross National Product (GNP)
GNP = GDP (Foreign investment income paid to foreigners) + Foreign investment income received by Canadians
Ex. A Canadian engineer may earn income by working on a dam building project in Pakistan
GNP vs. GDP
GNP (canada): output produced by a country’s domestic residents (ex. Canadians) at home and abroad
GDP (rest of world): includes output produced within the borders of Canada both by foreigners and domestic residents
Nominal GDP
Measures to value of the economy’s production of goods and services in current year prices (changes overtime because price and quantity change)
Real GDP
To obtain a measure of the amount produced that is not affected by changes in prices, we use real GDP
Real GDP is the production of goods and services valued at constant prices
Real GDP for year 1
year 1 prices x year one quantities
Real GDP for year 2
year 1 prices x year 2 quantities
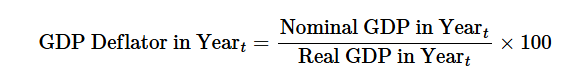
GDP Deflator
price index that tells us how much prices rise in a specific year
Formula for GDP Deflator
Inflation Rate
Percent change in the GDP deflator from one year to the next
[final value - initial value]/initial value x 100
GDP ignores:
Size of the population
Consumption of leisure
Non-marketed economics activities
Environmental quality
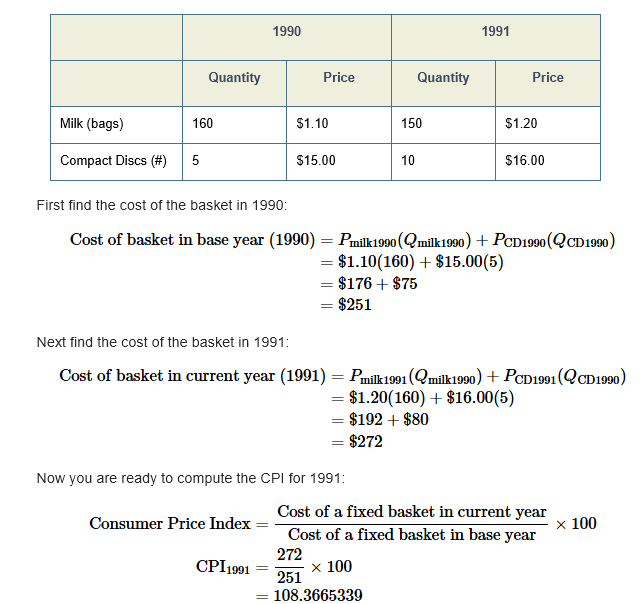
Consumer price index (CPI)
A measure of the overall cost of the goods and services bought by a typical consumer
Used to monitor changes in the cost of living over time
When the consumer price index rises, a typical family has to spend more to maintain the same standard of living
CPI Formula
Inflation
An increase in the overall level of prices in the economy, usually expressed as an annual percentage change in a price index
Deflation
A decrease in the overall level of prices
Disinflation
A decrease in the rate of inflation
Finding CPI example
Three biases in measuring the CPI
Commodity substitution bias: Prices change unproportionally, people shift to cheaper substitutes
New goods bias: introduction of new good gives consumers more variety of choice → increases value of the dollar
Unmeasured quality change: when quality of good deteriorates, value of dollar falls and when quality of a good increases, value of a dollar increases
GDP Deflator vs. Consumer Price Index
GDP Deflator
Includes all goods and services produced domestically
Does not include imports
Does not have a fixed basket
Consumer Price Index
Includes all goods and services bought by consumers
Does include imports
Does have a fixed basket and is revised by Statistics Canada only occasionally
Market for loanable funds
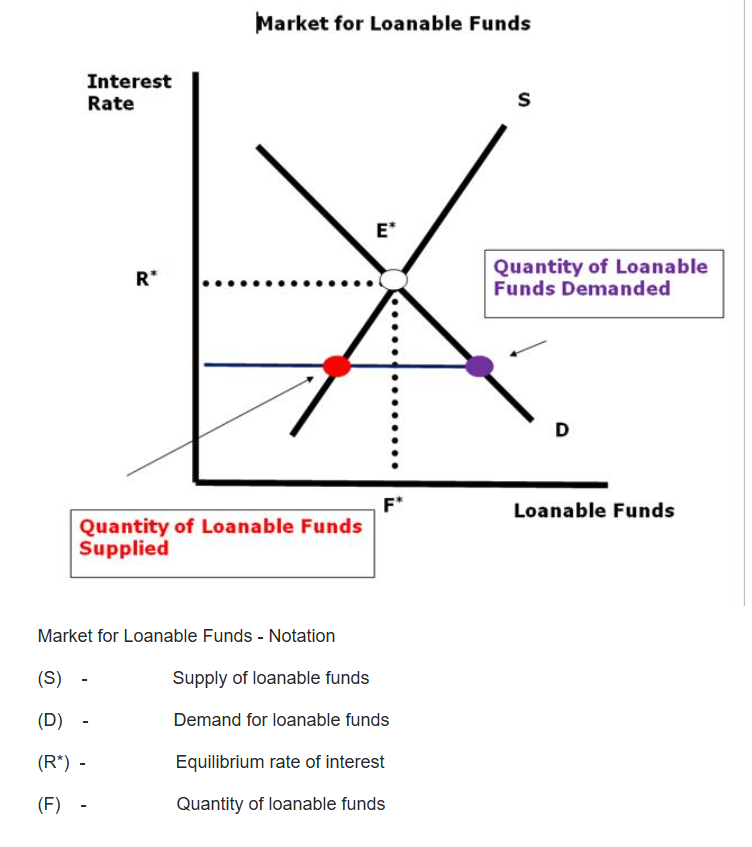
Nominal Interest rate vs. Real Interest rate
Nominal: has not been corrected for inflation
Real: correct for inflation
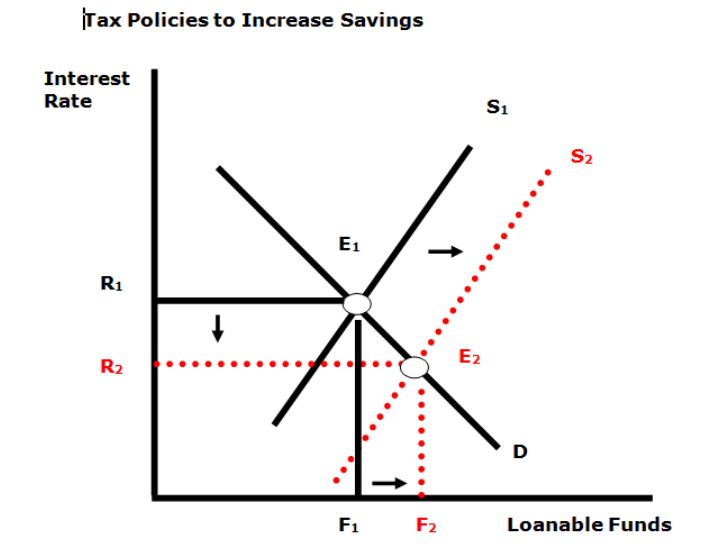
Government Policies that increase saving
lower tax rate on interest income and dividends
lower capital gains tax
increase in the amount individuals can contribute to deferred RRSPs
Economists assume people respond to saving incentives
Tax policies to increase savings (graph)
Government Policies to Increase investment (graph)
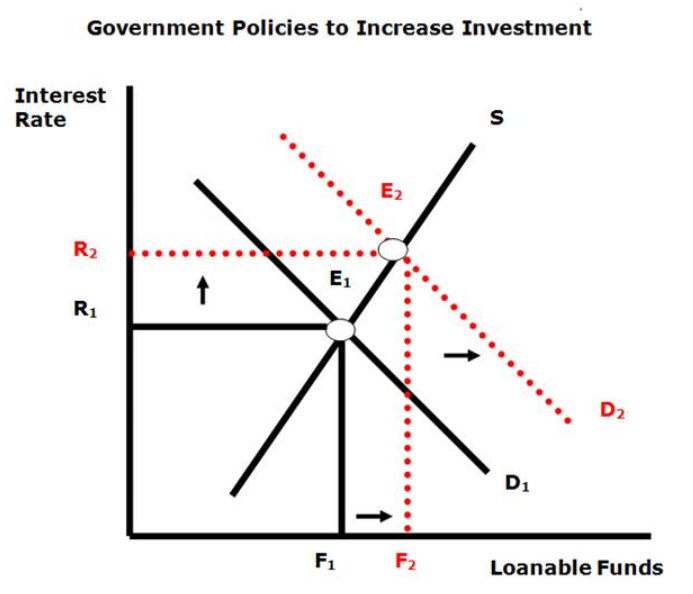
Crowding out
decrease in investment that results from government borrowing
National Savings
The source of the supply of loanable funds is composed of private saving and public saving
Grim Consequences of government deficits (graph)
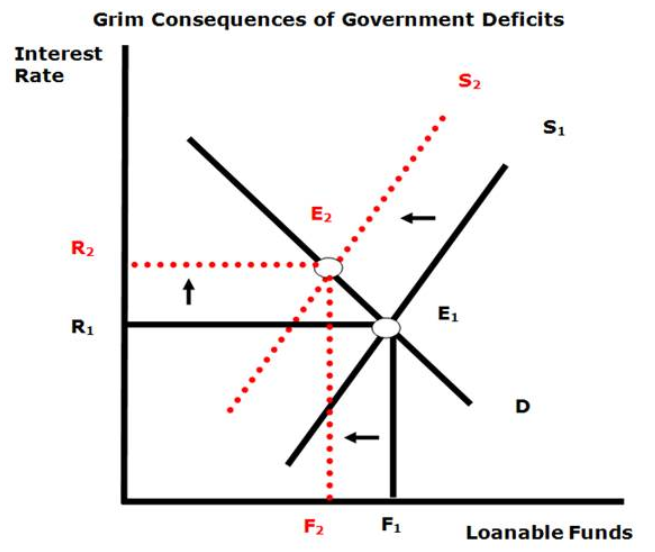
Facts about the deficit: We owe it ourselves
Some people have argued that government deficits are not a problem if we owe the government debt to ourselves
However this is not the case
Deficits Arising from Recessions (Cyclical Effects)
During recessions, government revenues decline
Debit arises for capital expenditures
Government Budget Deficits and Surpluses
One of the most pressing policy issues of the past 20 years has been the size of the government budget deficit
Government Debt
The sum of all past budget deficits minus the sum of all past budget surpluses
What is unemployment measured by
Labour Force Survey (LFS)
Determines employed, unemployed, not in labour force
Types of unemployment
Frictional unemployment (search employment): results from workers taking extra time to search for jobs suiting their interests and skills
Structural unemployment: # of jobs available are