Extraneous Variables, Qualitative Data and Correlation
1/33
There's no tags or description
Looks like no tags are added yet.
Name | Mastery | Learn | Test | Matching | Spaced | Call with Kai |
|---|
No analytics yet
Send a link to your students to track their progress
34 Terms
Extraneous Variables (EV)
•Factors other than the IV that could affect the dependent variable.
•Could include the participant (emotions & personality), environment (temperature etc.) or researcher.
•Control Variables (CV)
•What WILL you keep the same?
•Variables that are kept the same across the experiment.
•When the effects of an extraneous variable have been removed from the experiment, the variable is said to be ‘controlled’.
————————————————————————————————
to keep specific factors constant throughout the study to ensure a fair test, enhance internal validity
a factor held intentionally constant in an experiment to provide a reliable baseline of comparison
Extraneous Variables
•Factors that can affect the results of a research study but are not the variables of interest.
•Three types:
1.Participant variables: characteristics of the individuals taking part in the study, e.g. age, gender, personality, and previous experience
2.Environmental variables: aspects of the environment in which the study takes place, e.g. temperature, noise, lighting, or the presence of other people
3.Researcher variables: characteristics of the researcher conducting the study, e.g. the researcher's biases, expectations, and behaviour towards the participants
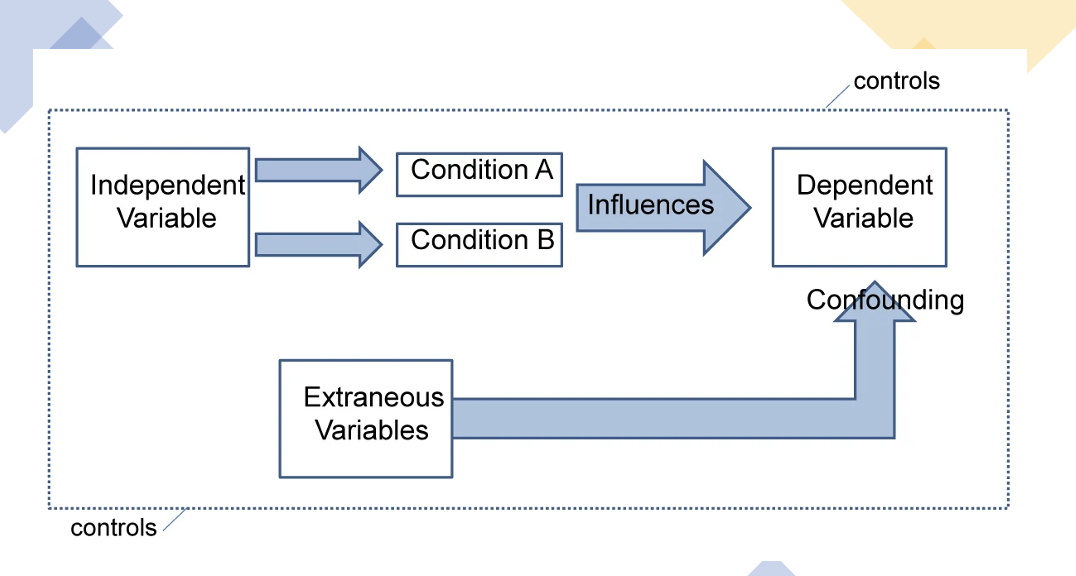
Confounding Variables
Impacts IV and DV
•When an EV has not been properly controlled and interferes with the DV it is called a confounding variable.
•Confounding variables can lead to inaccurate or misleading results in a study.
•If a confounding variable exists, no valid conclusions about the research can be drawn!
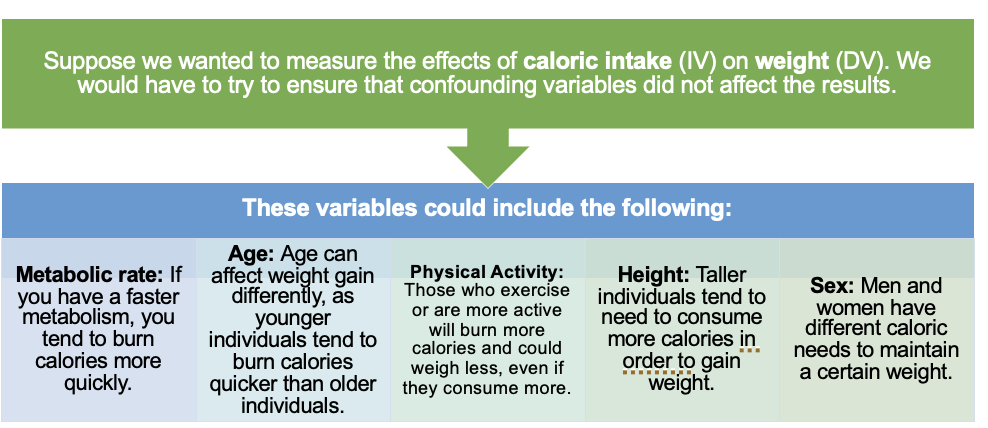
Confounding Variables examples
•For example, in a study examining the relationship between caffeine consumption and sleep quality – age could be a confounding variable.
•Older adults may consume less caffeine and experience poorer sleep quality than younger adults, but age is also related to caffeine consumption and sleep quality.
•If age is not controlled for in the study, it could confound the relationship between caffeine consumption and sleep quality, making it difficult to determine if caffeine is causing the observed effect on sleep quality or if age is the actual cause.
Sources and effects of extraneous variables and confounding variables
•Experimenter effect
•Demand characteristics
Experimenter effect
•Experimenter effects are unintentional actions by researchers that can influence study outcomes.
•There are two main types of experimenter effects:
1.Experimenters’ interactions with participants can unintentionally affect their behaviours.
2.Errors in measurement, observation, analysis, or interpretation may change the study results.
•This can occur due to biases, expectations, or behaviour of the researcher towards the participants.
Demand characteristics
•Unfortunately, research participants often act and speak in ways that are not consistent with how they would otherwise normally behave in the real world. This is a result of demand characteristics (Orne, 1959).
•Demand characteristics are subtle hints that suggest to the participant what the experimenter predicts or hopes to find in the study.
Common demand characteristics
1. Study rumours
•Information relevant to the experiment but learned about outside of the experiment itself (Orne, 1962).
•For example, a study may ask a participant to read a story at the beginning and, unbeknownst to the participant, prompting the participant to recall details from the story after completing a series of other unrelated tasks.
•If rumours circulate that this is the procedure, a participant may pay extra close attention and make an effort to remember the details, thus skewing the results of the study.
2. Lab setting
•The specific location in which the experiment is being performed (Orne, 1962). For example, if a study is conducted in a laboratory setting, as opposed to a more natural setting, such as a gym or a classroom, it may place hidden demands on the participant to respond in a certain way.
3. Order of procedure
•The order of the actual questions in the experiment may bias the participants to answer in a certain way (Orne, 1962).
•For example, if demographic questions are asked at the beginning, a participant will become more cognizant of their own demographics, such as their race, gender, or socioeconomic status, and may subconsciously (or consciously) behave or respond to subsequent questions in a way that adheres to stereotypes or expectations about that group.
•In psychology, this is called a self-fulfilling prophecy (Merton, 1948), whereby exposure to a person’s beliefs about the expectations of their group leads them to act in such a way that conforms to these expectations.
4. Explicit or implicit communication
•Any form of communication, whether intentional or unintentional, can affect the outcome of the study (Orne, 1962).
•For example, the researcher might consciously or unconsciously smile or frown during the experiment, suggesting to the participant that their answers are what the researcher did or did not hope for, thus affecting the participant’s future responses.
•These are just some examples!
•Even the title of an experiment or tools such as video cameras can create hidden demands for how a participant should act during the study.
Minimise the effects of extraneous and confounding variables
•Random allocation
•Single-blind procedures
•Standardisation of techniques & procedures
Random allocation of participants
•Randomization will help eliminate the impact of confounding variables.
•Participants have an equal chance of either being in the experimental or control groups. This can be achieved by drawing names out of a hat.
•Randomly assign half of your subjects to a treatment group and the other half to a control group.
•This ensures that confounding variables have the same effect on both groups, so they cannot correlate with your independent variable.
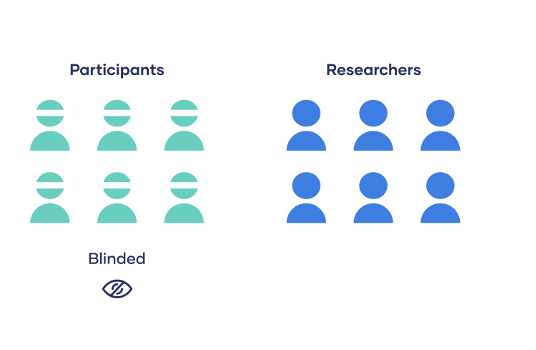
Single-blind procedures
•Participants are unaware of the specific purpose or hypothesis of the study.
•They are not told which group they belong to (either the E-group or C-group) or what type of treatment they are receiving.
•Used to control for demand characteristics. If participants are aware of the hypothesis or purpose of the study, they may alter their behaviour or responses to conform to what they think the researchers expect.
Single-blind procedures
•E.g. in a memory experiment, participants may be given a list of words to study and then asked to recall as many as they can.
•In a single-blind procedure, participants are not told what the specific hypothesis or aim of the study is, which reduces the likelihood that demand characteristics may influence their performance.
Standardisation of procedures and instructions
•It involves developing a consistent set of procedures and instructions that are followed uniformly across all participants in a study.
•The goal of standardisation is to minimize the effects of extraneous variables on the results of the study and to ensure that the study is replicable, allowing for greater confidence in the validity of the results.
•In a standardised study, all participants are given the same instructions, asked the same questions, and provided with the same materials.
•Experimental procedures and instructions can be put into place to ensure that both the experimental and the control group conditions are the same, e.g. the temperature of the room.
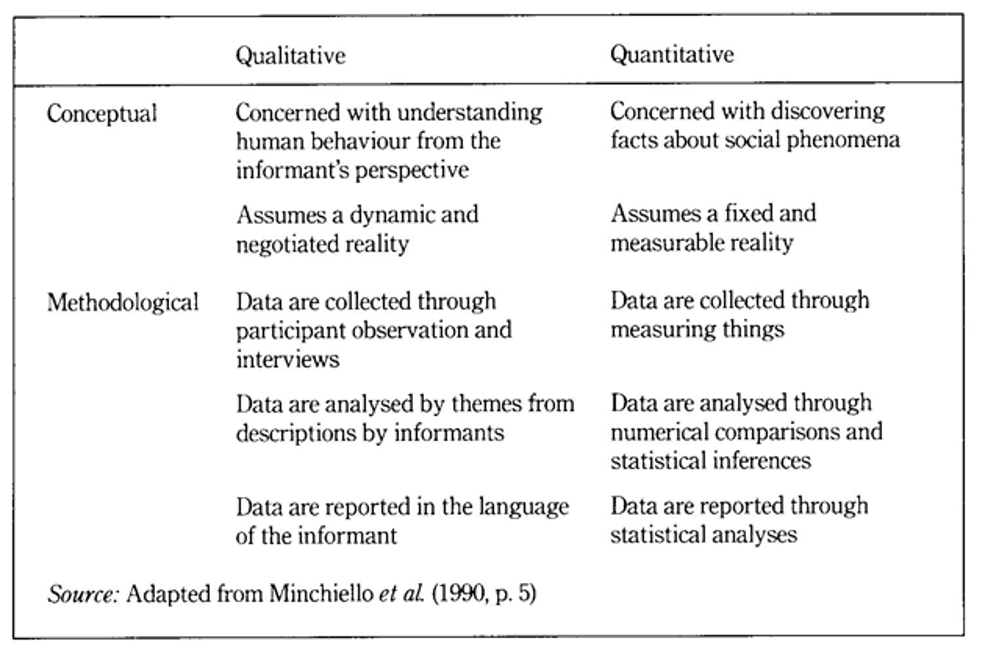
Quantitative v. Qualitative
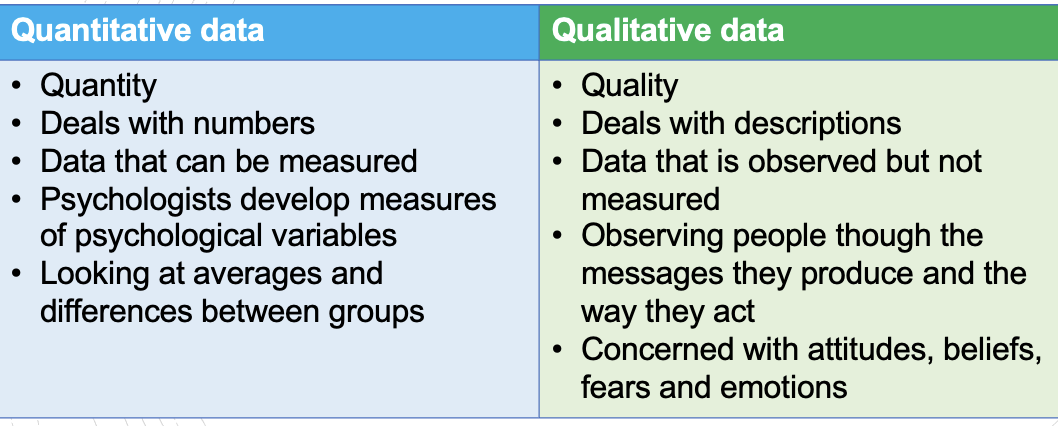
•Quantitative data is data that represents how much, how long, how many etc.
•i.e. When behaviour is measured in numbers or quantities.
•The DV in an experiment is quantitative.
•Qualitative data can’t be counted or quantified, and it deals in descriptions.
Quantitative v. Qualitative
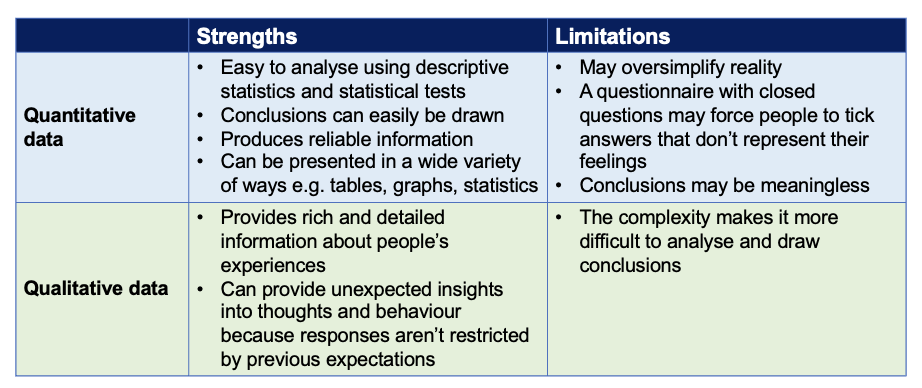
Quantitative v. Qualitative Strengths and weakness
Interviews
•Application: Used to gather in-depth information about a person's thoughts, feelings, and experiences. They can be conducted in a one-on-one setting or in a group and can be structured (with predetermined questions) or semi-structured (allowing for flexibility and follow-up questions).
•Strengths: Allow for detailed information to be gathered about a person's experiences or perceptions. They can also allow for flexibility in the questions asked and can lead to a deeper understanding of the topic being studied.
•Limitations: This can be time-consuming and expensive to conduct, and the data collected can be difficult to analyse due to the large amount of information gathered.
Focus group interviews
•Application: Used to gather data from a group of participants in a semi-structured setting. They are often used to gather data on group dynamics or to gain insights into a particular topic.
•Strengths: Can provide rich data from a group of participants, allowing for a deeper understanding of group dynamics and perceptions. They can also be used to gather data from a larger number of participants in a shorter amount of time.
•Limitations: This may not allow for in-depth exploration of individual experiences or opinions, and participants may not always feel comfortable sharing their thoughts in a group setting.
Structured interviews
•Application: Used to gather data on a particular topic using predetermined questions. They are often used to gather quantitative data or to ensure consistency across participants.
•Strengths: Provide a standardized approach to data collection, ensuring consistency across participants. Data can be easier to analyse.
•Limitations: Structured interviews may not allow for in-depth exploration of individual experiences or opinions, and may not be able to capture unexpected or unplanned information.
Semi- structured interviews
•Application: Used to gather data on a particular topic using predetermined questions, while also allowing for flexibility in follow-up questions and exploration of individual experiences and opinions.
•Strengths: Provide a balance between structure and flexibility, allowing for in-depth exploration of individual experiences and opinions while also ensuring consistency across participants. They can provide rich data.
•Limitations: Can be time-consuming to conduct and analyse, and may not be able to capture unexpected or unplanned information.
Open-ended survey
•Application: Allow participants to provide detailed responses to open-ended questions, providing insights into their thoughts and experiences. They are often used to gather qualitative data about a particular topic.
•Strengths: Allow for detailed responses, providing a rich source of data. They can also be used to gather data from a large number of participants.
•Limitations: Time-consuming. The data collected can be difficult to analyse due to the subjective nature of the responses. Additionally, participants may be less likely to complete open-ended surveys than structured surveys.
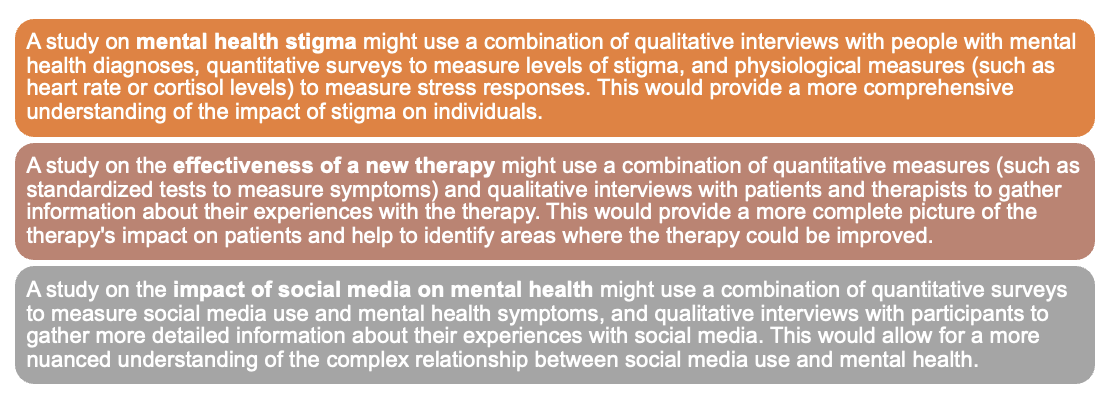
Mixed methods
•Data collection may be a combination of qualitative and quantitative data
•Application: Often used to gather a range of data about a particular topic. They can provide a more comprehensive understanding of the topic being studied.
•Strengths: Provide a range of data, allowing for a more comprehensive understanding of the topic being studied. Easier to ensure the validity of the results.
•Limitations: This can be time-consuming and expensive to conduct, and may require a larger research team. Additionally, the data collected can be difficult to analyse due to the different types of data gathered.
Mixed methods
Subjective measures
•Application: Used to gather data about a person's thoughts, feelings, or behaviours. They can be used to gather data on a wide range of topics.
•Strengths: Easy to administer and analyse, and can provide valuable insights into a person's thoughts or feelings.
•Limitations: Participants may not always provide truthful responses, and the data collected may be influenced by social desirability bias.
Social desirability bias
s a tendency for people to give socially desirable responses rather than their true opinions or beliefs when responding to surveys, questionnaires, or other forms of research. This can be due to a desire to present oneself in a favourable light or to avoid being judged negatively by others.
For example, participants may over-report desirable behaviours or attitudes, such as exercise or charitable donations, and under-report undesirable behaviours or attitudes, such as drug use or prejudiced beliefs.
Social desirability bias can be a problem in research because it can lead to inaccurate data and affect the validity of the results. Researchers can minimize the impact of social desirability bias by using anonymous surveys, emphasizing the importance of honesty, using indirect measures, and employing multiple methods of data collection. Additionally, researchers can use statistical techniques to detect and control for social desirability bias in their data analysis.
Rating scales
•Application: Used to gather data by having participants rate or rank items on a continuum. They are often used to assess attitudes, opinions, or subjective experiences.
•Strengths: Provide quantitative data that is easy to score and analyse, and can be used to assess a large number of participants in a short amount of time. They can also provide a standardized approach to data collection, ensuring consistency across participants.
•Limitations: May not capture the full complexity of a participant's experience or perspective, and may not allow for the exploration of individual experiences. They can also be subject to biases or inaccuracies if participants do not understand the instructions or do not answer honestly.
Likert scales
•A Likert scale is a type of rating scale used to measure attitudes, opinions, or perceptions of individuals. It is named after its developer, psychologist Rensis Likert.
•A typical Likert scale consists of a series of statements, often related to a specific topic, and participants are asked to rate their level of agreement or disagreement with each statement on a scale typically ranging from 1 (strongly disagree) to 5 (strongly agree).
•However, the number of scale points can vary, and some scales may use a 7-point or 10-point scale.
Likert scales examples
•E.g. "To what extent do you agree with the following statement: I enjoy going to the gym." Participants could then choose from options such as: "strongly disagree," "disagree," "neither agree nor disagree," "agree," or "strongly agree."
•Widely used and popular way to measure attitudes or opinions.
•Data is easy to analyse.
•Easy to administer and understand – gather large amounts of data from a wide range of participants
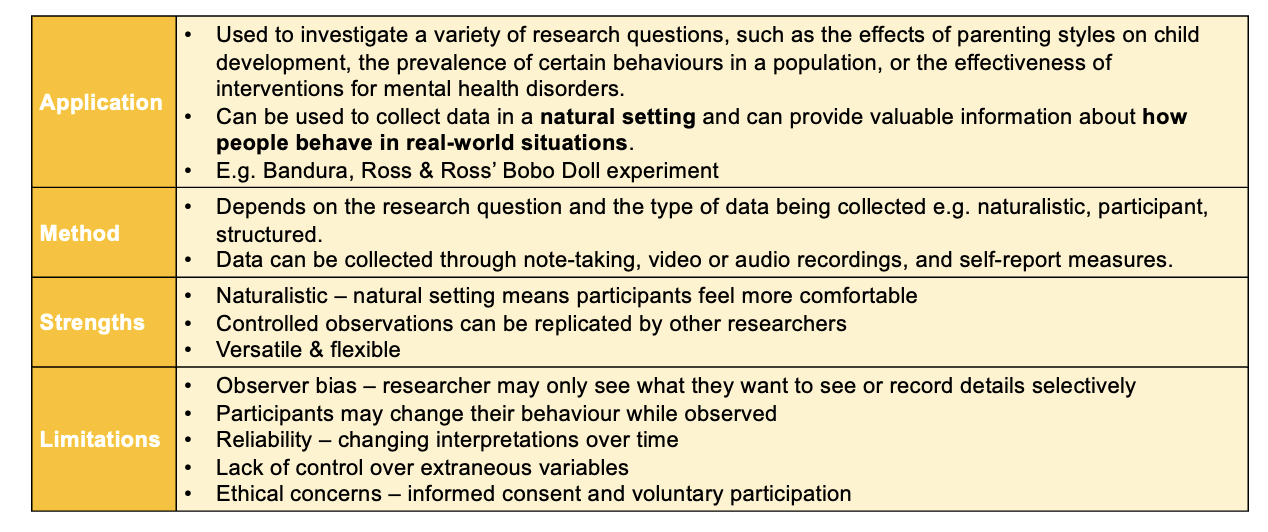
Observational studies
•Observational studies are a type of non-experimental research that involve the observation and measurement of naturally occurring phenomena in a real-world setting.
•Commonly used in psychology to gather data about behaviour and mental processes.
•Different types:
•Naturalistic observation: The researcher observes and records behaviour in a natural setting without intervention.
•Participant observation: The researcher participates in the setting being studied, and may interact with participants to gather data.
•Structured observation: The researcher sets up a specific situation or environment to observe behaviour.
•
Summary of observational studies
Quantitative Data
•Information in the form of numbers that can be counted.
•Quantity
•How often something happens - frequency
•Can determine how strong someone’s belief, attitude or value is
•Using a rating scale determines strength i.e. strongly agree to strongly disagree
•Timers to measure frequency, speed, duration
•Can use statistics to analyse data
•Can start as qualitative and end up as quantitative data. i.e. % of interviews responding with same themes
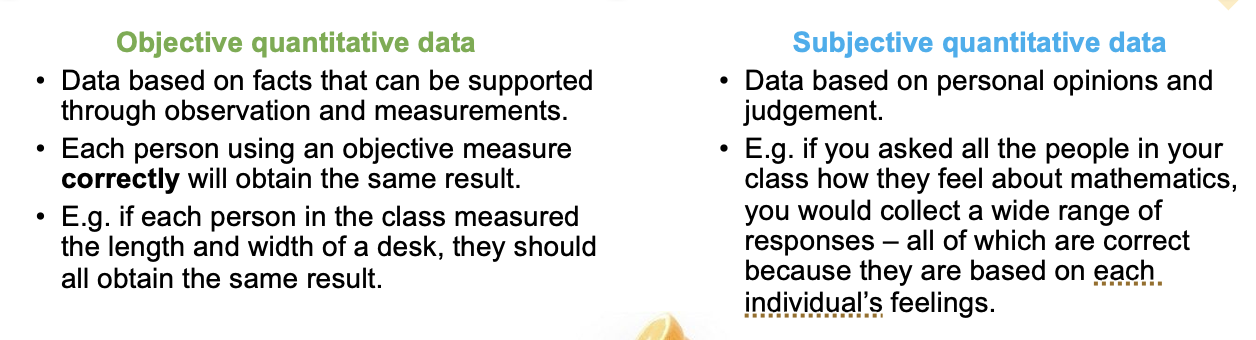
Two Types of Quantitative Data:
Objective v. Subjective