stats final
1/366
There's no tags or description
Looks like no tags are added yet.
Name | Mastery | Learn | Test | Matching | Spaced | Call with Kai |
|---|
No analytics yet
Send a link to your students to track their progress
367 Terms
Why should you always look at a graph to get shape information instead of just looking at summary numbers for shape?
Graphs contain a lot more detail about shape than summary numbers.
3 multiple choice options
How do you find frequency in a column of data values?
The number of times a value occurs in a column of data values.
3 multiple choice options
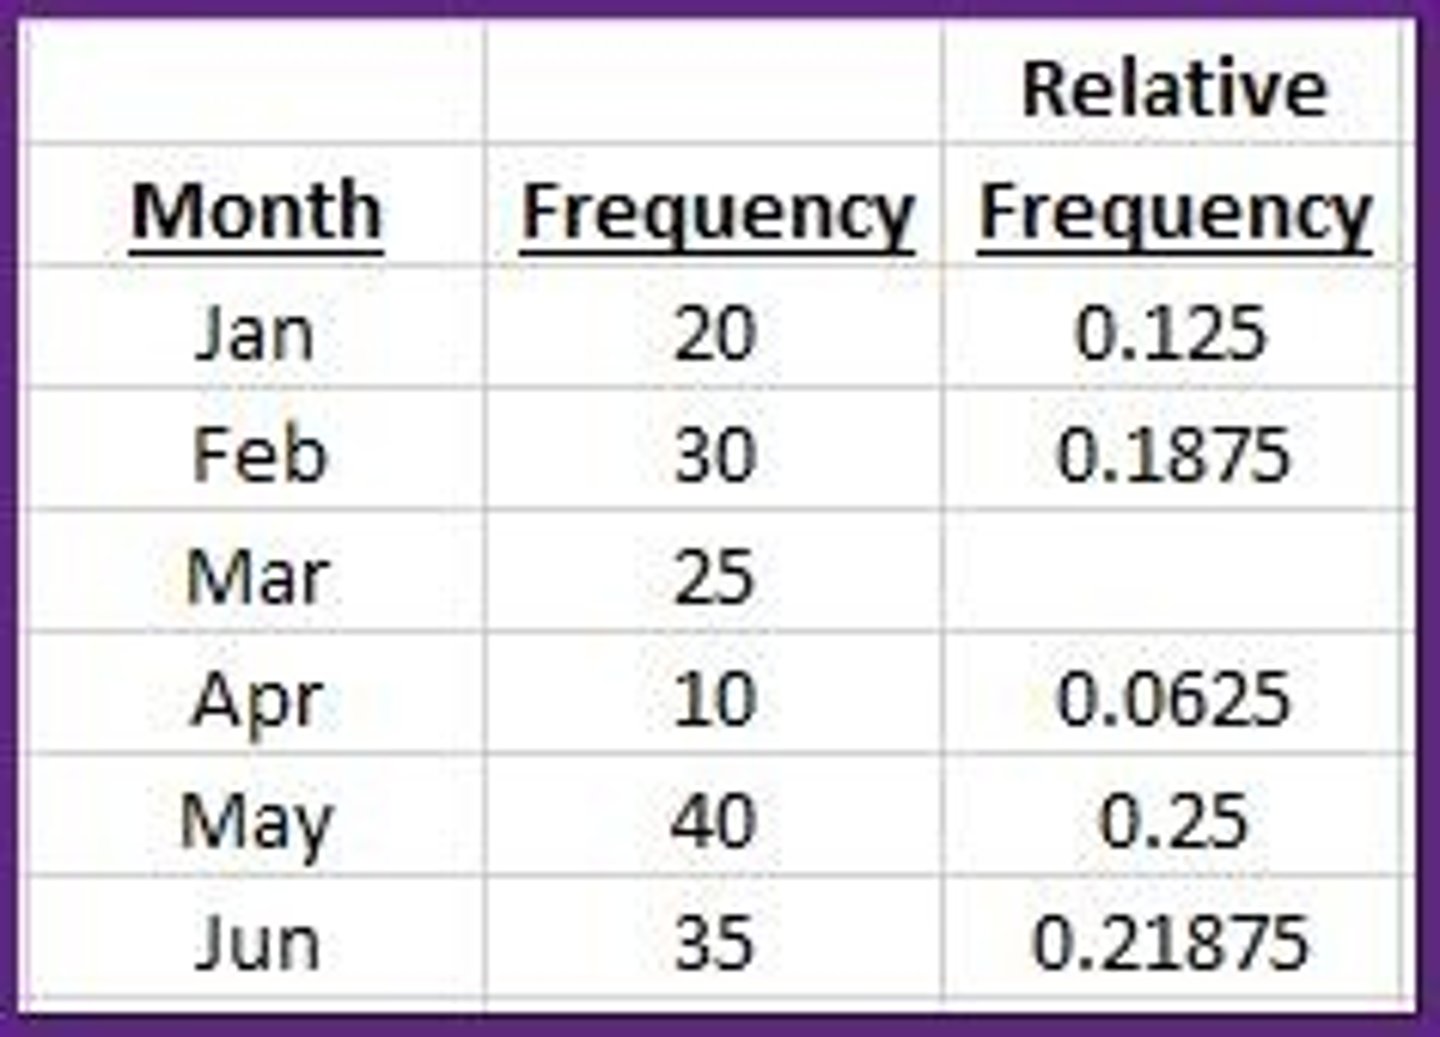
In the frequency table of 160 data values shown below, what is the relative frequency for the category Mar (March)?
0.1563
3 multiple choice options
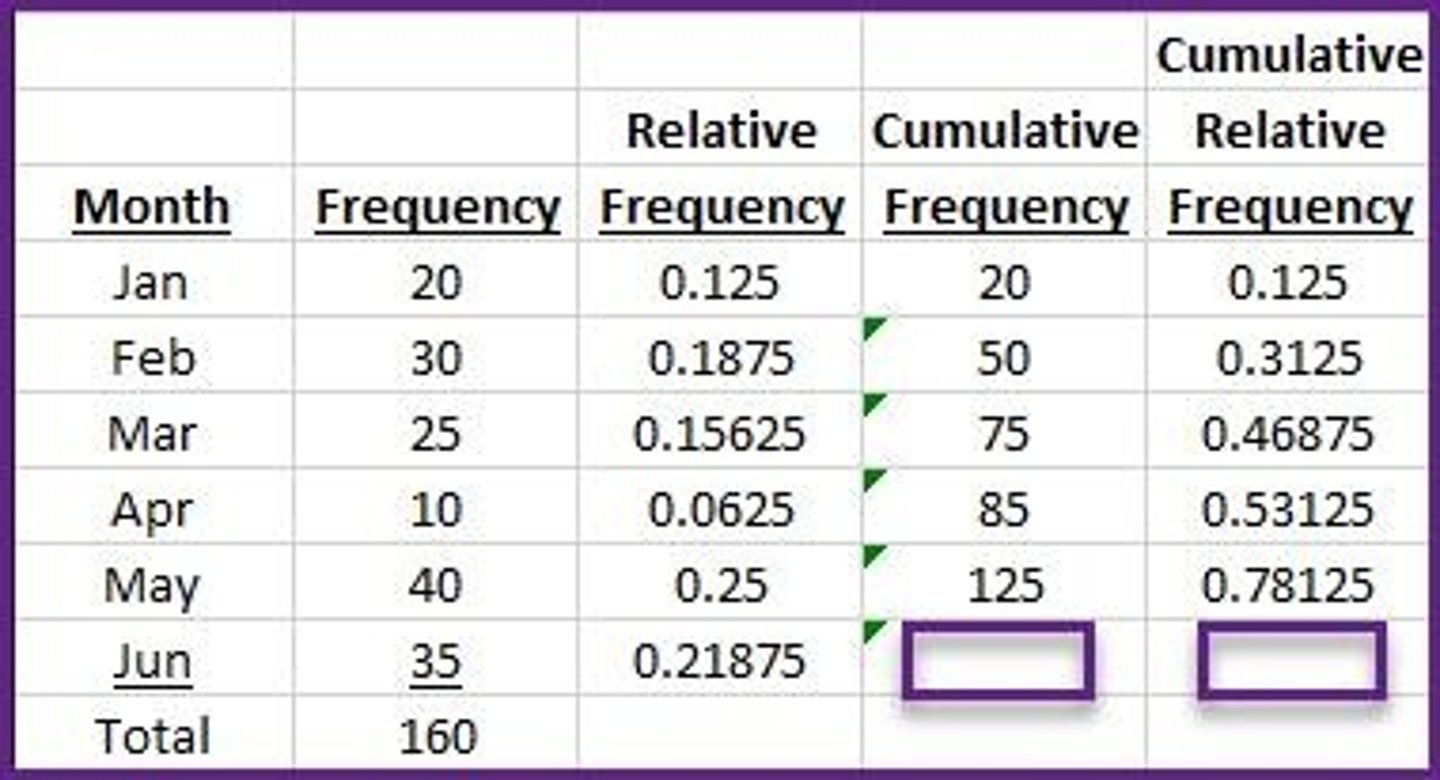
In the frequency table shown below, what are the cumulative frequency and the cumulative relative frequency for the category Jun?
160 and 1.0
3 multiple choice options
What two characteristics do you look at to analyze the shape of a column of data values?
Overall shape and expectation.
3 multiple choice options
What type of graph is most appropriate to display the shape of qualitative data?
A bar chart, where the bars do not touch each other.
3 multiple choice options
Can any, and all, bar charts be changed into a Pareto chart?
Yes, because the categories are not over a real-number-line and can be rearranged.
3 multiple choice options
What type of graph is most appropriate to display the shape of discrete data?
A histogram where the bars do touch each other.
3 multiple choice options
In a histogram for discrete data, what characteristic is plotted on the x-axis and on the y-axis?
The value of the data values, and the frequency of each data value.
3 multiple choice options
What is the major difference between a histogram for continuous data, and a histogram for discrete data?
The data values are grouped into bins.
3 multiple choice options
To use the data value shown below in a stem-and-leaf plot, what is the stem, what is the leaf?
Data Value = 37
The stem is 3, and the leaf is 7.
3 multiple choice options
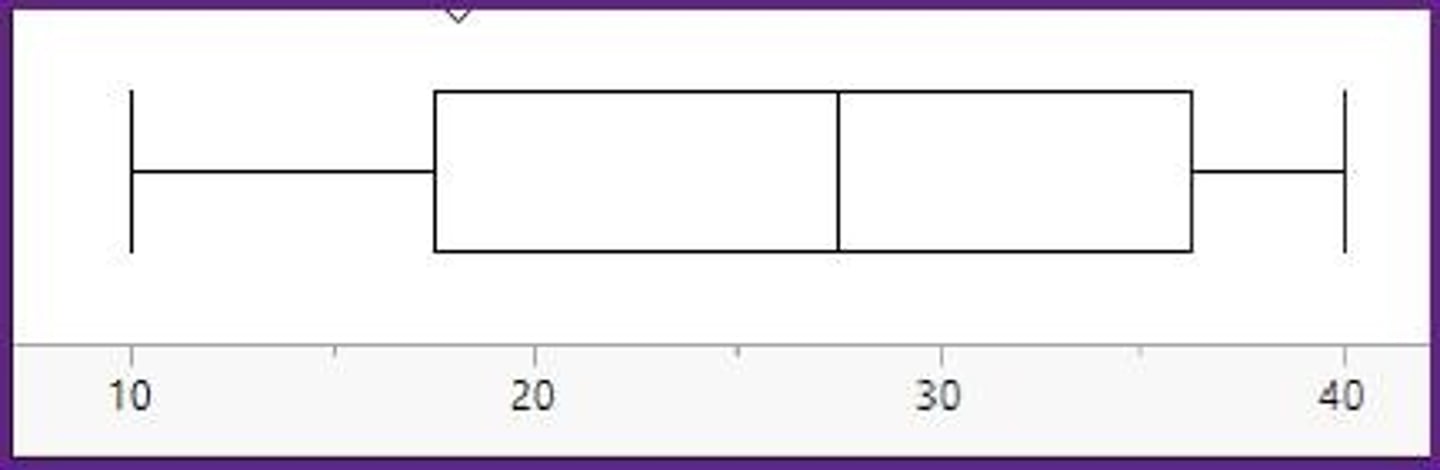
In the boxplot of continuous data shown below, what is the value of the first quartile, the median, and the third quartile?
17.5, 27.5, 37.5.
3 multiple choice options

Why is it important to LOOK at the shape of a column of data values BEFORE interpreting any statistics calculated from a column of data values?
To see that the shape of the data values meets the assumptions of the statistical method.
3 multiple choice options
What is the general strategy used to analyze the information in a histogram?
Step 1: Look at the overall shape. Step 2: Look for exceptions
3 multiple choice options
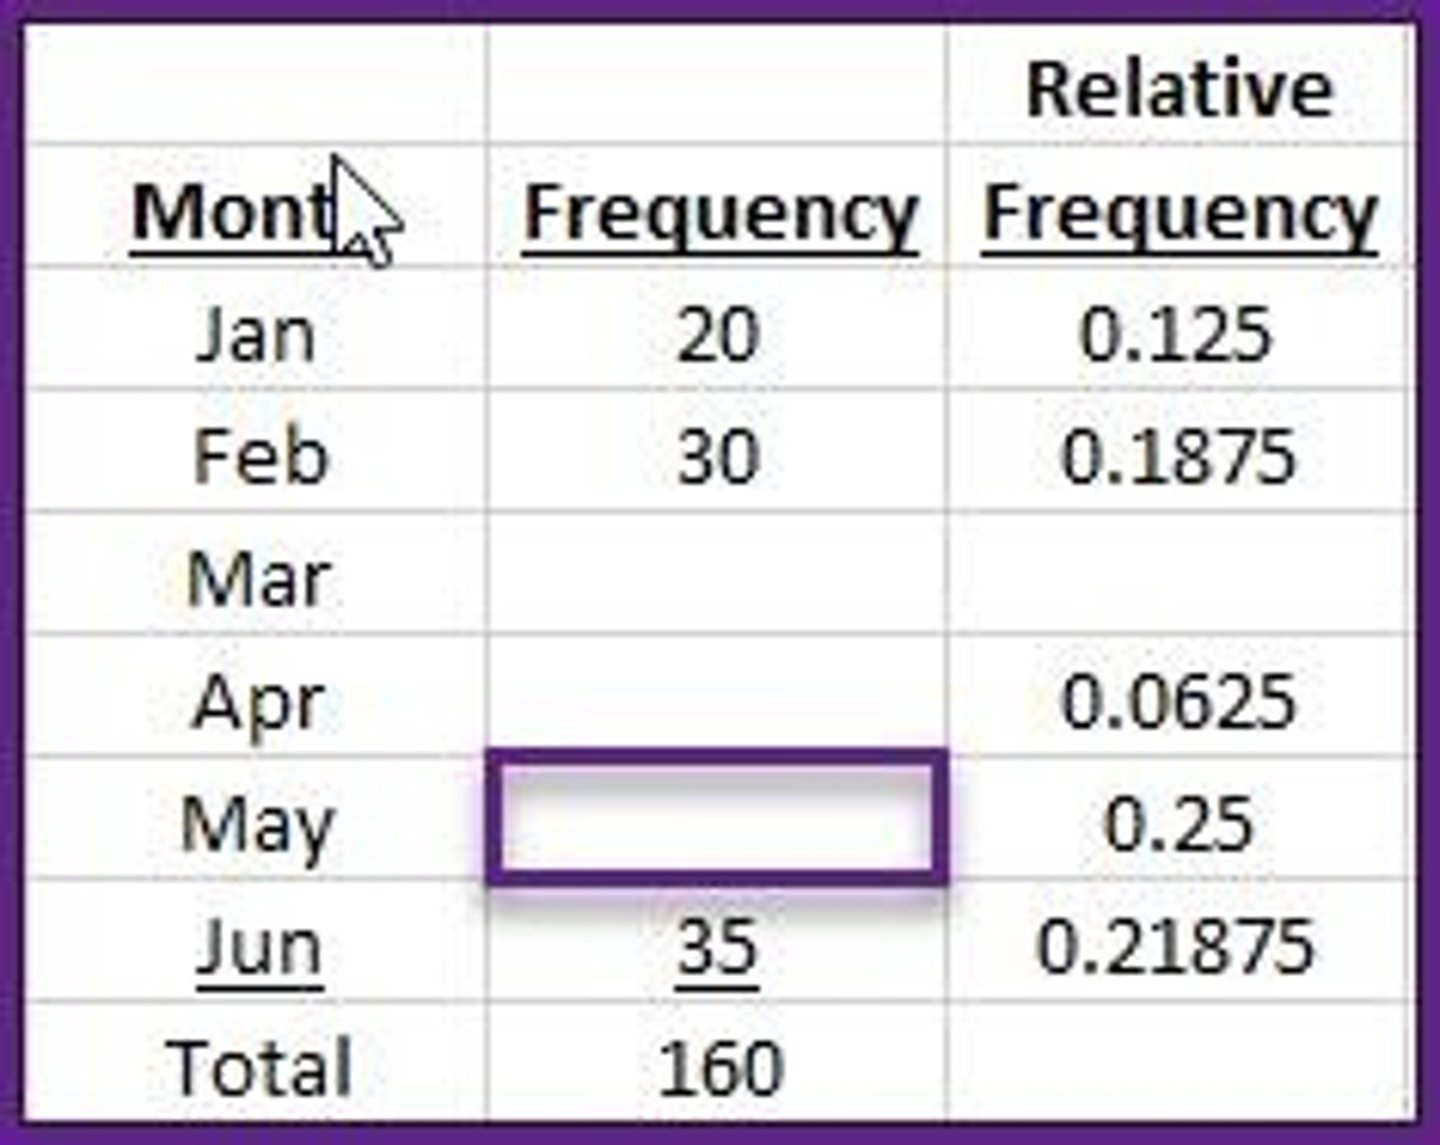
In the frequency table of 160 data values shown below, what is the frequency for the category May (May)?
40.
3 multiple choice options
Which of the choices below is NOT one of the overall shapes?
A modal shape.
3 multiple choice options
In a histogram for continuous data, what does a skewed-left shape mean?
A stretched out left tail.
3 multiple choice options
Skewness in a histogram is a property of what part of the histogram?
It is a property of the tails of the histogram.
3 multiple choice options
Which of the following answers is NOT an exception when analyzing a histogram?
The presence of any distance in the data values.
3 multiple choice options
In a histogram for continuous data, how is a gap exception distinguished from an extreme value exception in the histogram?
A gap fits into the overall shape, while an extreme value is outside the overall shape.
3 multiple choice options
What is the purpose for binning in a column of continuous data values?
To make a reasonable number of categories.
3 multiple choice options
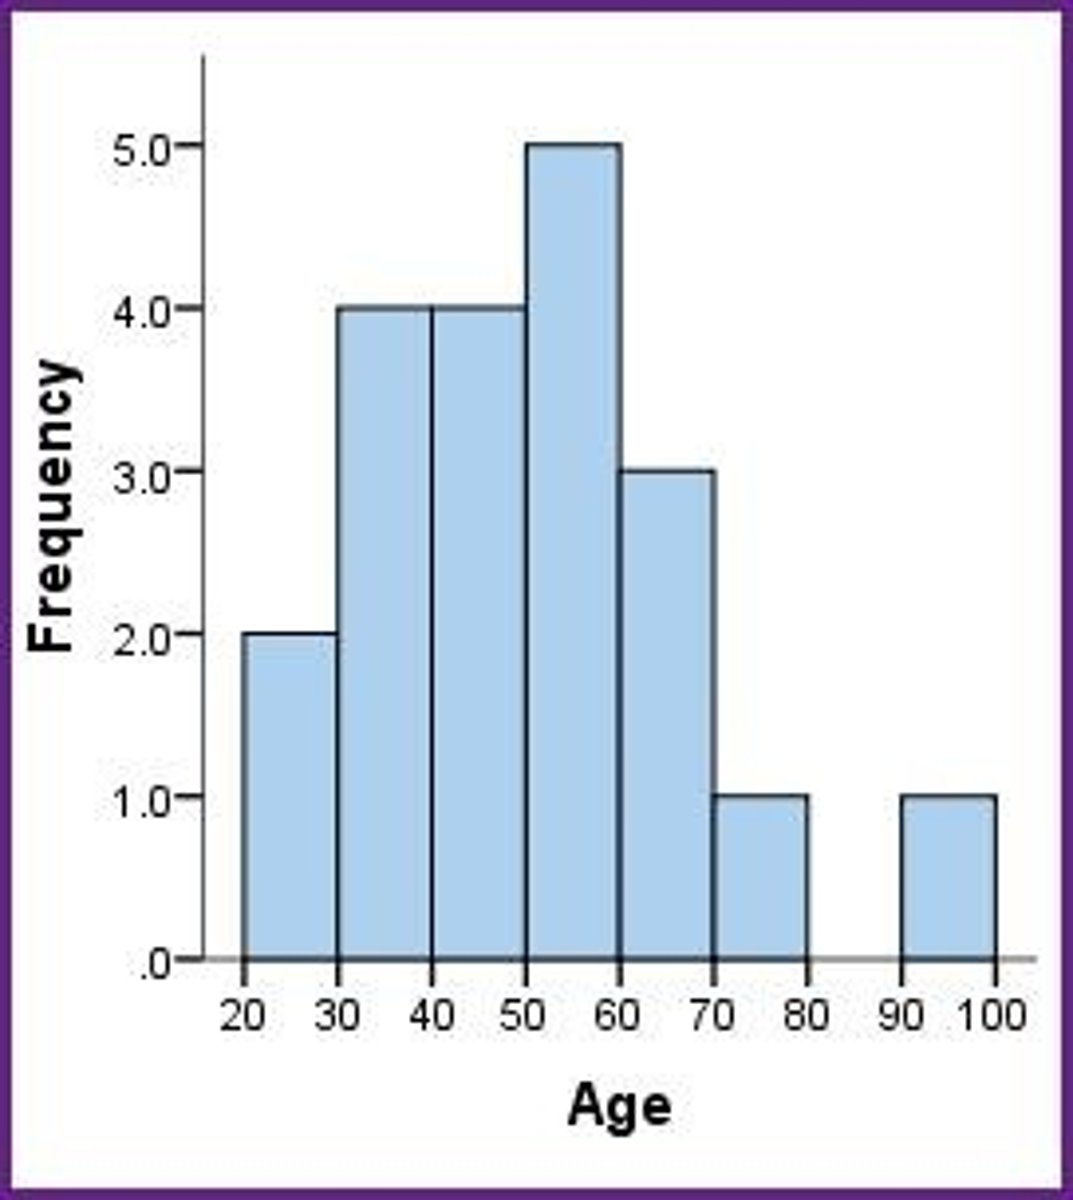
In the histogram shown below, what would be an appropriate analysis for this histogram?
A unimodal, symmetrical overall shape, with a gap to the right
3 multiple choice options
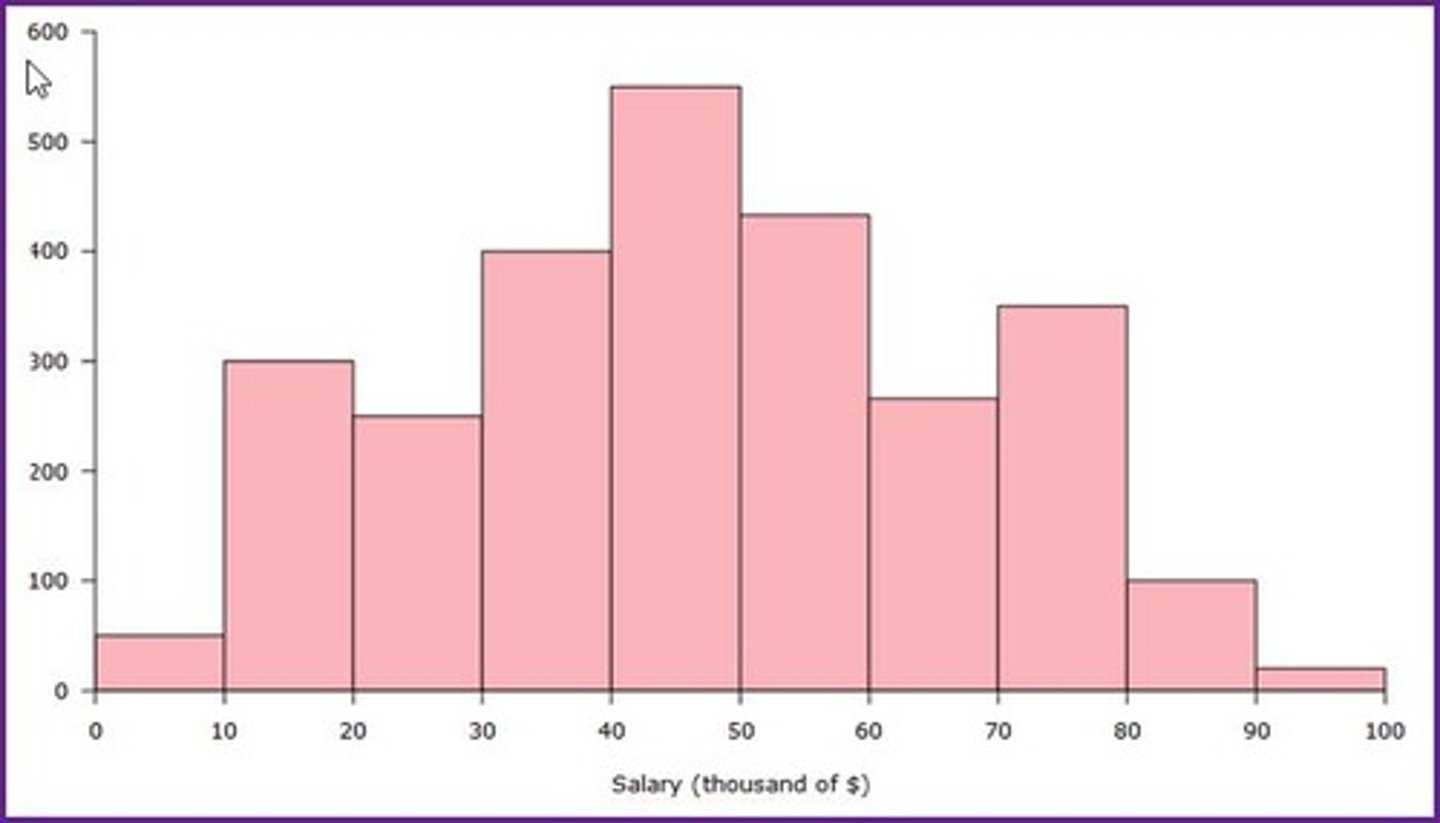
In the histogram shown below, what would be an appropriate analysis for this histogram?
A unimodal, symmetrical overall shape, with no exceptions.
3 multiple choice options
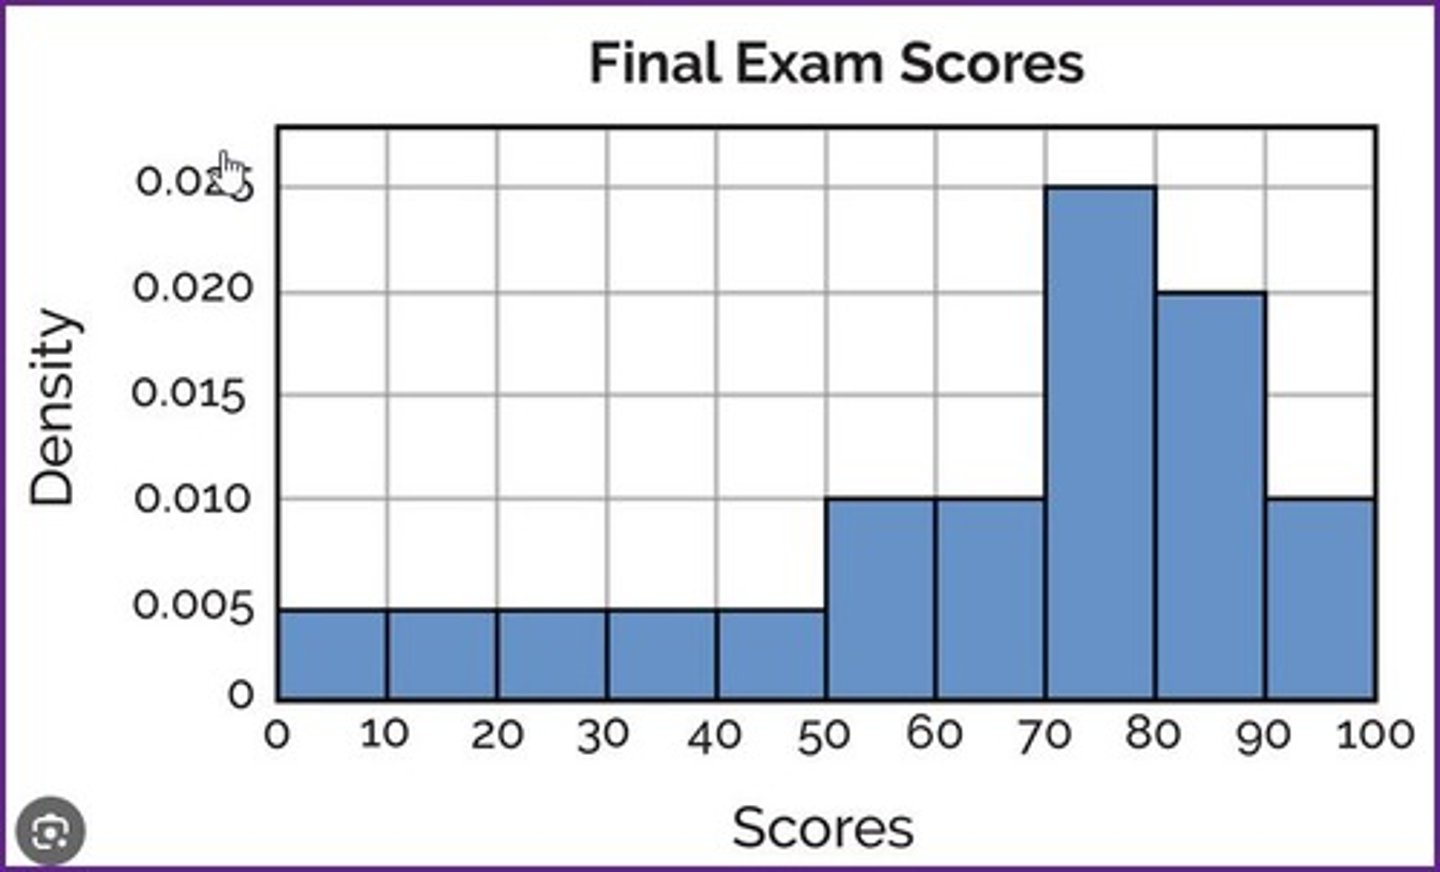
In the histogram shown below, what would be an appropriate analysis for this histogram?
A unimodal, skewed-left overall shape, with no exceptions.
3 multiple choice options
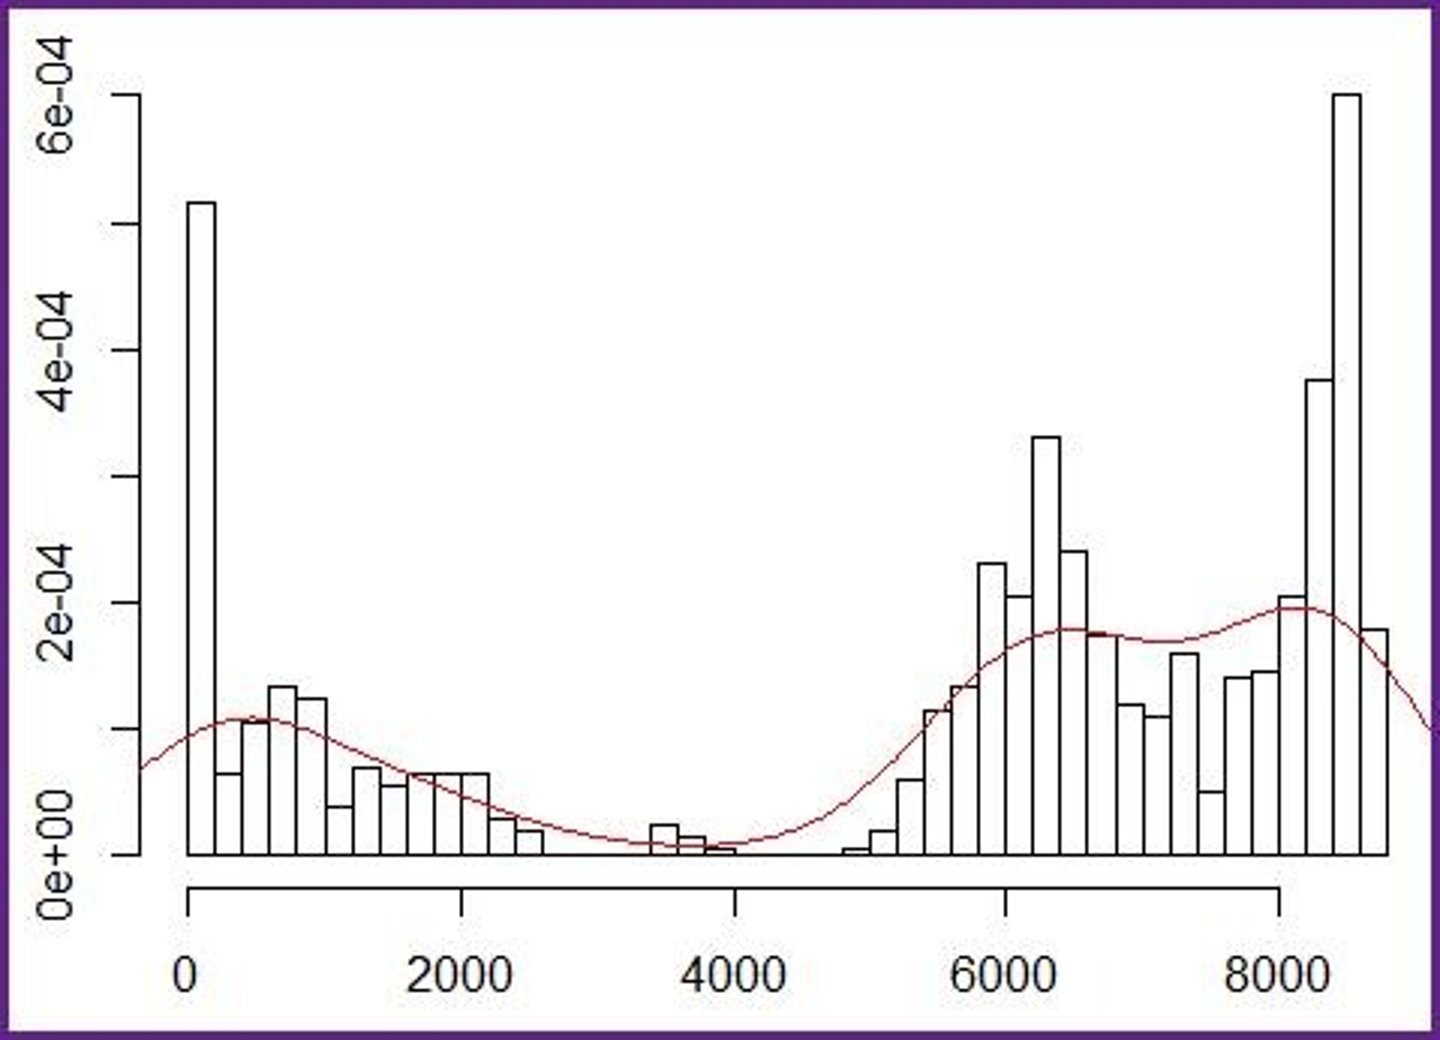
In the histogram shown below, what would be an appropriate analysis for this histogram?
An overall shape to be analyzed in this course.
3 multiple choice options
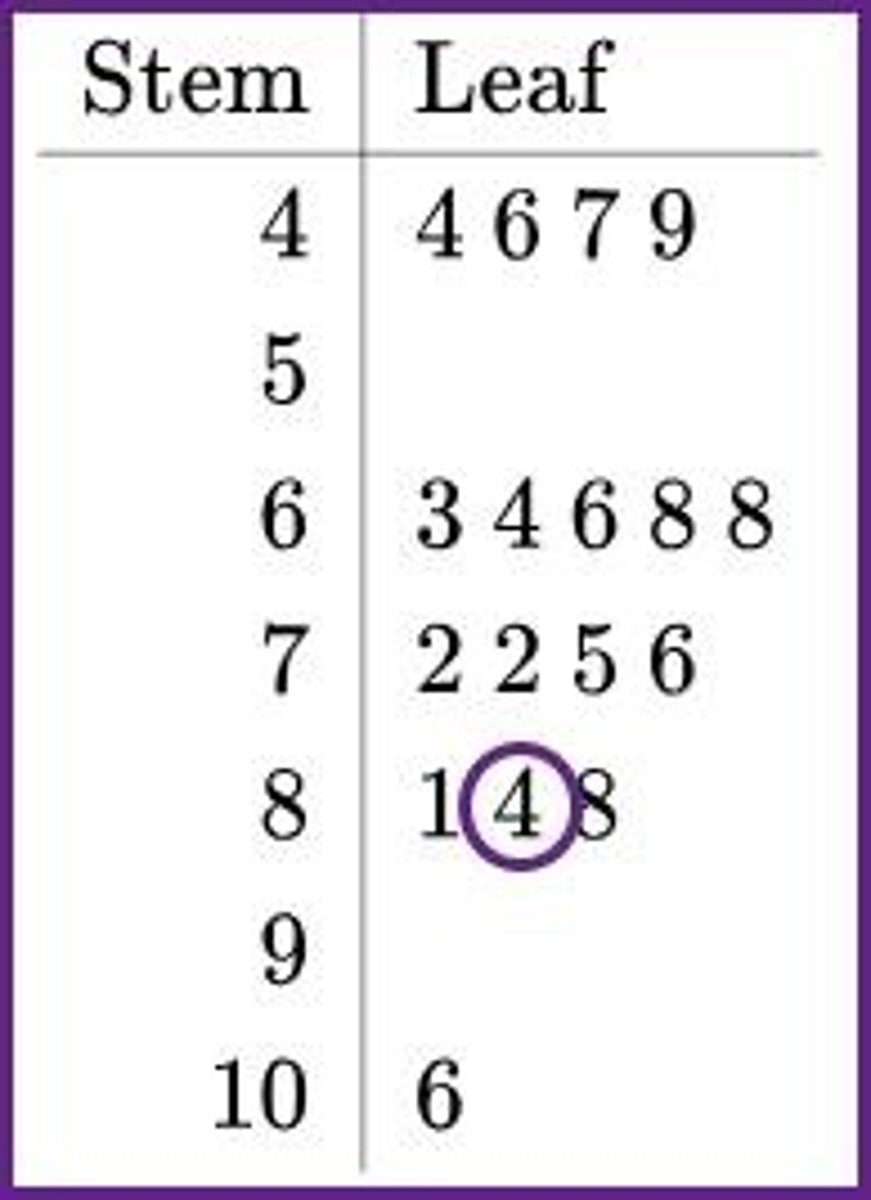
In the stem-and-leaf plot for the 17 data values shown below, what is the data value that gives the circled number four (4)?
84
3 multiple choice options
In the boxplots of continuous data values shown below, what percent of the data values lie inside each box, and what percent lie outside each box?
50%, and 50%.
3 multiple choice options
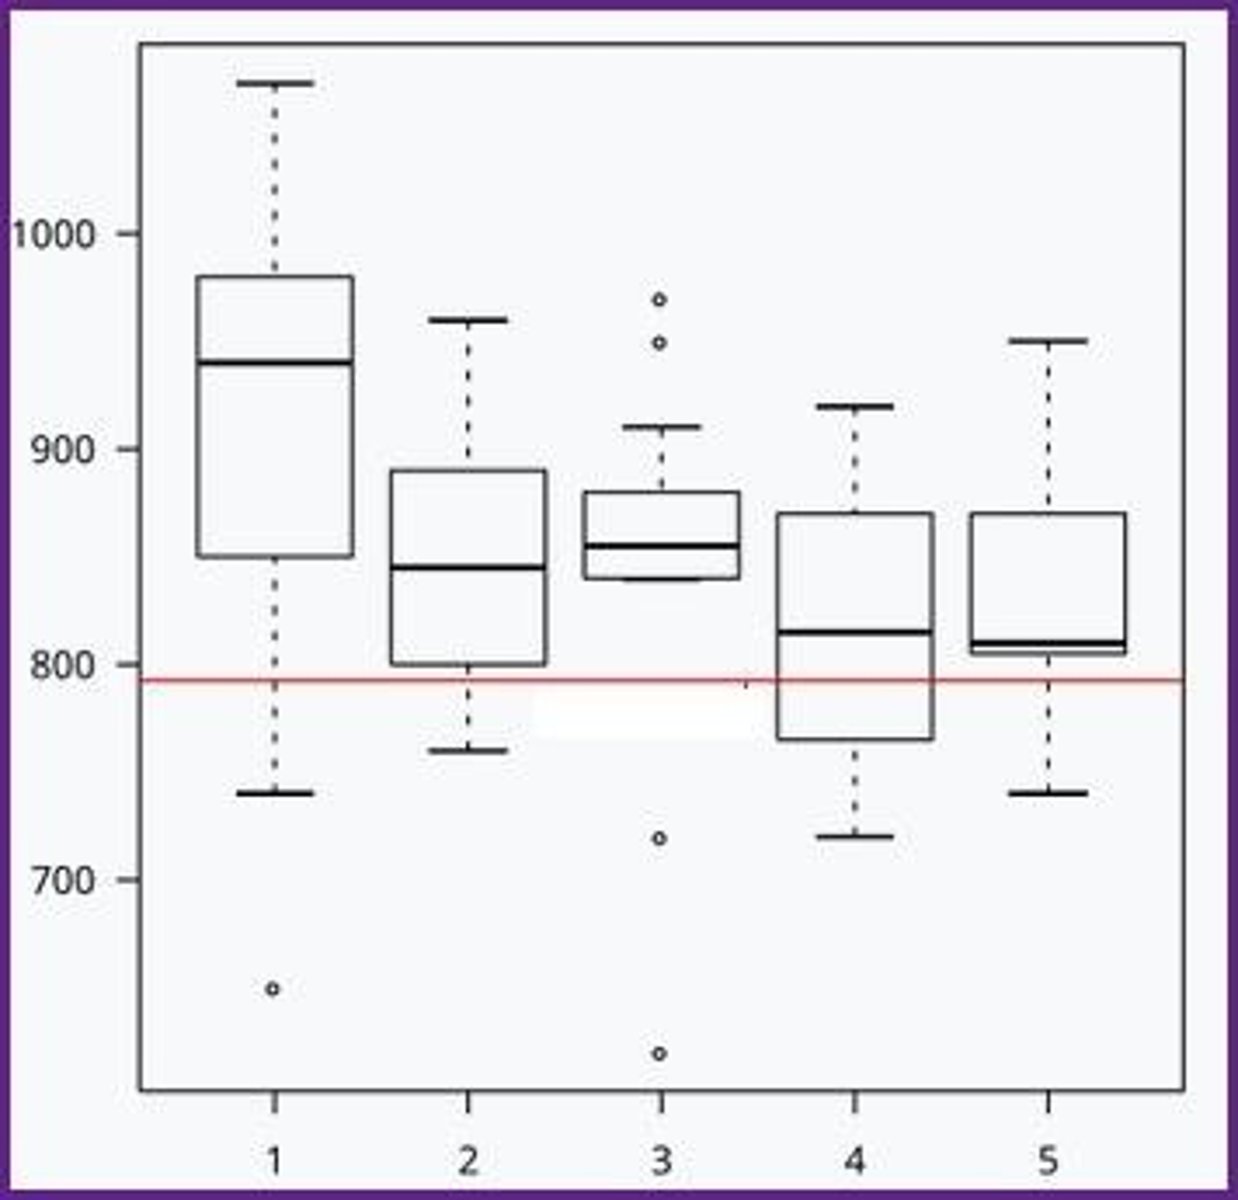
In the boxplot of continuous data shown below, what is the value of the mean, and the standard deviation?
Not able to determine from this information.
3 multiple choice options

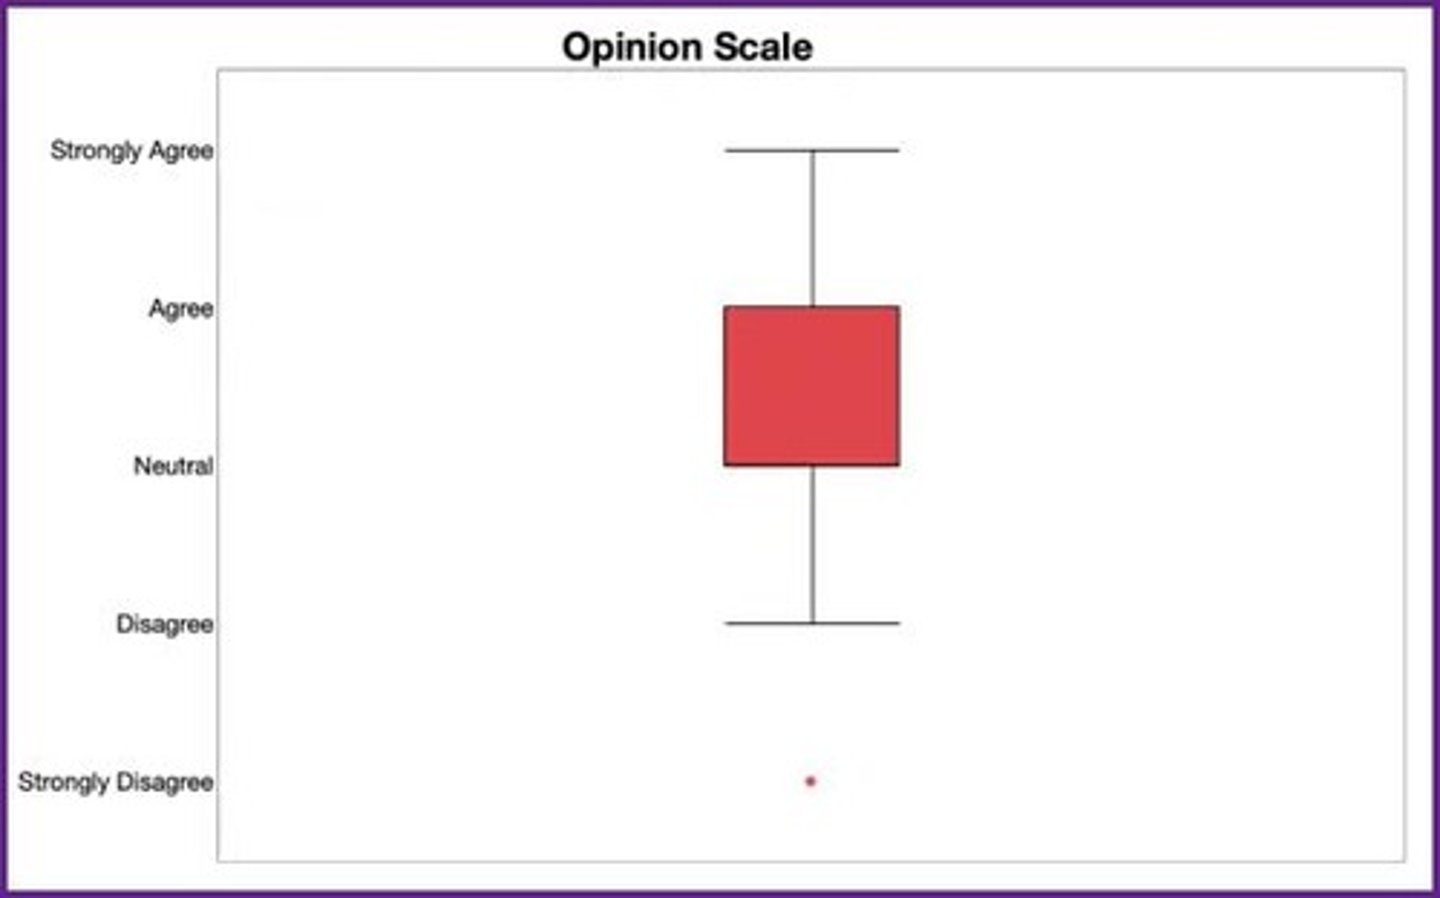
Is a boxplot an appropriate graph to display the shape of the data values in the situation shown below?
No, a bar chart is appropriate for qualitative data values.
3 multiple choice options
In any boxplot (an example is shown below), the width of the box shows what characteristic of the data values?
A resistant measure of the spread of the data values.
3 multiple choice options
Efficient statistics use what aspect of a column of data values in their calculations?
The values of the data values.
3 multiple choice options
Is the sample average a statistical mean?
Yes, it is the statistical mean of a column of sample data values.
3 multiple choice options
Why is the value of the mean often thought of when considering the information in a column of data values?
Because the mean is a single number that best represents all the values in a column of data values.
3 multiple choice options
To calculate the sample average, the data values must first be ranked lowest to highest?
False, as the values in a sum can be in any order.
3 multiple choice options
What is the value of the sample average for the following six data values?
9 -1 3 8 0 2
3.50
3 multiple choice options
What is the value of the sample average for the following ten data values?
3 4 8 2 -8 2 -10 8 6 -4
1.10
3 multiple choice options
What is the importance of the deviation of a data value in the science of statistics?
It is the basic measure of the spread in a data value.
3 multiple choice options
What is the sum of the deviations for the following five data values?
9 -1 4 6 2
0
3 multiple choice options
What is the importance of the sum-of-squares of a column of data values in the science of statistics?
It is a raw measure of spread in a column of data values.
3 multiple choice options
What is the sum of the squared deviations for the following five data values? This statistic is called the sum-of-squares.
9 -1 4 6 2
58
3 multiple choice options
What is the importance of the variance of a column of data values in the science of statistics?
It is a standardized measure of spread that is comparable to other columns of data values.
3 multiple choice options
What is the variance for the following five data values?
9 -1 4 6 2
14.5
3 multiple choice options
What is the importance of the standard deviation of a column of data values in the science of statistics?
It is a standardized measure of spread in the same units of measurement as the mean.
3 multiple choice options
What is the standard deviation for the following five data values?
9 -1 4 6 2
3.81
3 multiple choice options
What is the standard deviation for a column of 6 data values that have the variance shown below?
Apple²
Apple
3 multiple choice options
Why are efficient statistics sensitive to extreme values?
They use the data values in their mathematical calculations.
3 multiple choice options
Choose which is the correct equation to calculate the sample average?
x̄=∑(x)
/n
3 multiple choice options
What characteristic of a column of data values does the mean measure?
Location.
3 multiple choice options
When is the mean the better measure of location?
When the column of data values is unimodal, symmetrical and no extreme values.
3 multiple choice options
What statistical information does the deviation give about a data value?
It's mathematical distance and direction from the mean.
3 multiple choice options
Which of the following choices is NOT true for a deviation?
A deviation can never equal zero.
3 multiple choice options
What spread is deviation measuring in a column of data values?
For one data value only.
3 multiple choice options
What is the size of the deviation for a data value close to the mean?
A small deviation.
3 multiple choice options
What type of deviation does a data value less than the mean have?
A negative deviation.
3 multiple choice options
Why does the sum of the deviations always equal zero?
The positive and negative deviation cancel each other.
3 multiple choice options
What is the proper statistical term for all the deviations, squared and added together?
The sum-of-squares.
3 multiple choice options
What type of measure of spread is the sum-of-squares?
A raw measure of spread.
3 multiple choice options
What is the correct equation to calculate the sum of squares?
SOS = ∑(x−¯x)²
3 multiple choice options
Two columns of data values have the same size, but the sum-of-squares for Column A is 97, and for Column B is 197. In which column are the data values more widely spread?
Column B, because SOS = 197 indicates a wider spread than SOS = 97.
3 multiple choice options
Why does the sum-of-squares usually get bigger as more data values are added to the column of data values?
There are more values in the sum.
3 multiple choice options
What is the sum-of-squares for the data set below?
2 -1 3 1 0
10
3 multiple choice options
What is the sum-of-squares for the data set below?
7 3 -5 0 5
88
3 multiple choice options
What is the sum-of-squares for the data set below?
-6 9 1 7 4
138
3 multiple choice options
How is the sum of squares standardized into a variance?
Dividing by the degrees of freedom.
3 multiple choice options
To calculate the variance of a column of data values, does the science of statistics use an average of the deviations?
No, it uses an approximate average of the squared deviations.
3 multiple choice options
What type of measure of spread is the variance?
A standardized spread by the degrees of freedom.
3 multiple choice options
What is the appropriate statistical symbol for variance?
Population = σ²; Sample = s².
3 multiple choice options
What is the sample variance for a column of 19 data values that has a sum of squares of 36?
s² = 2.00.
3 multiple choice options
What is the sample variance for a column of 26 data values that has a sum of squares of 150?
s² = 6.00.
3 multiple choice options
What is the sample variance for the following column of data values?
-9 -8 -8 -4 -1
s² = 11.5.
3 multiple choice options
What is the sample variance for the following column of data values?
1 4 8 8 9
s² = 11.5.
3 multiple choice options
What is the sample variance for the following column of data values?
101 104 108 108 109
s² = 11.5.
3 multiple choice options
What is the sample variance for the following column of data values?
10 40 80 80 90
s² = 1,150.
3 multiple choice options
What is the efficient measure of spread for a column of data values?
The standard deviation.
3 multiple choice options
What is the sample variance for the following column of data values?
1 1 1 1 1
s² = 0.00.
3 multiple choice options
What is the sample variance for the following column of data values?
7 -2 -2 -1 9
s² = 31.00.
3 multiple choice options
What is the sample variance for the following column of data values?
-10 6 5 9 -5
σ² = 65.50.
3 multiple choice options
What is the appropriate statistical symbol for standard deviation?
For population σ; for sample s.
3 multiple choice options
What does a larger standard deviation mean for a column of data values?
The data values are spread wider apart.
3 multiple choice options
Which one of the following choices is the correct way to calculate a sample standard deviation from a sample variance?
s=√var.
3 multiple choice options
Is the average deviation better than the standard deviation?
No, because the average deviation always equals zero.
3 multiple choice options
Does the value of the standard deviation need to be known to find probability with the normal distribution?
Yes, because it defines which normal curve to use.
3 multiple choice options
What is the standard deviation for a column of 26 data values that have the following variance?
125
s = 11.18.
3 multiple choice options
What is the sample standard deviation for the following column of data values?
1 2 3
s = 1.00.
3 multiple choice options
What is the sample standard deviation for the following column of data values?
10 15 20
s = 5.0.
3 multiple choice options
What is the sample standard deviation for the following column of data values?
15 15 15—-
s = 0.00.
3 multiple choice options
How many normal distributions are possible?
Infinitely many, one for each value of the mean and standard deviation.
3 multiple choice options
Is the area over an event, and under any normal curve, the same when the event is expressed in terms of the mean and standard deviation of the normal curve?
True, as given by the Empirical Rule of statistics.
3 multiple choice options
Can an event in any normal distribution be converted into an event for the Standard Normal distribution?
Yes, by using the z-Equation.
3 multiple choice options
Which of the following choices is true about x-values?
x-Values have the units of measurement of the situation.
3 multiple choice options
Are the two equations below the same, with one equation being a rearrangement of the other?
z=x−μ/σ : x=μ+z∗σ
Yes, both equations are the same, just different forms.
3 multiple choice options
Which tool is used to find the probability of an event in any normal distribution?
All the other choices.
3 multiple choice options
In a factory packaging potato chips, the weight of potato chips put into each bag was distributed normally with a mean weight of 48.5 ounces and a standard deviation weight of 0.2 ounces. What is the percent of buying a bag of potato chips that weighs more than 48.5 ounces?
Percent = 50%.
3 multiple choice options
In a factory packaging potato chips, the weight of potato chips put into each bag was distributed normally with a mean weight of 48.5 ounces and a standard deviation weight of 0.2 ounces. What is the probability of buying a bag of potato chips that weighs less than 48.0 ounces?
Probability = 0.0062.
3 multiple choice options
In a factory packaging corn chips, the weight of corn chips put into each bag was distributed normally with a mean weight of 48.5 ounces and a standard deviation weight of 0.2 ounces. What weight of corn chips separates the lightest 67% from the heaviest 33%?
Weight = 48.59 ounces.
3 multiple choice options
In a factory packaging corn chips, the weight of corn chips put into each bag was distributed normally with a mean weight of 48.5 ounces and a standard deviation weight of 0.2 ounces. What weight of corn chips is the value of the first quartile ((Q1)?
Weight = 48.37 ounces.
3 multiple choice options
The ACT college entrance test has a maximum score of 36. Last year, the scores of students taking the ACT test were found to be distributed normally with a mean of 18.6 and a standard deviation of 5.17. What is the chance that a randomly chosen student from this population would have qualified for a TOPS Honor Scholarship (ACT score of 27 or greater)?
Chance = 5.26%.
3 multiple choice options
The ACT college entrance test has a maximum score of 36. Last year, the scores of students taking the ACT test were found to be distributed normally with a mean of 18.6 and a standard deviation of 5.17. What is the probability that a randomly chosen student from this population would not have been accepted at Tulane University (31 ≤ ACT score)?
Probability = 0.9918.
3 multiple choice options
The ACT college entrance test has a maximum score of 36. Last year, the scores of students taking the ACT test were found to be distributed normally with a mean of 18.6 and a standard deviation of 5.17. What are the min / max scores of the middle 80% of these students?
Scores = 11.98 / 25.21.
3 multiple choice options
The ACT college entrance test has a maximum score of 36. Last year, the scores of students taking the ACT test were found to be distributed normally with a mean of 18.6 and a standard deviation of 5.17. What is the value of the median for these students?
Score = 18.60.
3 multiple choice options