7B week 8-10
1/204
There's no tags or description
Looks like no tags are added yet.
Name | Mastery | Learn | Test | Matching | Spaced | Call with Kai |
|---|
No analytics yet
Send a link to your students to track their progress
205 Terms
The carbon cycle
biological process that shuttles carbon among rocks, soil, oceans, air and organisms
-includes long term and short term carbon cycle
keeling curve
-pattern fo co2 concentration inthe atmosphere from 1950’s onward
patterns observed
spring; co2 reaches a high point
fall; declines about 6ppm
summer; when removal of co2 occurs, probably about 6ppm
winter; slow build up of co2
the removal of co2 does not balance the increase
-over every year there is an increase in overall co2
short term carbon cycle
-determined by photosynthess and respiration
photosynthesis uses sunlight to reduce co2 to carbs while oxidizing water to o2 while respiration runs the same reaction in reverse,forming the cycle
explain the seasonal differences of co2 concentration (why is this trend northern hemisphere dominant?)
there are more plants and lands in the northern hemisphere than the southern hemisphere
In areas of the world all excluding the equator (that does not expeirence eseasonal differences) the different activit yof respiration is what is repsonsible for the co2 oscillations
-in the summer there is high photsynthesis and inthe winter htee is low photosynthesis
global co2 declines through the northern summer (when rates of photosynthesis are highest relative to respiration) and then increase through fall and winter (respiration dominantes)
what explains the gradual increase iin co2 concentration over the years?
pieces of evidence that hint that the yearly increase is due to human acitviity
-human activity, atmospheric co2 inputs and outputs were approximately in balance until the industrial revolution
Suess’s measurements of the atmosphere; isotopic composition of atmospheric co2; the only isotope ratio contained int he organic matter of organism (fossil fuels when burned) matches the shift in carbon isotope ratios
past history using ice bubbles in glaciers that trap relative amounts of co2 in each time point; shows that co2 levels began to increase only starting from the 1800’s
not all co2 released by human activity is released in the air; where does it go?
-missing cabronhas been stored as inorganic carbon int he form of bicarnonate, carbonate ions dissolved in the oceans
-taken up by vegetation and soils
Long term carbon cycle
before human activity, what explained the oscilation of co2 levels from 285 to 180 ppm in parallel with flacial expansion and retreat
the proposed mechanisms commonly suggest interactions involving the ocean’s capacity to store large amounts of inorganic carbon, especially during glacial times.
Resevoirs (long term carbon cycle)
places where carbon is stored on the earth; organisms, the atmosphere, soil, the oceans, and sedimentary rocks. Both biological and geologic processes cycle carbon back and forth among these reservoirs.
main forms of carbon in 1. soil,2.ocean 3. sediment and sedimentary rock
1.soil; slowly decaying organic compounds
inorganic carbon dissolved in water
calcium carbonate minerals (limestone), organic matter preserved indefimentary rocks (SEDMENT AND SEDIMENTARY ROCK IS THE LARGEST RESEVIOR)
fluxes
the rate at which carbon flows from one resevior to another;descibes methods of storage and release between resevoirs
how is co2 in the long term carbon cycle released
how is it stored back in
what is the process that connects the release and sotrage processes together?
release
oxidation of coal, oil and ancient organic matter from the sediment
volcanic activity
storage
chemical weathering
organic burial on land
sefimentation of organic shells and skeletions
burial of organic matter
connection process
subduction (plate tectonic activity) , sedimentary carbont hat has been buired can return to the mantle through which one plate sinks beneath another and rises up
climate (general def)
the long term average weather over an area
how is climate determined
solar radiation-direct temp
global patterns of wind and ocean circulation-distirbution of direct heat across globe
earths topography- climate changes within each area due to differences in elevation
what determines the surface temperature of a patch of earth
-the angle at which solar radiation stickes the surface (detemrined through the spherical shape of the earth that creates natural angular differences)
-equator experiences harsher solar radiation as the beam is more direct (less surface area), in contrast to poles, where the curvature of the earth is more, thus the solar radiaiton can spread out more
what explains seasons
-the tilt of the earth 23.5, and its axis around the sun
topography
the physical features of Earth’s surface
— also contributes to global temperature patterns. Even at low latitudes, mountaintops can have glaciers, reflecting the fact that temperature declines with increasing elevation
Hadley cells
Large-scale atmospheric circulation cells where hot air rises at the equator, flows toward the poles, sinks at around $30^\circ$ latitude (North and South), and flows back toward the equator.
Context/Impact: * Equator (0degrees): Rising air cools and drops intense rain, creating tropical rainforests (high biodiversity).
Deserts (30 degrees): Sinking air is dry and warm, creating major desert biomes.
Drives the baseline distribution of terrestrial biodiversity by establishing global precipitation zones.
what are the prevailing winds, and why does it occur (wind patterns)
-wind patterns (the direction of westerlies, easterilies, trade winds) are deifned by the rrotation of the earth around its axis
the equator moves slower than the poles
Surface winds that blow consistently in a specific direction over a particular region of Earth, driven by the combination of Hadley cells and the Coriolis effect.
Key Examples: * Trade Winds: Blow from East to West toward the equator (between 0 and 30).
Westerlies: Blow from West to East in the mid-latitudes (between 30 and 60).
Context/Impact: They distribute moisture and heat across the planet, directly influencing regional climates, weather patterns, and the distribution of biomes.
coriolis effect
Back: * Definition: The apparent deflection of moving air (and water) caused by the rotation of the Earth.
Direction of Deflection: * Northern Hemisphere: Deflects movement to the right.
Southern Hemisphere: Deflects movement to the left.
Context/Impact: Prevents air from moving in a straight North-South line within Hadley cells. Instead, it curves the moving air, breaking global circulation into distinct wind belts.
heat pattern observed in water
At high latitudes, surface ocean waters cool enough to sink beneath warmer, less dense ocean waters, with the colder waters sinking to the deep ocean where they begin to move slowly toward the equator.
circulation of winds and rainfall
-warm air carries more h2o, when cooled, h2o is released as precipitation
-rain fall occurs in the process of air becoming warm to cool

water fall does not occur at places where air becomes cool to warm (this takes up moisture from the surroundings, leading to airditiy)
rain shadow and relationship to climate precipitation
mountains impose a regional pattern of rainfall
as wet air moves from the ocean up into the mountains, it cools, releasing its moisture as precipitation.
Moving past the mountains, air masses descend, warming as they go and taking up water vapor.(For this reason, lands in the rain shadow of the mountains are arid)

population
all the individuals of a given species that live and reproduce in a particular place, must be in the same geographical place ( same species in different islands would not compose a population)
population size
the is the number of individuals of all ages of a certain species alive at a particular time in a particular place.
geographic range of a population
the area over which that population is spread
-reflects the range of climates a population can tolerate and how many other species the population encounters
range and size of a population determines what
population density. pop size/range
how can raw counts of pop density be misleading
-depends on how organisms are distributed
-if you wanted to use it accurately, the only distribution that would be useful would be random distribution
random, clumped and unifrom distribution
random; a new individual has an equal chance of occupying any position within the range, and the location of one individual has no influence on where the next individual will be found.
clumped: , resources are distributed patchily within the range, or the chances of a new individual’s survival are enhanced by the presence of other individual
unifrom: n occurs when one individual of a population prevents another from settling nearby, such as when all individuals depend on the same set of limited resources.
how to esstimate population size
using population density, you estinate the popiulation siz for the actual total area of the habitat
mark and recapture (equation?)
-way to take samples and esimate population size for mobile organisms
A method in which individuals are captured, marked in a way that doesn’t affect their function or behavior, and then released. The percentage of marked individuals recaptured later enables ecologists to estimate population size.
-assumption; no immigration or emigration, the population size remains the same size between first and second sample
eqution:
To determine the population size (N), the total number of marked butterflies and unmarked butterflies caught on the second day (C) is divided by the number of recaptures (R). This number is then multiplied by the number of butterflies marked on the first day (M), as follows:
N= (C/R)xM
delta N equation with counts of brith, death, immigrants and emigrants
delta N= (Birth-death) + (Immigration -emigration)
per capita growth rate (what does it mean when its neg and positive)
symbolizied by ( r)
-the change in population size delta N in a griven period of time t divided bt the stize of thepopulation N
(dN/dt)/N = r
the average number of offspring per individual
(+)= the pop increaes in size
(-)= the popoulation decreaes
0= the popuaiton size does not change
most population models and equations assume that and account for only..
-assume that the population is isolated with no immigration into or emigration out of the population
-only focus on birth and death
continuous growth
-defined by non sybchrnozized lifec cyles between generations
organisms develop at different times and reproduce at different times, there can be organisms form the previous generation still reproducing with the organisms from the new generation
defines logistic and exponential populaiton growth models
exponential growth (commonly seen in what organisms)
Exponential growth occurs when the growth rate is constant, meaning the population grows in proportion to the number of individuals.
continuous growth
no carrying capacity
j shape
delat N/delta t= rmax N
organisms
seen in small population when resoources are abundant
no environmental factors that limit population growth
what is r in population growth model equations
the per capita growth raate at an instant of time (in comparison to average)
-called the instrinsic rate ofincrease
instrinsic rate of increase
The per capita growth rate; the maximum rate of growth when no environmental factors limit population increase.
what is rmax in population growth models
rmax; the instant rate of increase when there are no environmental faqctors that limit population growth
how can we caluclate population size (N) at any time t for exponential growth model
Nt=N0e^rt
what happens as the rate of growth slows
the death rate increases to equal to birth rate
carrying capacity (k)
what factors can change K
what factors can KEEP a population from reaching k
the maximum number of idnivduals that habitat can sustain indefintiely without environmental deterioation,
factors that can change k
limited by the availability of the environmental resources (not predation etc, just resources) that are available to support these needs
anything that changes available resources or usable habitat changes K. (density dependent and independent)
factors that can prevent a population from reaching k
Density-dependent (get stronger as population grows):
Predation
Disease / parasites
Intraspecific competition (competing with own species for food/mates)
Accumulation of waste/toxins
Density-independent (hit regardless of population size):
Sudden storms, frost, or floods killing individuals
Habitat disturbance
Human hunting/harvesting
logistic growth (equation for slope)
-s shaped curve
-even though the population does not always have rmax as growth rate like pure exponential growth, use rmax since this value is already limited by k-n./n
-where a population grows at rmax (and exponentially) until reaching K, where it levels off and rmax decreases (rmax value is limited by k-n/n)
dn/dt= rmax ((K-N)/K)N or deltan/deltat= rmax(1-n/k)n
density dependent factors
Describes processes affecting populations that are influenced by the number of individual organisms, such as the use of resources or susceptibility to predation or parasitism.
-affects population growth rate
-shoes a smooth continous decrease in population size
density independent factors
Describes factors such as severe drought that influence population size without regard for the density of the population.
-can still affect population growth rate
-often shows instantaneous, rather than gradual, drops in population size, and these changes can occur at different starting densities.
to predict future changes in populations what is considered?
birth rate
expected longevity
proportion of individuals in a population that is able to reproduce
-which can be obtained from the age structure of a population
age structure
The number of individuals within each age group of a population.
Estimating the number of individuals of differing ages enables ecologists to predict whether the size of a population will increase or decrease.
age structure that is pyramid shaped tells us…
age strurcture that is more rectangular tells us…
A growing population usually shows a pyramid-shaped
stable (not changing) population shows a more even distribution of age classes (rectangular)
cohort and survivorship
cohort; A group of the individuals born at a given time.
survivorship: The proportion of individuals from the initial cohort that survive to each successive stage of the life cycle is called survivorship. (tells us mortality)
type I survivorship curve
-low morality at early ages
-seen in humans and larger mammals
-seen in k strategists
what do survivorship curves show
plot of age versus percentage of organisms surviving
type II survivorship
linear
inividuals are likelky to die at any point in life
seen in birds and small mammals
type III survivorship
high mortality in early parts of life
seen in insects etc.
r strategists
these organisms give birth to a lot to increases the probabiltiy that they will have at least offspring that survives
r strategists
a species that produces large numbers of offspring but provides few resources for their support.
reproduce at rates approaching , the maximum intrinsic rate of increase.
type II and III
undergo external fertilization
s evolve in unstable, changing, and unpredictable environments.
k strategists
type I survivorship curve
produce only a few young and are K-strategists because their population densities commonly lie near the carrying capacity K.
A species that produces relatively few young but invests considerable resources into their support.
internal ffertilization
n stable, unchanging, and predictable environments, where there tends to be more crowding and larger populations
life history tradeoff concept
Because organisms only have a finite amount of energy and resources, they cannot maximize everything. Resource limitations force tradeoffs between survival, growth, and reproduction. For example, a plant can produce a few large seeds (high survival chance per seed, huge energy cost) or thousands of tiny seeds (low survival chance per seed, low energy cost per seed), but it cannot produce thousands of massive seeds.
metapopulation
A large population made up of smaller populations linked by migration.
-includes mainlands and issland populaitons
-linked by occasional movements of individuals among them along corridors
-all of the same species
extinction rate and metapopulations
A metapopulation is a "population of populations" linked by immigration and emigration.
Extinction Risk: Small subpopulations (sinks) have a high risk of local extinction due to small sizes and poor resource quality.
The Rescue Effect: High dispersal ability allows individuals from high-quality patches (sources) to migrate and save dwindling sink populations from extinction.
Corridors: Narrow strips of habitat that combat habitat fragmentation by maintaining connectivity, lowering extinction rates, and allowing for re-colonization.
habitat patch and island
An area of continuous, relatively homogenous habitat that provides the specific resources and conditions a species needs to survive and reproduce. It is surrounded by a "matrix" of distinctly different, unsuitable habitat.
Context/Examples: A patch of forest surrounded by agricultural cornfields, or a park in the middle of a paved city.
Key Concept: Habitat patches form the individual pieces of a metapopulation. They are usually terrestrial and often created by humans via habitat fragmentation
island is not always water; Ecologists commonly generalize the term “island” to refer to any habitat patch that is surrounded by a substantial expanse of inhospitable environment
source and sink populations
Source Populations: High-quality habitats where birth rates exceed death rates. These populations produce a surplus of individuals that emigrate to other patches. can rescue sinks through recolonization or dispersal
Sink Populations: Low-quality habitats where death rates exceed birth rates. These local populations would go extinct if not for a constant influx of immigrants from source populations.
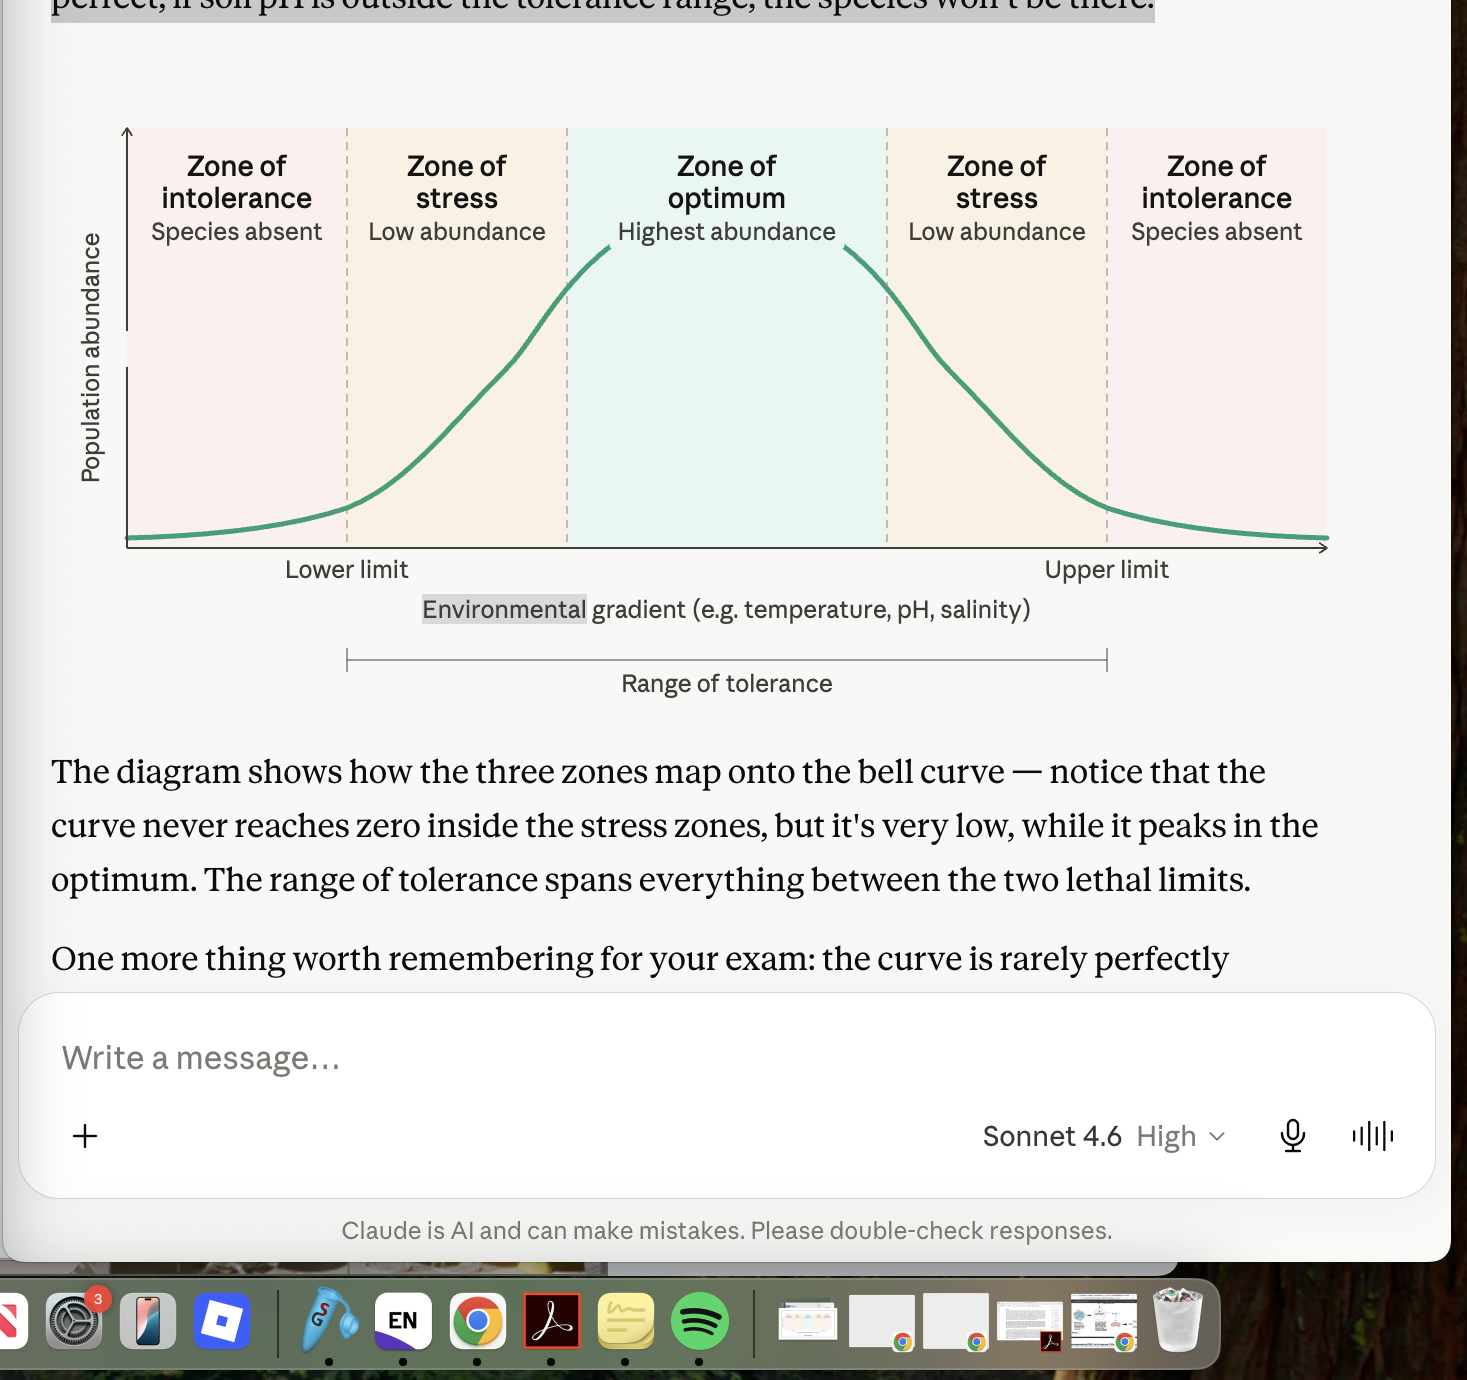
law of tolerance and three zones of tolerance
An organism's geographic distribution is limited by its ability to tolerate variations in environmental factors.
Zone of intolerance — These are the conditions at either extreme end of the spectrum, beyond which the species simply cannot survive. If a fish requires water between 5°C and 30°C, temperatures below 5° or above 30° fall into this zone — the organism dies or cannot exist there at all.
Zone of physiological stress — Just inside the lethal limits, conditions are technically survivable but costly. The organism is alive, but it's working hard just to maintain basic functions. Growth slows, reproduction drops off, and the individual is more vulnerable to disease or predation. Think of it as the organism running on fumes — technically functional, but not thriving.
Zone of optimum — This is the middle range where conditions are ideal. The organism grows well, reproduces successfully, and is most abundant. This is where you'd expect to find the highest population densities of that species. It sits between the two stress zones and represents the "sweet spot" for that environmental variable.
how to interpret a tolerance curve
plot a species' population response against an environmental gradient (like temperature, salinity, or rainfall), it creates a bell-shaped curve divided into three distinct zones. These zones map directly to where you will find the species on a map.
he model applies to any abiotic factor — temperature, salinity, pH, light, moisture — and each species has its own unique tolerance curve for each factor. A species' realized distribution in the real world is shaped by whichever factor is most limiting (Liebig's Law of the Minimum is the related idea here). Even if temperature is perfect, if soil pH is outside the tolerance range, the species won't be there.
-the factor level incorporates all components of abiotic factors
Niche
The combination of a species’ physical habitat and its ecological role in that habitat
fundamental niche
es the full range of climate conditions and food resources that permit the individuals in a species to live
It is defined solely by abiotic factors (e.g., temperature, water availability, pH). It represents the theoretical, maximum range of conditions and resources a species could survive in without any interference or limitations from other organisms
realizied niche
The actual resources and habitats used by a species.
The actual, restricted space a species occupies in nature due to interactions with other organisms (like competition, predation, and mutualism) is called the realized niche.
phylogenetic niche conservatism
The observed similarity in closely related species of some aspect of their niches, indicating its presence in their common ancestor.
how to analyze fundamental vs realizied niche graphs
-graphs that define fundamental and realizied niches are on tolerance graphs
-the overlap zone between fundamental niches is the compeition zone
-the one with the higher curve in the overlap range outcompetes the other, making the losing species pushed to one side; the weaker species niche becomes the nonoverlapping protionof its fundamental niche
-a large shift for one species in its new realizeid niche means strong compeitiotn and smallshift means weak
-farther apart peaks means less compeition and easier coexsistence
the realized niche is always equal to or smaller than the fundamental niche — never larger. (EVEN the WINNING SPECIES PEAK DIPS SINCE ITS PAYING A COST IN COMPETING→ SHOWS THAT COMPEITTION ALWAYS LEADS TO A COST FOR BOTH)
-of neither species wins, (coexsistence) then both peaks may drop a little in the shared region, but both species persist across the full gradient.
antagonism
, interactions in which at least one participant loses more than it gains.
-compeititon, paratism, predation
competition
An interaction in which the use of a mutually needed resource by one individual or group of individuals lowers the availability of the resource for another individual or group. abiotic factors and biotic factors are the resources
-for both individuals undergoing compeition, it is generally a lose-lose situation for both individuals involved, even the winning species loses; Individuals either lose access to resources or they spend energy on securing resources that otherwise could be used for reproduction.→ struggle for exsistence
intraspecific competition
Competition between individuals of the same species.
defines the tension between the intrinsic rate of increase and the environmental carrying capacity
the increase in interspecific compeition is a major reason why population growth slows as the population approaches the environments carrying capacity
interspecific competition
Competition between individuals of different species.
competitive exclusion (can lead to….)
-defines that that two species cannot occupy the exact same niche at the same time, also applies to overlapping niches (they work to minimize overlap)(but overlap is still allowed)
through comptetiton; , one will either become extinct in that place or change its niche. (change could mean simply shifting)
can lead to..
change of fundamental niche to realizied niche, smaller niche for both species
local extinction of the other species
resource partioning
-driver of coexsistence
-A process in which species with overlapping niches diverge over time to minimize the overlap.
-it allows similar but diffferent species to coessit in the same niche (their fundamental niche shifts) as they diverge
-driver of diversification and speciation
-parodxially, competitive exclusion can lead to divergence and speciation through learned resource partiioning
predation
is a type of interaction in which one organism, a predator, consumes another, its prey. In this interaction, the predator benefits at the expense of the prey
-one of them benefits and the othe loeses (unlike compeittion which both species are at a aloss)
-stable equillbrium between predator and prey relationship; one of them dips and the other also dips but not at the same time, its a reaction between each other
what is a requirement for predator prey systems to be stable and what are the effects of this relationship
Predator–prey systems can be stable if there are sufficient areas available where prey can escape predators, at least temporarily.
can effect non prey species; i.e e, predators can limit the population sizes of their prey to the extent that competitive exclusion does not occur between the prey and a competing population
paratisism
-An organism that lives in close association with another species, consuming or gaining nutrition from host tissues, generally without killing the host.
-different from predation as it does not instantly kill the host
-the efect ont he other species population is long term and can limit them from reachig carrying capscity but does not dramticallly reduce population
herbivory
the consumption of plants
when does a relationship between species become mutualistic
When the benefits for each participant outweigh their costs,
An interaction between two or more species that benefits all→ for mutalism, the relaitonship MUST benefit both species
symbioses
A close interaction that has evolved between species that live together, often interdependently.
symbioses can drive recipriocal adaptations between the two species and thus….
develop long term coevolution
can mutualism also drive resouorce partiioning and speciation?
exmaple 1: prevention of compeition→ mutualistic networks (such as plant-pollinator or host-microbe systems), high densities of species often gather in the same area. To avoid intense competition for mutualistic services (e.g., vying for the same pollinators), species undergo niche differentiation
example 2: finding a new partner→ Mutualism facilitates speciation primarily through divergent selection and partner shifts. When a lineage within a mutualism evolves to rely on a new partner or a specialized mutualistic strategy, it begins to diverge from the original population
obligative mutualism and factulative mutualism
obligative; In ecology, a type of mutualism in which one participant requires the other to survive. In metabolism, a means of gaining energy or carbon that is required by the organism; that is, it has no other options, as in an obligate photoautotroph.
faculative; In ecology, at type of mutualism in which one or both sides can survive without the other. In metabolism, a means of obtaining energy that is sometimes but not always used.
current obligative realtionships could have ev olved from faculative relationships over time
commensalisms
An interaction between species in which one partner benefits with no apparent effect on the other.
ammensalism
n which one species in an interacting pair is harmed with no apparent effect on the other.
facilitation (difference between commensalistic and mutualistic relationships between two species?)
An indirect interaction between two species in which one species changes the environment in such a way as to benefit another species.
-can be seen in both commensal and mutualistic relationships
commensalitc and mutualistic relationships are diefned by direct sepcies to species interactions while factiotialiton is environmentally effecting
community
the set of all populations of two or more different species found in a given place at a particular time.
Populations in a community are connected by their various interactions as well as by their physical location.
requirements for different populations of species in a community
0cannot have the exact same geogrpahical distribution
if actvities are the same/ function in their niche, then theya lso differ in time of doing the activity (differetn insect pollinators)
biodiversity
Biological diversity; the TOTAL number of species, or, more broadly, the diversity of genetic sequences, cell types, metabolisms, life histories, phylogenetic groups, communities, and ecosystems.
species richness
the number of species present in a particular area,
how is species richness measured for communities that are very large
s. In terrestrial environments, the number of plant species is often a good predictor of total species diversity. For example, there are approximately four times as many animal species as plant species known on Earth. Therefore, scientists estimate the numbers of animal species by multiplying the number of plant species by 4.
aspects of biodiversity
species richness
species eveness
species eveness
relatiove proportions of individual species in a community in comparison to the total
effect of species eveness and richness on extinction rates and suvivorship
the more even and more rich, the stronger the community is agaisnt surviving distruptive factors
keystone species
Pivotal populations that affect other members of the community in ways that are disproportionate to their abundance or biomass.
-the limiantion of this keystone species shifts the relationships and the proportions and species richeness eveneess of a communtiyb
succession (primary and secondary)
In ecology, the process of species replacing one another in time in a predictable sequence; each species modifies the habitat by affecting the environment or changing the community structure, creating opportunities for other species
primary: the intital colonization of a previously uninhabited areasecondary: reestablishment of communities following disturbance
-species colonize and transform the habitat in a predictable sequence that reflects the adaptations of participating species.

climax community
A mature assembly of species, a final stage in succession, in which, in the absence of environmental disturbance, there is little further change in species composition.
island biogeography and species equillbrium
-why are islands interesting to observe sepcies diversity and community
* The Equilibrium Model: The number of species on an island ($S$) is a dynamic balance between Colonization Rate (new species arriving) and Extinction Rate (established species dying out).
As Species Richness Increases: * Colonization decreases (fewer remaining immigrants are "new" species; less empty space).
Extinction increases (more intense interspecific competition and smaller population sizes).
The Two Physical Drivers:
Island Size: Affects Extinction. Large islands = lower extinction (more space/resources).
Island Isolation: Affects Colonization. Near islands = higher colonization (easier to reach).
-what is species eqillbirum in an island and how is it determined
species number equillirum; the point of intersectionbetween rate of colonization and extinctio, species diversity is at equillvirum
This does not mean that no new species will colonize the island, but instead that the establishment of a new colonist species will replace the extinction of one already in place. There is generally turnover in species composition through time.
theory of island biogeography (what do they mean about hte number of species that CAN occupt an island)
A theory that states that the number of species that can occupy a habitat island depends on two factors: the size of the island and the distance of the island from a source of colonists.
-basically the size and distance of the island determines the equillbrium point (whihcis defined by rate of colonization and extinction)