ess w10 l1 - observed changes in cryosphere
1/23
Earn XP
Description and Tags
cryosphere
Name | Mastery | Learn | Test | Matching | Spaced | Call with Kai |
|---|
No analytics yet
Send a link to your students to track their progress
24 Terms
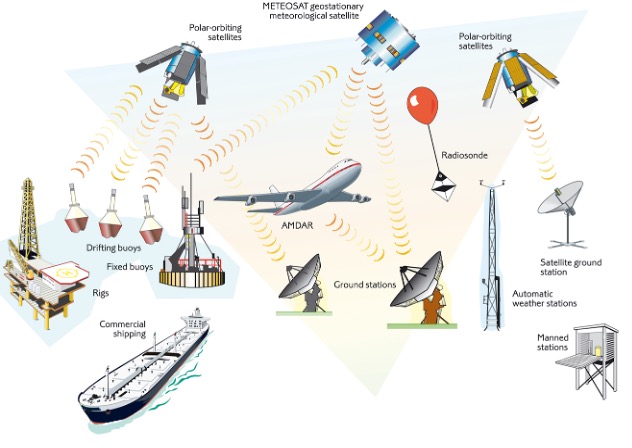
Observing weather and climate:
In-situ measurements for glacier mass balance monitoring:
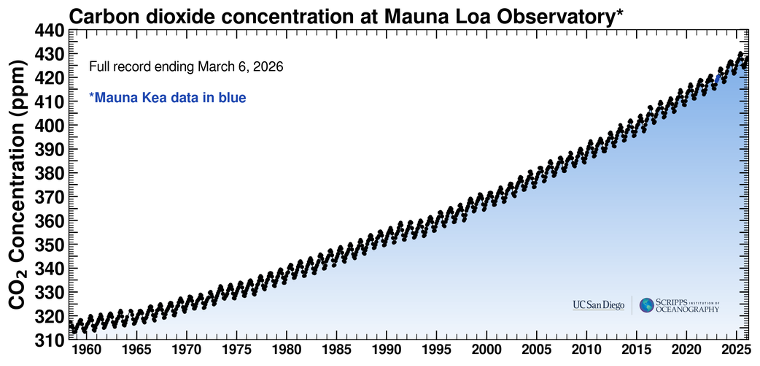
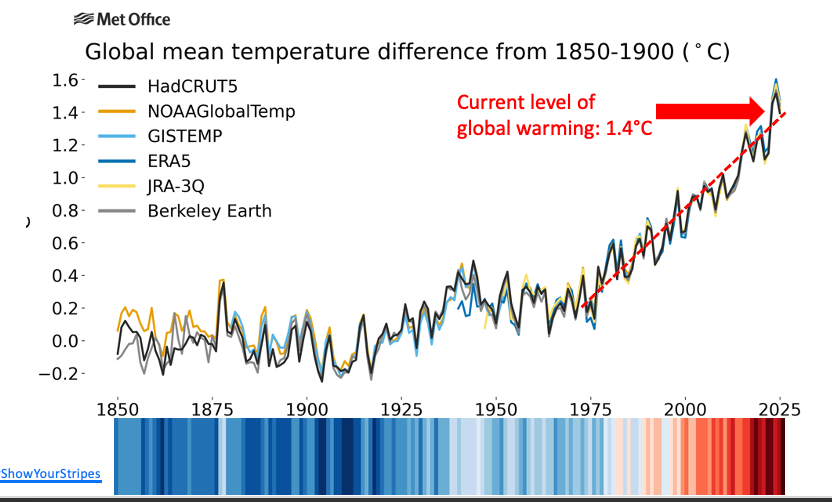
Current drivers of global warming:
Increased greenhouse gases caused by human emissions
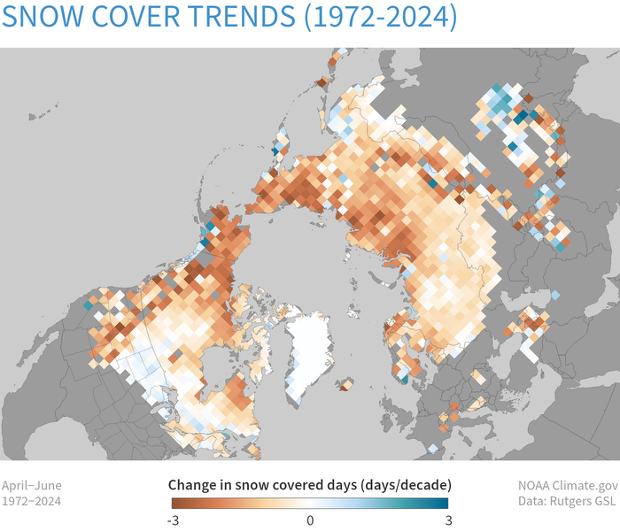
Number of days with snow cover per year has declined over the last 5 decades:
Glaciers are melting worldwide:
Warming in the last 40-60 years has led to spring floods happening earlier by about 10 days per decade
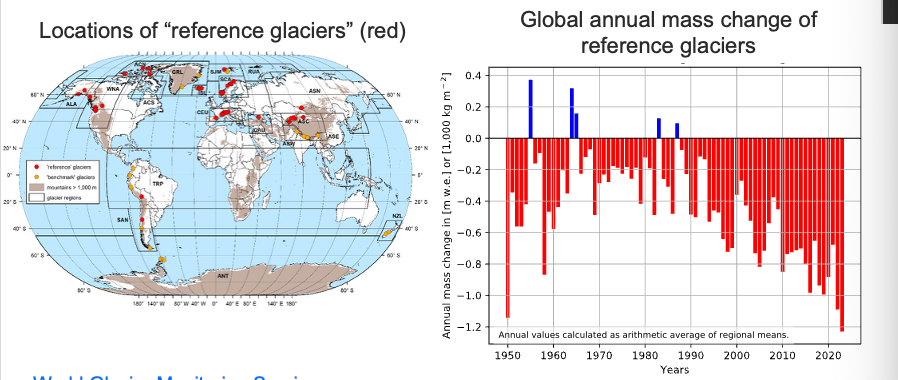
Annual mass loss of glaciers is increasing:
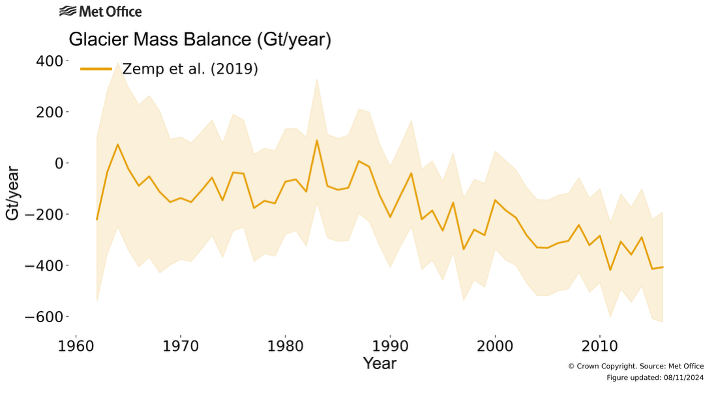
Glaciers are losing hundreds of billions of tonnes of ice per year worldwide:
And loss of ice from glaciers is accelerating:
Greenland ice sheet:
Area ~ 2 x 10^6 km^2
Approx. 1.2% of global land surface
Contains enough ice to raise average sea level by 7.36m if all completely melted
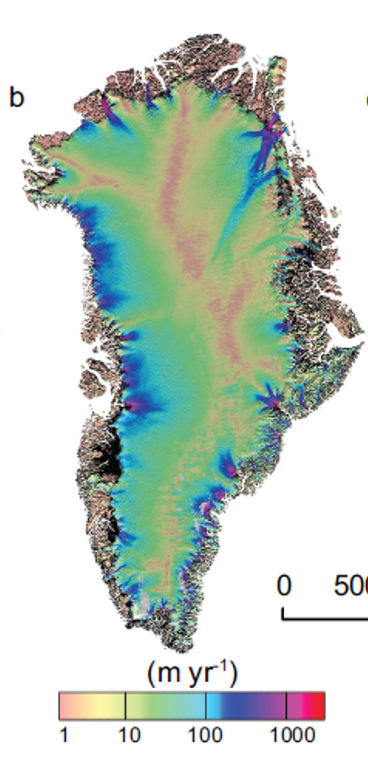
Flows of ice in Greenland ice sheet:
Ice sheet velocity for 2007-2009 determined from satellite radar interferometry data
Fastest flow in red, fast flow in blue and slower flow in green and yellow
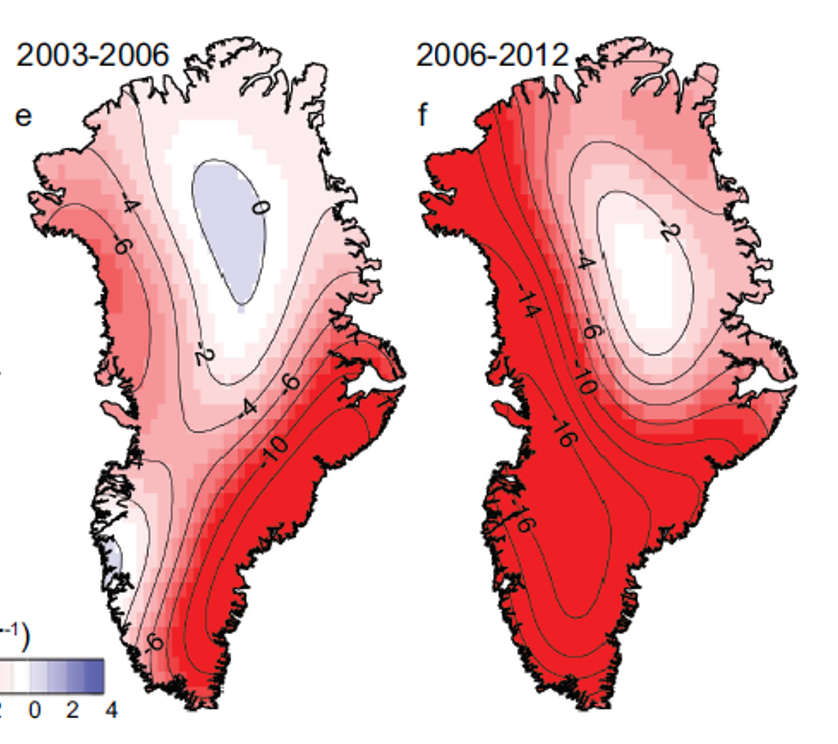
Greenland ice sheet mass changes:
Ice loss in centimetres of water equivalent per year for
2003–2006 and 2006–2012
Red: ice loss, blue: ice gain
From GRACE (Gravity Recovery and Climate Experiment) satellites: measure changes in Earth’s gravitational field, showing how mass is distributed around the planet
Changes in ice sheets: Greenland:
Antarctic ice sheet:
Area ~14 x 106 km2)
Approx. 8.3% of global land surface
Contains enough ice to raise global average sea level by 58.3m if all completely melted
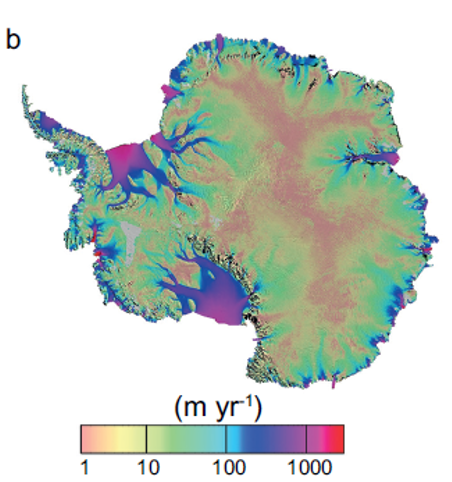
Flows of ice in Antarctic ice sheet:
Ice sheet velocity for 2007–2009 determined from satellite radar interferometry data
Fastest flow in red, fast flow in blue, and slower flow in green and yellow
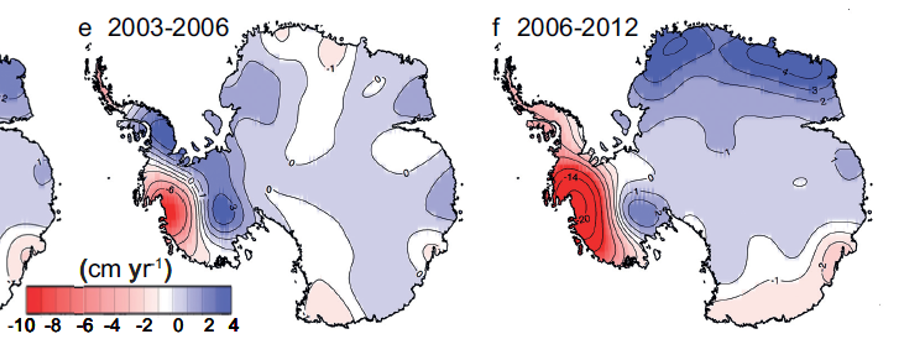
Antarctic ice sheet mass changes:
Ice loss from GRACE satellite measurements of Earth’s gravitational field changes
Centimetres of water equivalent per year for 2003–2006 and 2006–2012
Red: loss, blue: gain
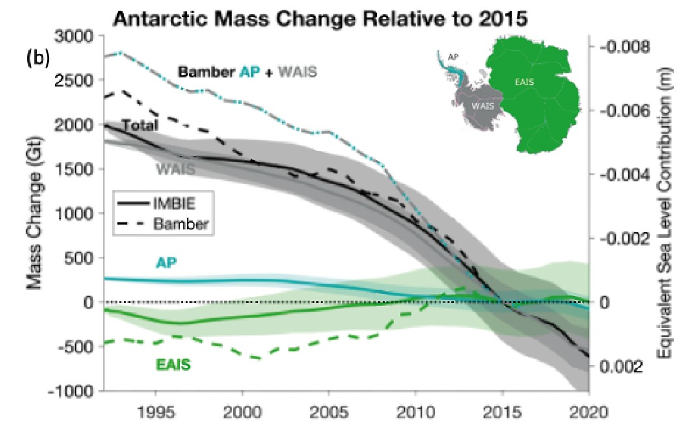
Changes in ice sheets: antarctica:
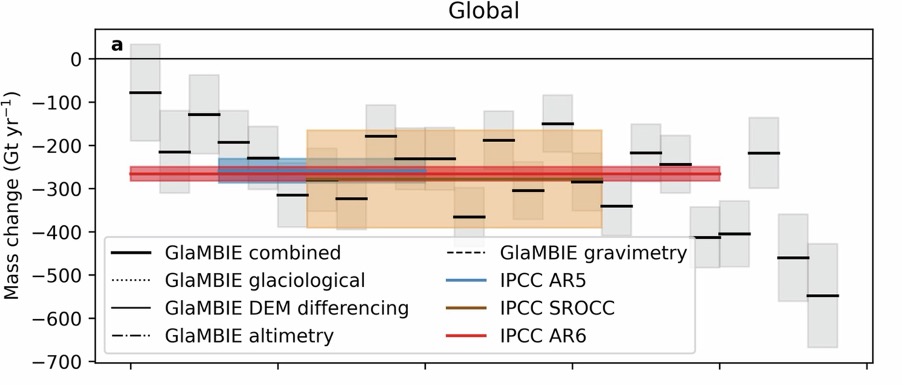
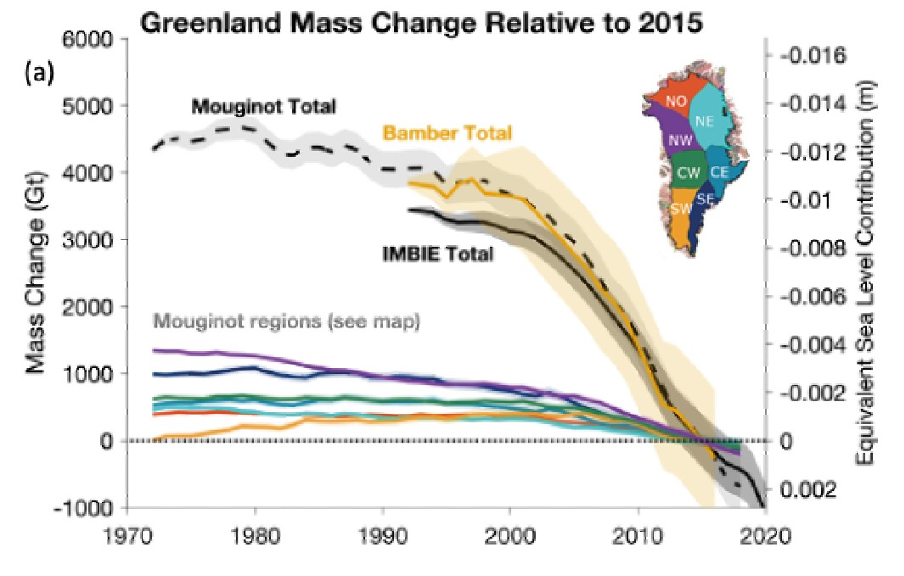
Comparison of ice loss from land ice bodies:
Antarctic Ice Sheet lost 2670 Gigatonnes of mass (uncertainty range 1800 to 3540) over 1992–2020
Greenland Ice Sheet lost 4890 Gigatonnes of mass (uncertainty range 4140 to 5640]) over 1992–2020
Glaciers lost 6200 Gigatonnes of mass (uncertainty range 4600 to 7800) over 1993–2019
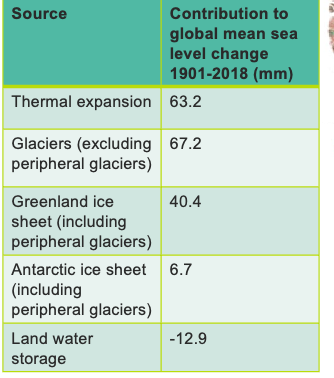
Influences on recent sea level rise:
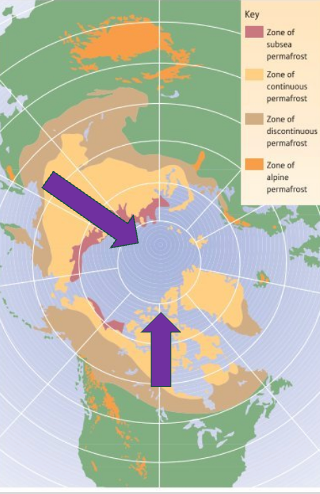
Permafrost changes:
In the Northern Hemisphere, the southern limit of permafrost has been moving North since the 1970s
Permafrost changes: since 1980s
Permafrost temperature increased by up to 2°C
Active layer thickness increased by up to 90 cm
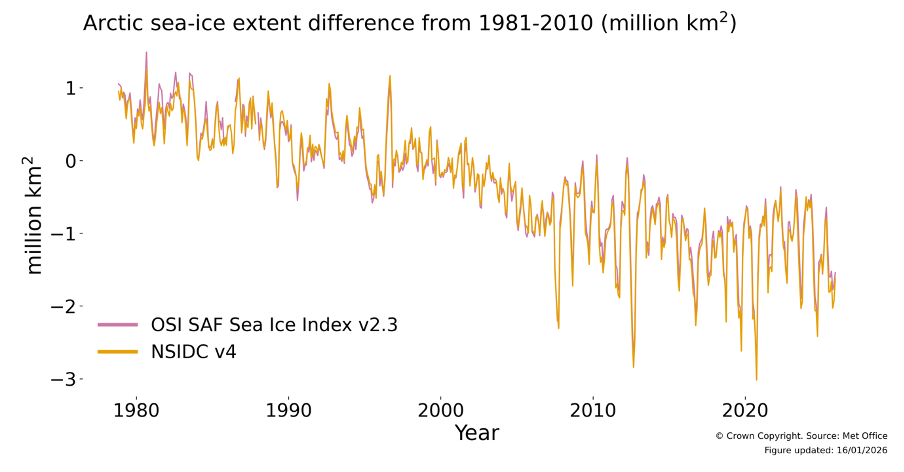
Sea ice changes:
Arctic sea ice extent has declined since 1980, and become more variable
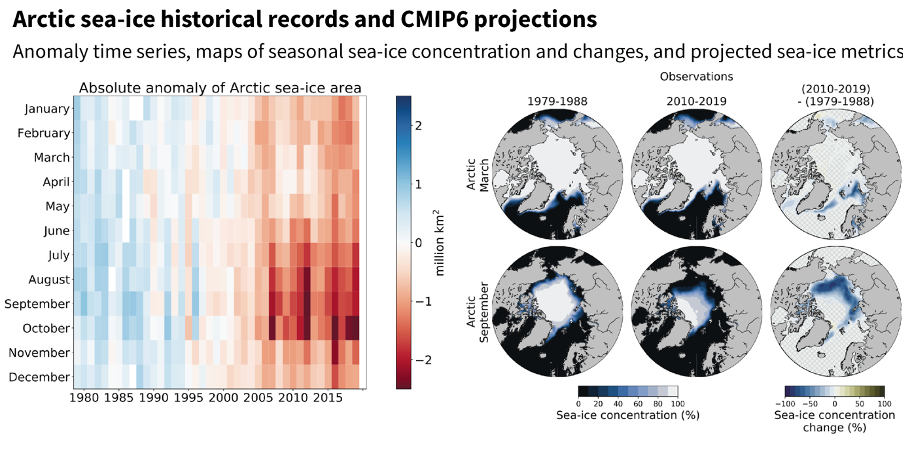
Averaged over 2010–2019, the monthly Arctic sea ice area from August to October was around 2 million km² (or about 25%) smaller than during 1979–1988
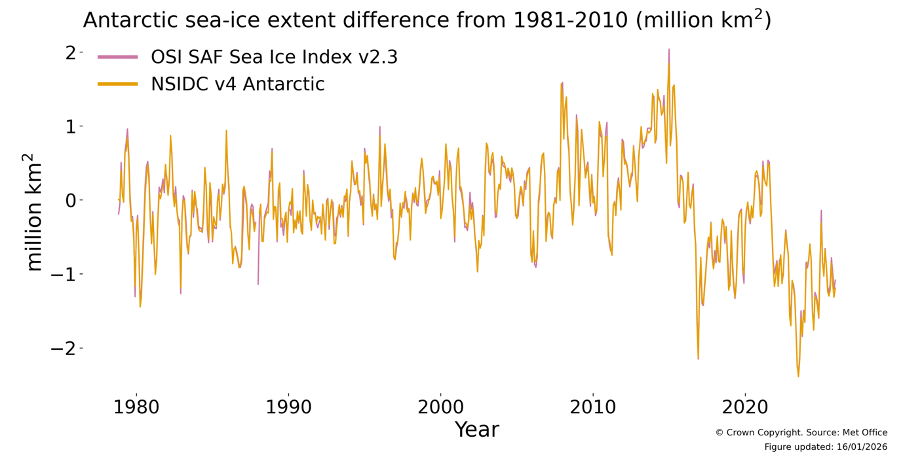
Antarctic sea ice extent was steady or increasing until 2015, then declined:
Reproductive failures and declining abundances attributed to warmer polar oceans and less sea ice cover are observed in populations of polar bears, seals, whales and marine birds
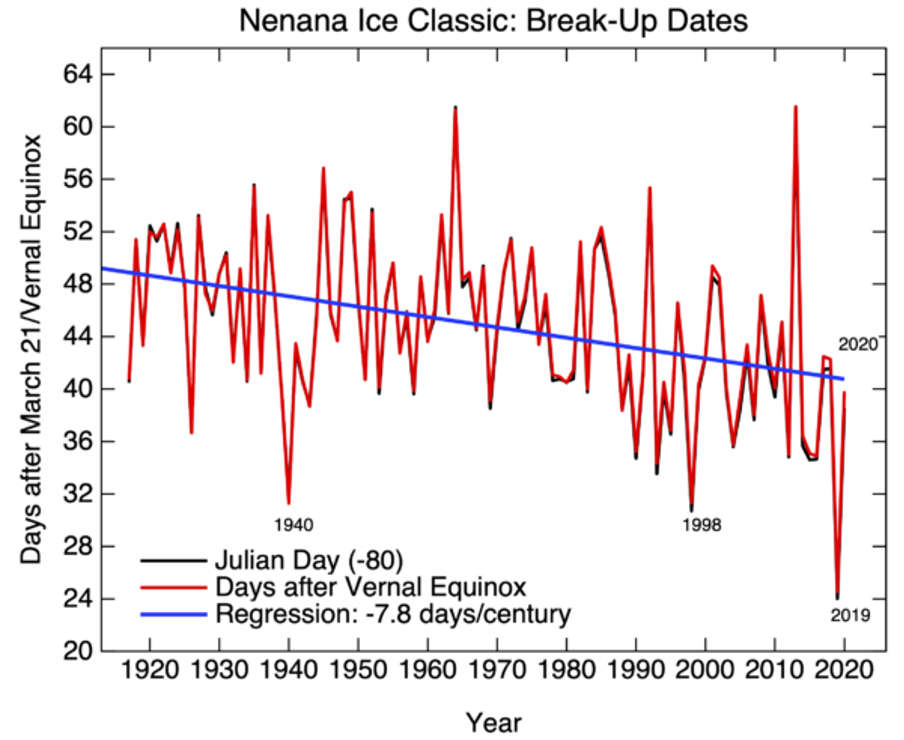
River ice:
Betting on timing of when Tanana River ice will break up at