Unit 9 - Testing Claims
1/25
There's no tags or description
Looks like no tags are added yet.
Name | Mastery | Learn | Test | Matching | Spaced | Call with Kai |
|---|
No analytics yet
Send a link to your students to track their progress
26 Terms
significance test
formal procedure for comparing observed data with a claim (hypothesis) abt the population
^assessing a claim abt a parameter w/ data
null hypothesis
claim we weigh evidence against in a statistical test (H0, the claim itself)
H0: parameter = value
alternative hypothesis
claim abt the population that we are trying to find evidence for (Ha)
Ha: parameter </>/≠ value
^define parameter
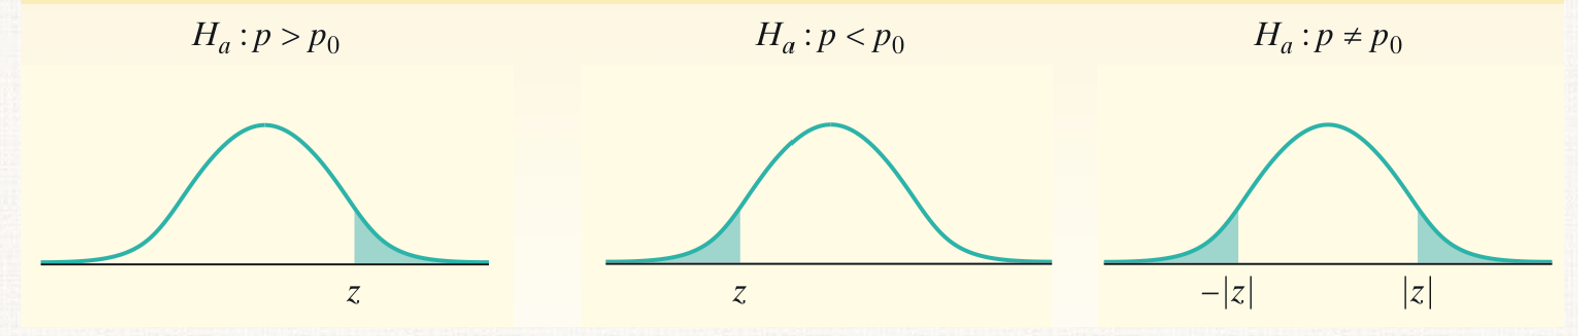
alternative hypotheses:
one-sided vs. two-sided
states larger or smaller than the null hypothesis value (use > or <) (one-sided b/c on curve either below/above value)
vs.
states the parameter is different from the null hypothesis value (in general; could be either larger or smaller) (use ≠) (“may differ”) (two-sided b/c on curve shows above and below the value. ex: get z=1, do above 1 and below -1)
!!! (flip to see ‘perfect’ significance test steps)
hypotheses made before collect data
H0 and Ha are essentially opposites (only 1 can be true)
hypotheses always refer to a population (use population parameter like p, μ)
an outcome that would rarely happen if the null hypothesis were true is good evidence that the null hypothesis is not true
need multiple samples of evidence to be convincing (simulate many many times)
don’t say ‘this proves []’ or ‘the null hypothesis is correct’
careful w/ what n is
if simulate N samples of size n, n is the sample size to use! also, if give σ from this data, use this value!
if know σ, use z and σ for mean! (1-mean z test!) → (x̄-μ)/(σ/√n)
P-value
the probability (computed assuming H0 is true) that the statistic would take a value as extreme or more extreme than the one actually observed
^!probability of getting a particular sample statistic if null is true
small P-value = good evidence against the null b/c observed result is unlikely to happen when H0 is true
small P-value → not likely to happen, reject H0 → convincing evidence for Ha
large P-value → likely to happen, fail to reject H0 → not convincing evidence for Ha (doesn’t mean you accept the null, just that there’s no convincing evidence against it)
significance level α
fixed value that we regard as decisive that is used to compare against the P-value
^default use 0.05
^want lower significance level if extreme consequence e.g. death (so less likely Type I error and harder to reject H0 in case it’s true)
statistically significant
P-value < α
^supports Ha
.
P-value < α → supports Ha, reject H0 → convincing evidence for Ha
P-value ≥ α → fail to reject H0 → not convincing evidence for Ha
Interpret P-value
>/<: Assuming the (H0 in context is parameter=[] or lower/greater (opposite of Ha!)), the probability of getting a sample (statistic) of [sample statistic value] or greater/smaller (match Ha) by chance is (P-value).
≠: Assuming the (H0 in context is parameter=[]), the probability of getting a sample (statistic) that is at least as different from (H0 parameter value) as the proportion/mean in the sample is (P-value).
*assuming H0 is true ^can say sample statistic/proportion/mean
Conclusion for significance test
Since P-value = [], which is </> α = [], we reject/fail to reject H0. We do/don’t have convincing evidence to support (Ha in context).
(only need to say H0, don’t have to define)
Type I vs. Type II error
reject null when it is actually true (probability of Type I error = α as a percent) (believe Ha over H0) (false positive, say Ha is true but it is false)
^find convincing evidence of Ha incr/decr when it really hasn’t
vs.
fail to reject the null when it is false (believe H0 over Ha) (false negative, deny Ha but it is true)
^don’t find convincing evidence for Ha incr/decr when it really has
^probability is #s of type II error (# of false negatives) over the # of times when H0 is false
.
BOTH: say the error and the consequence(s)
Relate α and probability of Type I error
incr α, incr probability of Type I error, more likely to reject H0
decr α, less probability of Type I error, less likely (aka harder) to reject H0 (b/c making test stricter and need stronger evidence to reject null & show statistical significance)
^probability is # of false positives over # of times H0 is true
Conditions for significance test abt a proportion
randomness (ex: SRS) (say ‘random sample’ and quote the Q)
10% condition (n≤0.1N)
LCC (np≥10 & n(1-p)≥10) (use p (H0 value) NOT p-hat! would use p-hat for confidence interval)
don’t meet LCC? - look at distribution of sample data, see relatively normal/no strong skew or outliers (say “since [] shows relative normality/no strong skew, I can proceed w/ z test using caution”)
test statistic (proportion)
measures how far a sample statistic diverges from what we would expect if H0 is true, in standardized units (a z-score)
test statistic = (statistic - parameter)/SD of statistic
z = (p̂-p)/√[(p(1-p)/n]
^parameter is μp̂ (which is p), SD of statistic is σp̂ from sampling distribution of proportion
![<p>measures how far a sample statistic diverges from what we would expect if H<sub>0</sub> is true, in standardized units (<u>a z-score</u>)</p><p>test statistic = (statistic - parameter)/SD of statistic</p><p><span style="color: rgb(255, 255, 255);"><mark data-color="yellow" style="background-color: yellow; color: inherit;">z = (p̂-p)/√[(p(1-p)/n]</mark></span></p><p>^parameter is μ<sub>p̂</sub> (which is p), SD of statistic is σ<sub>p̂ </sub>from sampling distribution of proportion</p>](https://knowt-user-attachments.s3.amazonaws.com/ff56ddfa-b5b1-4fa4-b19b-d3f676d5f4fb.png)
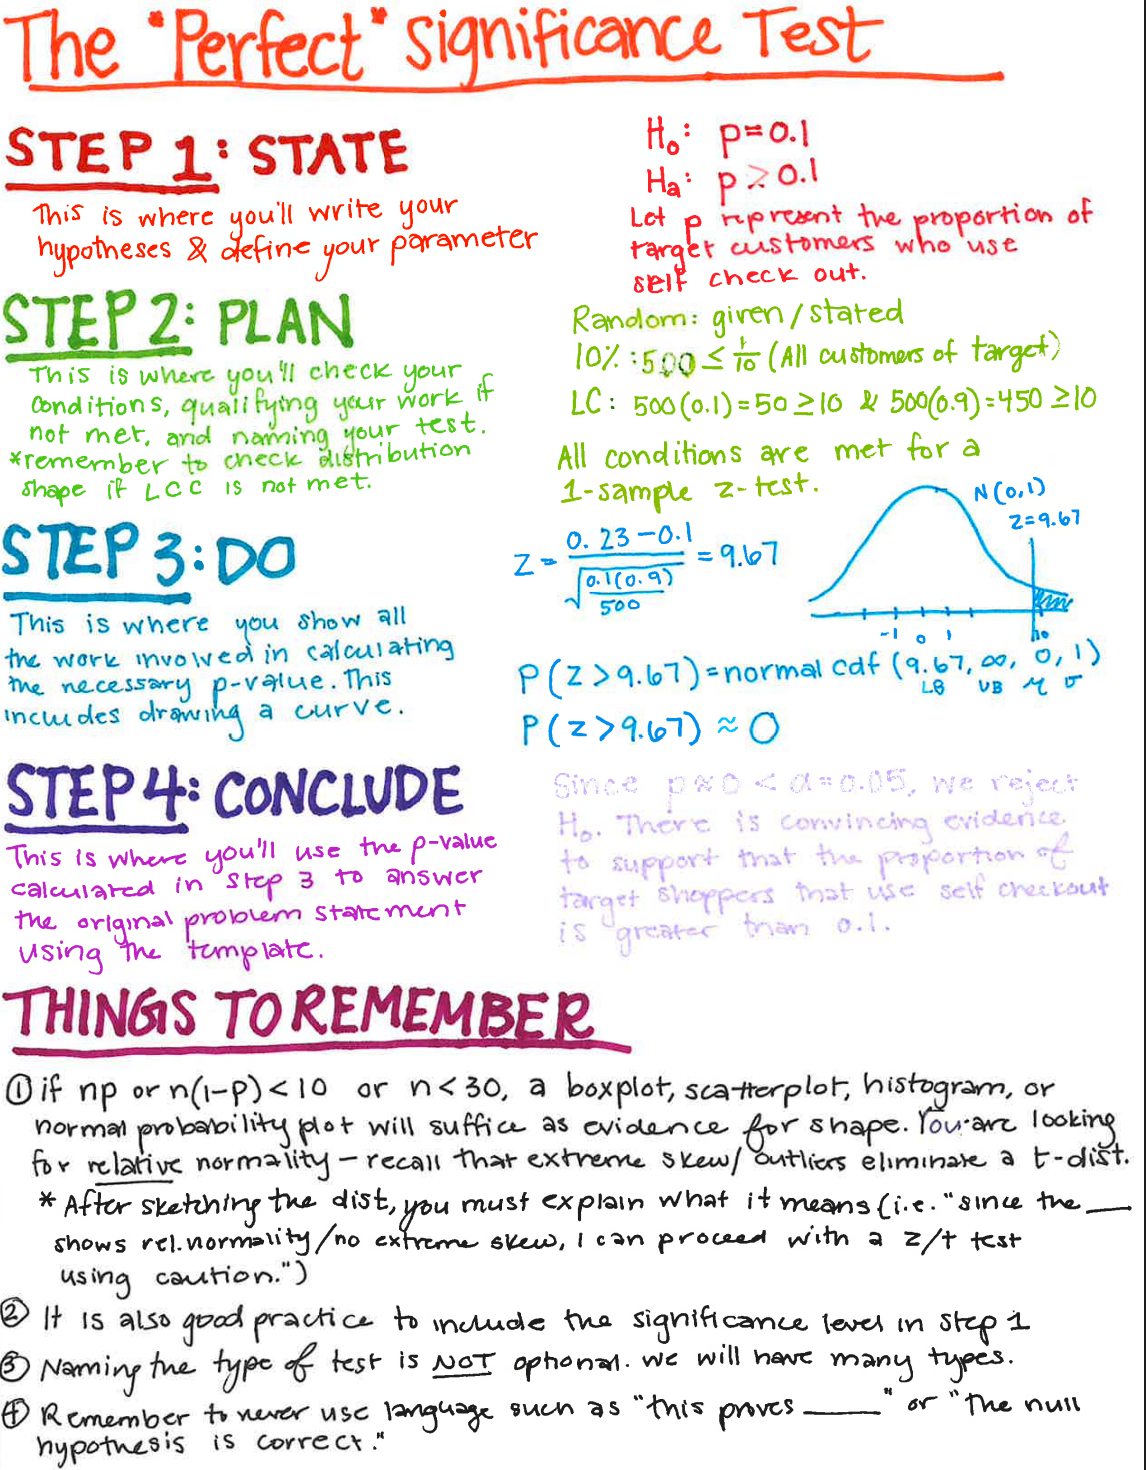
Significance Test Steps
*see how to draw curve, p0 is null, says p but is same for μ
State
write hypotheses, define parameter (p, μ) & significance level α
Plan
check conditions (random sample - quote what the question says, 10% - say ‘reasonable to assume (n≤0.1N)’ if N is words/description)
name the proper inference procedure/test (“all conditions met to proceed with 1-proportion z-test”; “all conditions met to proceed with 1-mean t-test”)
Do
Draw curve for significance test (shade area that matches Ha)
proportion: get z-score, can use standard normal curve & label (N(0,1). Draw mean of 0, SDs of 1, and tick w/ z-score)
mean: get t, draw curve with 0 in middle as mean, label curve as t with degrees of freedom as subscript (ex: t35). Put mean 0, SDs of 1, & tick is t
show work to get test statistic (write out formula for z or t & w/ #s plugged in) and P-value (write probability statement that matches the curve/Ha → ex: probability statement for p-value:
for Ha of <: P(z>2)
for Ha of >: P(z<2)
for Ha of ≠: P(z<-|2| or z>|2|) = 2P(z>|2|)
^do same for t; can be any # you get for t/z
proportion: use normalcdf to get P-value. If Ha says less than, then test statistic is upper. if Ha says greater than, then test statistic is lower #)
ex: Ha: p > 0.37, get test statistic of 1.3, do normalcdf (1.3, 100, 0, 1)
OR use [stat] Tests ‘1-PropZTest’ (plug in null hypothesis value for p0, x for # of things, n for sample size (x/n is the proportion), prop is what Ha is) to get p (p-value), p̂ (x/n), z (test statistic), n (again) + says Ha at the top of the screen)
mean: use tcdf to get P-value (only use values of t!!!)
Conclude
answer question by comparing P-value and α
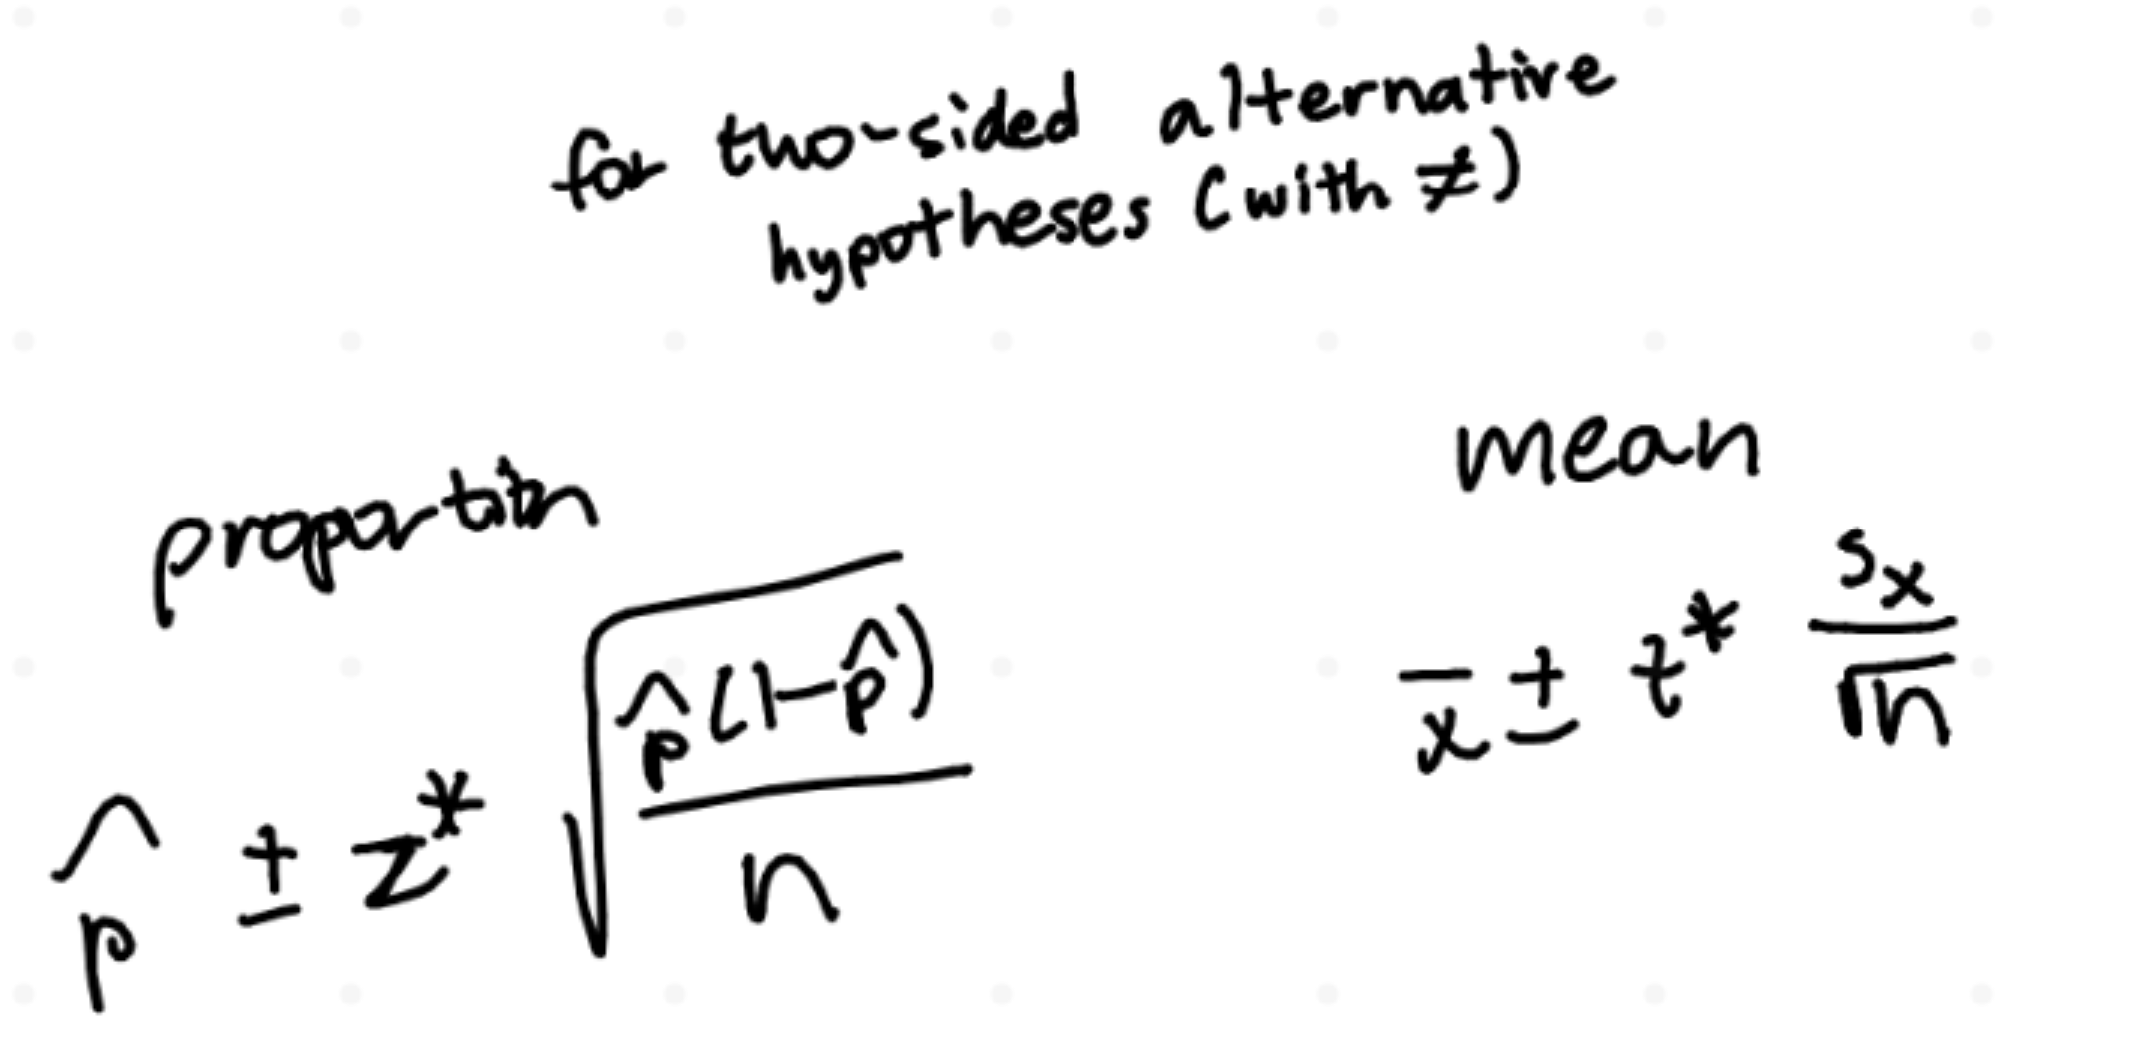
!!! ≠ is vague, don’t know if > or < → use confidence interval for two-sided hypothesis (≠) (confidence intervals can be used for one-sided or two-sided alternative hypotheses)
^z* use invNorm w/ area as C% as a decimal
^t* use invT w/ area as only one tail → (1-C% as decimal)/2
^α determines confidence level C% → C% = 100(1-α)%
^CI has null value -> fail to reject bc H0 is plausible
^CI doesn't have null value -> statistically significant, can reject null
careful for Ha - read question if says less than(<)/greater than(>)/different (≠)
for mean, use t-distribution w/ n-1 degrees of freedom (NOT standard normal curve like for proportion)
conservative with degrees of freedom, round down
don’t use absolutes e.g. prove
power of a test
against a specific alternative is the probability that the test will reject H0 at α given the Ha is true
^probability of correctly rejecting H0 when H0 is false/probability of finding convincing evidence for Ha when Ha is true
interpret power: probability of correctly rejecting H0 when it is false is (power), and can conclude that the true p/μ (in context) is (Ha)
+given that (Ha w/ context), if apply test on repeated samples of the same size, about (power %) of the samples we would expect to correctly reject the null in favor of the alternative
power = 1-β (β is probability of making a Type II error (fail to reject H0 when H0 is false))
*want higher power so more likely to correctly reject the null
What affects power?
Sample size (incr n, incr power)
α (incr α, incr power b/c more likely to reject null)
value of the alternative parameter AKA difference btwn hypothesized and true mean (incr this, incr power)
How to avoid type I and type II error
decr α (probability of type I error)
vs.
incr α
^b/c α is likelihood to reject null. for type I want to decr α so less likely to reject null in case it’s true. for type II want to incr α so more likely to reject null in case it’s false.
How to get p-value for Ha: [] ≠ #
do 2 times the p-value you get from 1-PropZTest/normalcdf/tcdf (2 times the probability of just one side) (b/c don’t know if > or <, so want both sides (as much difference since use z or t))

Conditions for significance test abt mean
random sample (quote the Q)
10% (n≤0.1N)
(CLT:) pop. has normal distrib. OR n≥30 OR distrib. of sample data has no strong skew/outliers
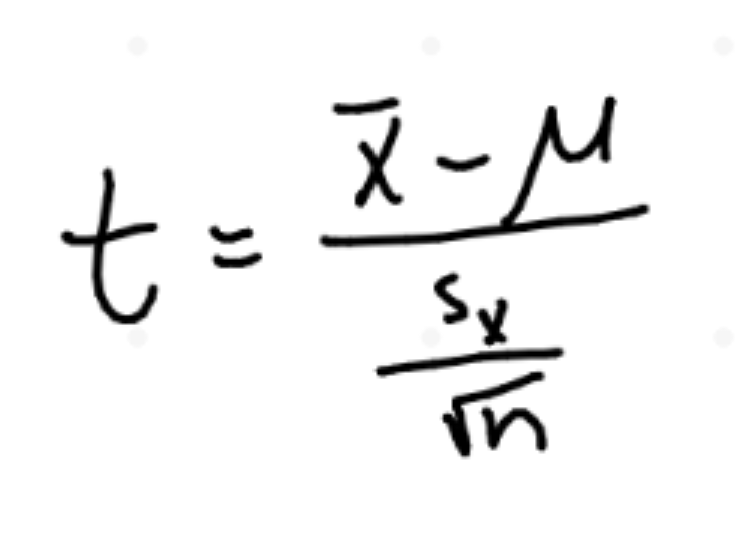
test statistic (mean)
t = (statistic-parameter)/SD of statistic
^use sx if have sample SD and no population SD
paired data
study designs that involve making 2 observations on the same individual (count n by # of individuals) OR one observation on each of 2 similar individuals (count n by # of pairs, like a block!)
^for comparative studies, for mean difference
^use a matched pairs design!
paired t procedures
paired data from measuring the same quantitative variable twice (usually test a product/program/etc, compare results, for mean difference) (after check conditions)
!!! smaller significance level α -> need stronger evidence to reject the null hypothesis
higher power gives better chance to detect a difference when it really exists.
at any significance level/desired power, need larger sample to detect a small diff btwn null and alternative parameter values than detecting a large diff
statistically significant -> good evidence of a difference (can be very small) (for mean difference)
^large sample -> even small deviation from null can be significant
statistical significance has meaning (only) if you decide what diff ur seeking, design a study to search for it, and use a significance test to weigh the evidence u get
most important condition for sound conclusions from statistical inference is that the data comes from a well-designed random sample OR randomized experiment
statistical test more likely to find a significant increase in mean [] if very large sample and use 5% sig level (5% b/c less strict) (large sample incr statistical power, making tests highly sensitive to even trivial differences)
use t for test abt pop mean b/c z requires u know pop SD of σ
What to know about mean difference
null usually H0: μ = 0. look at what u are subtracting to see what the Ha is (ex: x-y, want y to be bigger, so Ha: μ < 0)
when define parameter, write what you are subtracting
interpret P-value: assuming the mean diff is 0 (the avgs are the same for both things you are doing subtraction with), the probability of getting a mean difference of [] or smaller/bigger (match Ha) is [P-value]