WILD 240 Biostatistics: Final Exam
1/160
There's no tags or description
Looks like no tags are added yet.
Name | Mastery | Learn | Test | Matching | Spaced | Call with Kai |
|---|
No analytics yet
Send a link to your students to track their progress
161 Terms
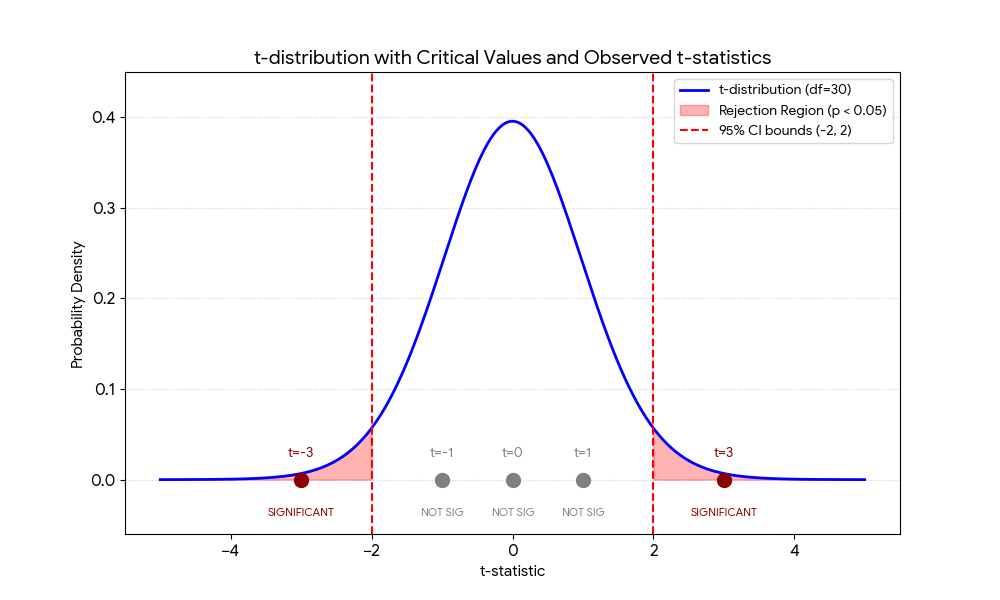
Draw a t-distribution with a mean of 0 and 95% confidence intervals of -2 and 2. Imagine that you conducted five t-tests, and obtained t-statistics from those tests of -3, -1, 0, 1, and 3. Add these t-statistics to your figure, and clearly indicate which of these t-tests would be significant with alpha = 0.05 (i.e., a p-value of less than 0.05)?
The t-statistics of -3 and 3 would be significant because they are outside the bounds of -2 and 2.
The t-statistics of -1, 0, and 1 would not be significant because they fall within the 95% confidence intervals
what is a t-distribution?
the expected t-statistic you would get assuming the null hypothesis is true
what is a p-value?
the probability of obtaining a t-statistic at least as extreme as the observed t-statistic if the null hypothesis were true
what is a scalar?
a single number, lowercase & unbolded
ex: n = 1
what is a vector?
a one-dimensional data structure that holds ordered data of the same type
multiple numbers & bolded
ex: n = [660, 825, 1000, 1150, 1250]
what is a matrix?
a two-dimensional (vectors of vectors) data storage device
M is uppercase & bolded
ex: M =
[1 0 0
0 1 0
0 0 1]
what is an array?
can be 3-dimensional or n-dimensional
ex: M[3, 3, 3] or M =
[1 4 7
2 5 8
3 6 9]
(these are both arrays)
what does each number represent in M[2, 4, 6]?
2 = one-dimension, row
4 = two-dimensional, column
6 = third-dimensional, “turning the page”
what is M[2,2] for M =
[1 4 7
2 5 8
3 6 9]
M[2,2] = 5 because it is in the second row and second column
analogy for 2D indexing
just like coordinates (x,y)
analogy for 3D indexing
row, column, page
what is the value of y[3], if y = [1,6,4,3,5,9,11]?
y[3] = 4, because it is in the third position
![<p>what is the value of Y[2,2,1], and how many dimensions does y have?</p>](https://assets.knowt.com/user-attachments/2ab7f070-8cfd-41f8-83fb-caa2c2845a70.jpg)
what is the value of Y[2,2,1], and how many dimensions does y have?
Y[2,2,1] = 4
Y has three dimensions because it is an array
what is the median?
the middle of a data set (has to be in order)
ex: y = [1,2,3,4,5,6,7,8,9]
median = 5
what is the mean?
the average of a data set
(represented by ȳ)
what does it mean if the mean and median are very close or the same?
the data set is likely proportionately dispersed
what is the mode?
the most common number in a data set
ex: y = [1,1,1,3,4,4,7]
mode = 1
what is the mean of the following set of numbers? y = [3,7,16,200,4]
46
what is the median of the following set of numbers? y = [3,7,16,200,4]
y = [3,4,7,16,200]
median = 7
what do the numbers represent in y ~ Normal(400,50)?
400 represents the mean
should be in the middle of the bell curve
50 represents the standard deviation
determines what the numbers go down/up by
ex: it would be 300, 350, 400, 450, 500
what are the percentages for bell curves?
68% between -1 and 1
95% between -2 and 2
99% between -3 and 3
what is an intercept?
what y equals when x=0
what does an intercept represent?
serves as the baseline or starting point of the regression line on the y-axis
what is the slope?
the amount the dependent variable will change if the covariate increases by 1 (rise over run)
the relationship between x and y on a graph
what is the equation for the lower confidence interval (LCI)?
slope - 2(standard error)
what is the equation for the upper confidence interval (UCI)?
slope + 2(standard error)
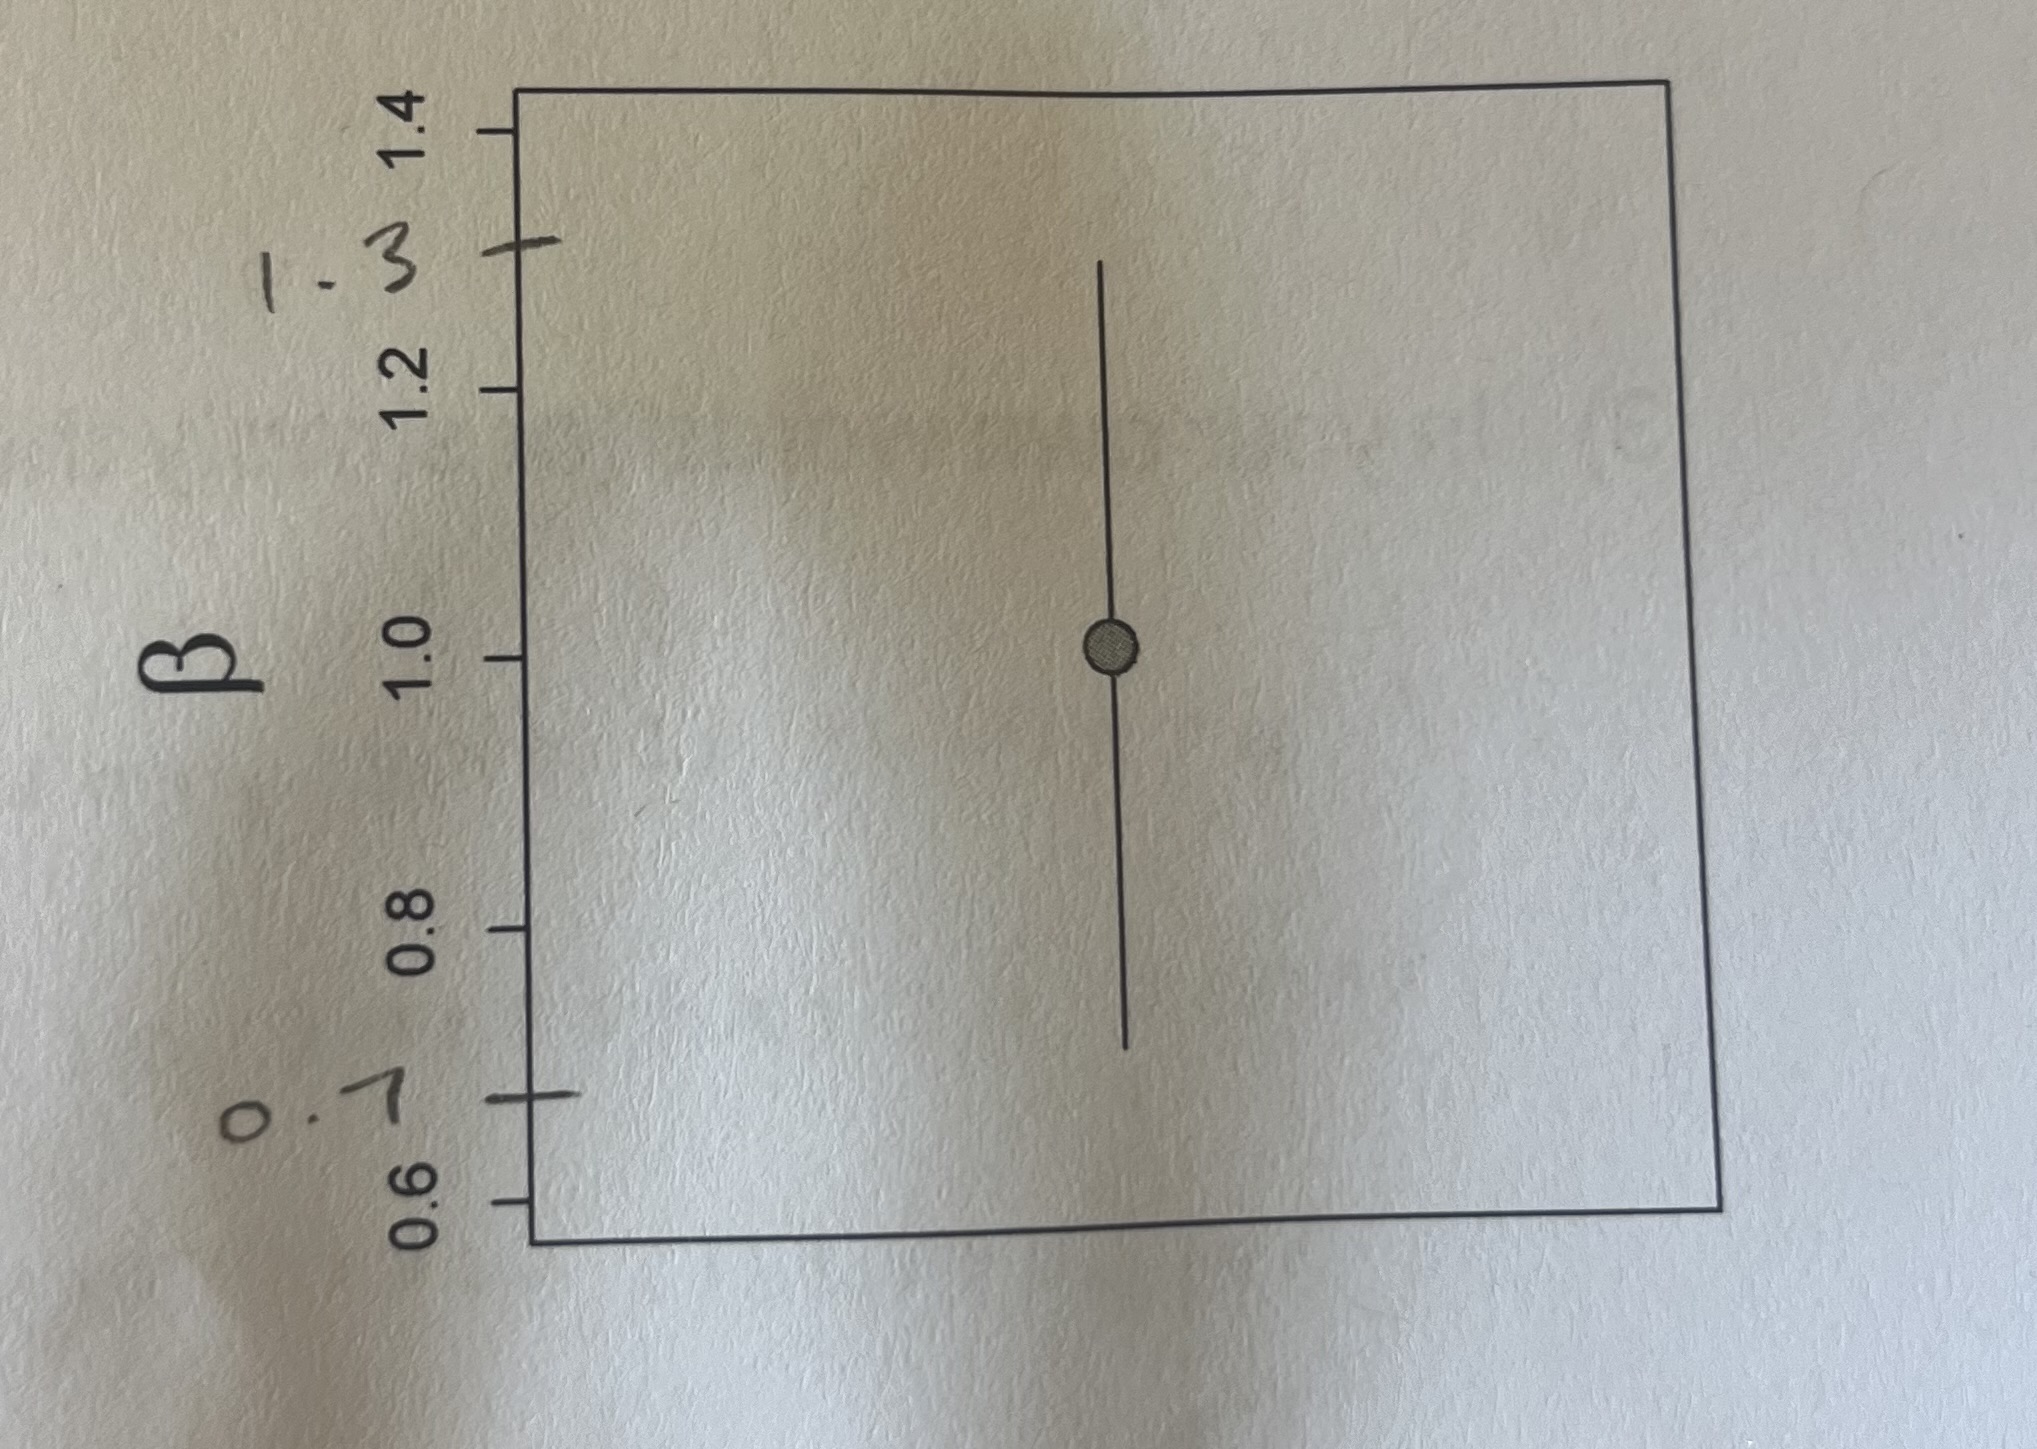
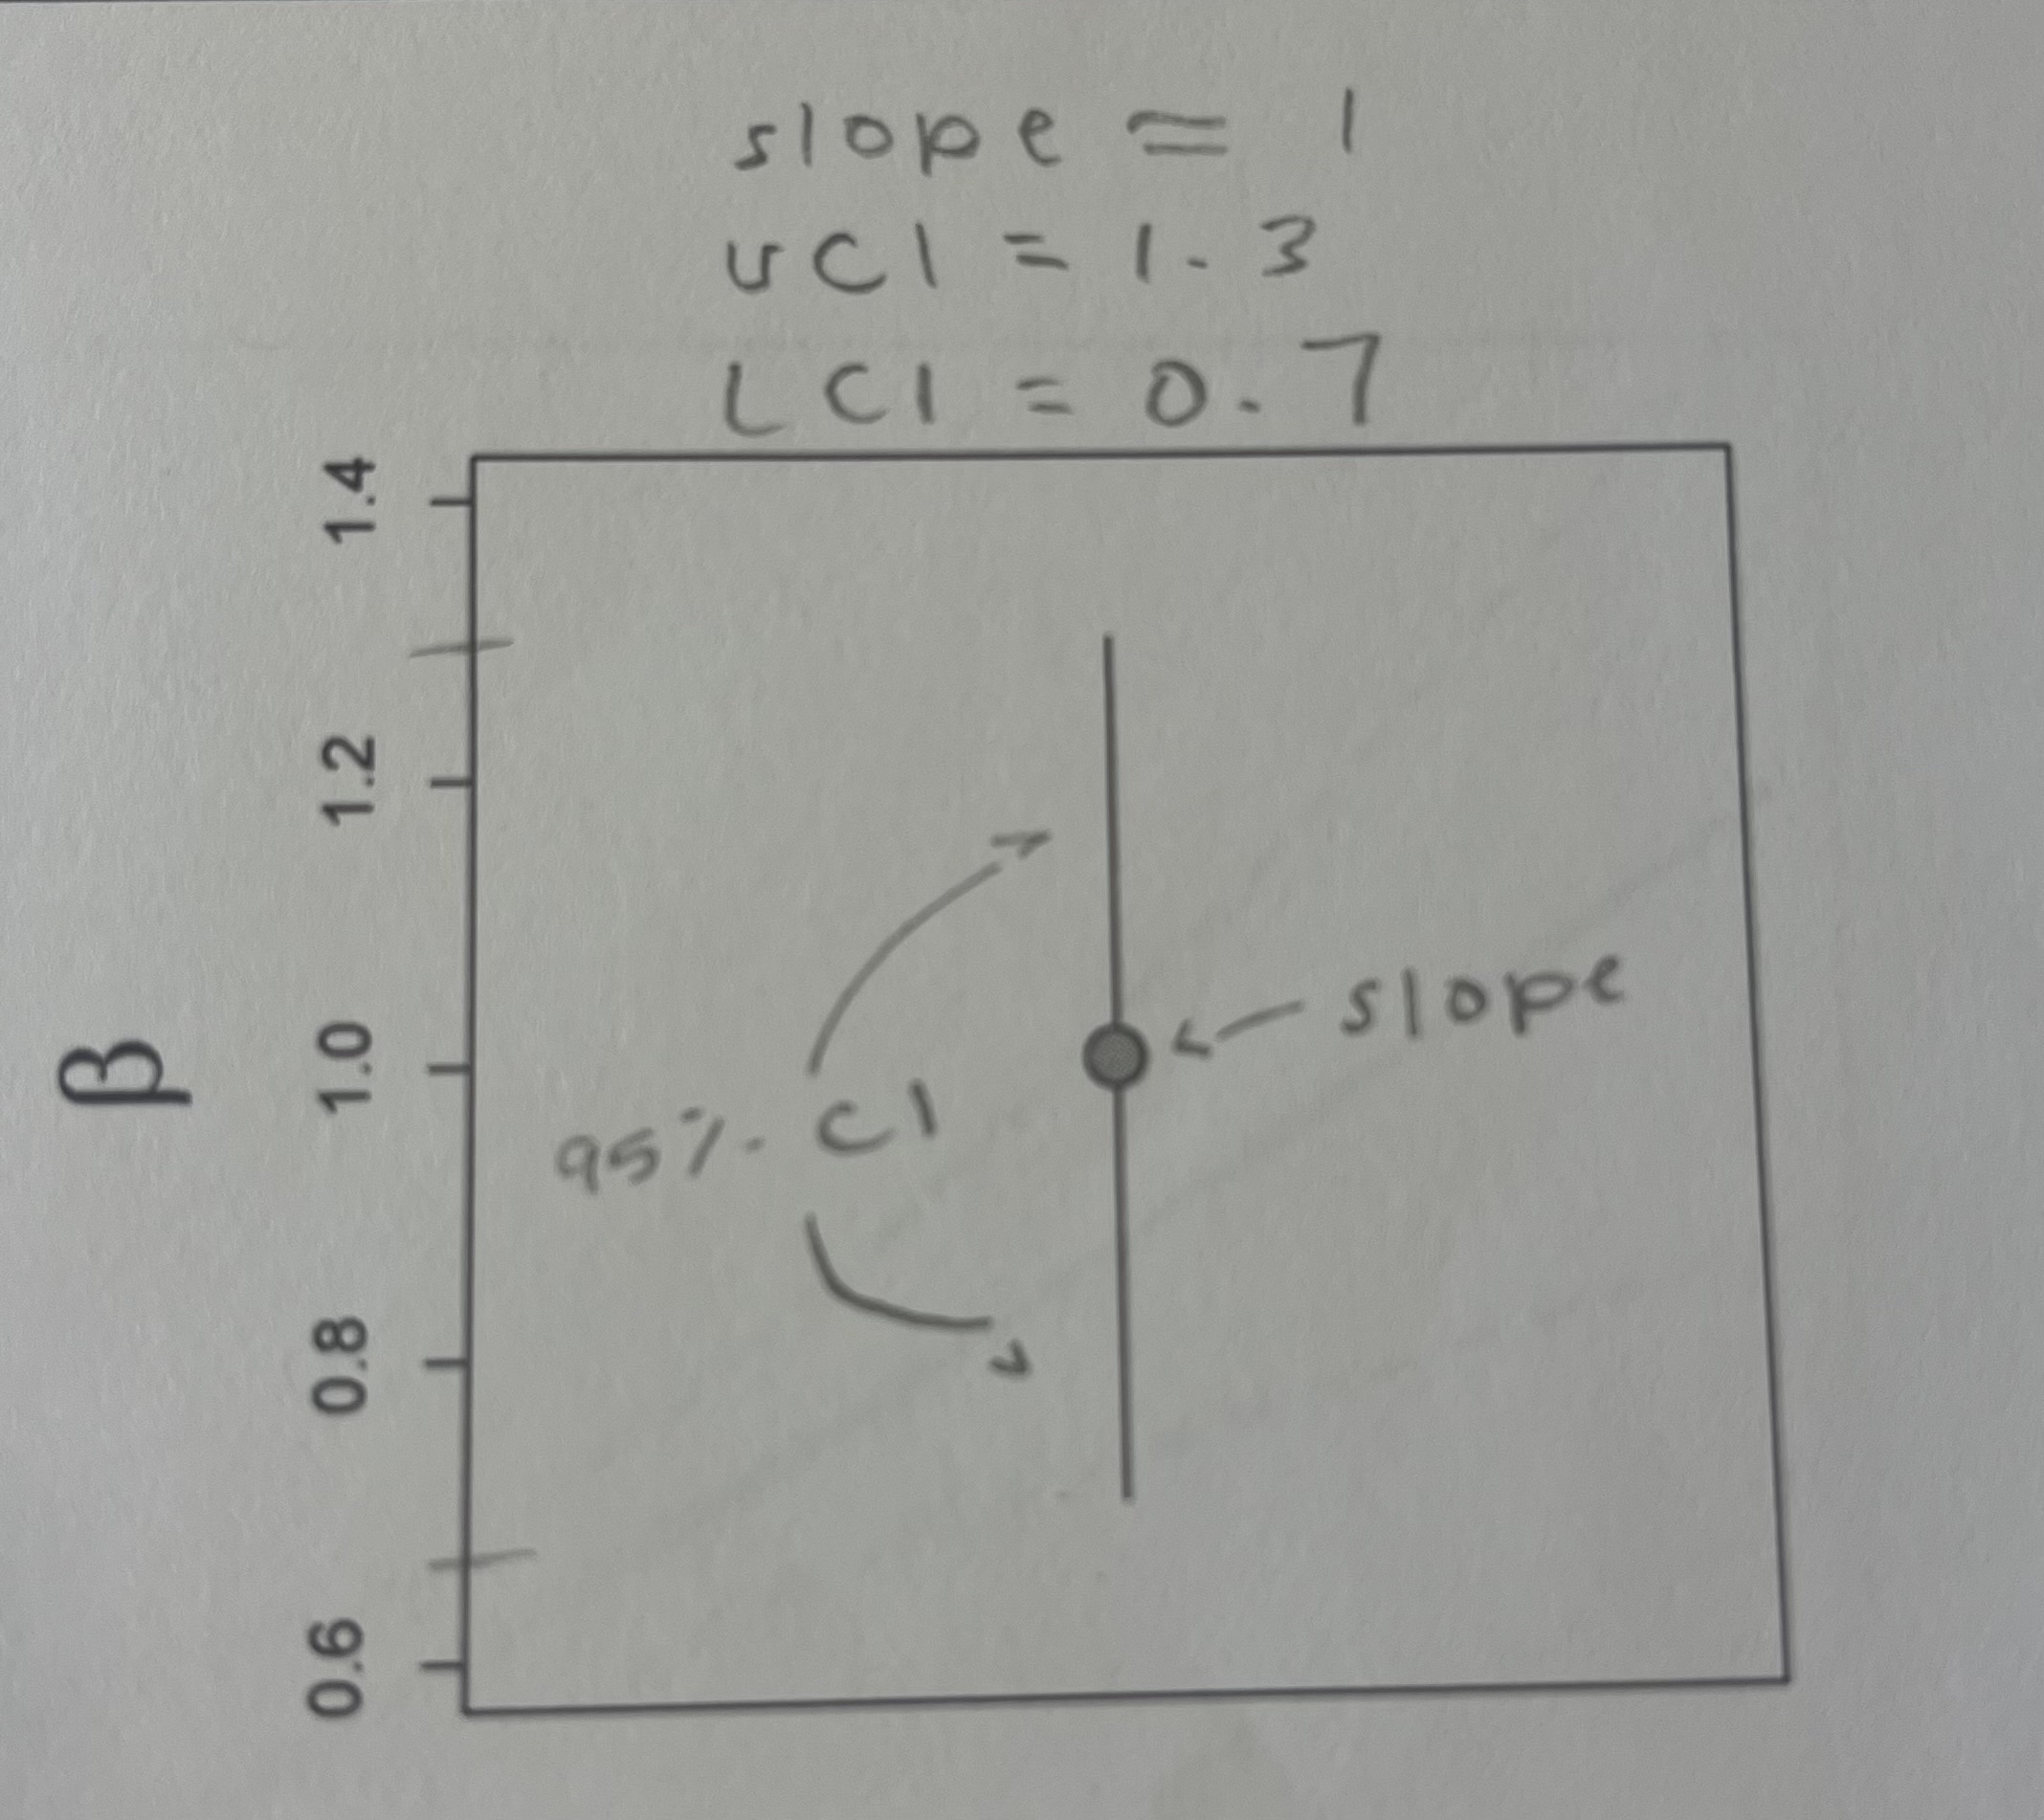
Here is an estimate of a beta parameter (i.e. a slope) with 95% confidence intervals. Is this a “significant” (p < 0.05) effect? Is the effect positive or negative?
This is a significant effect because zero is not included in the interval. It is also positive because the slope is above zero.
slope = 1
UCI = 1.3
LCI = 0.7
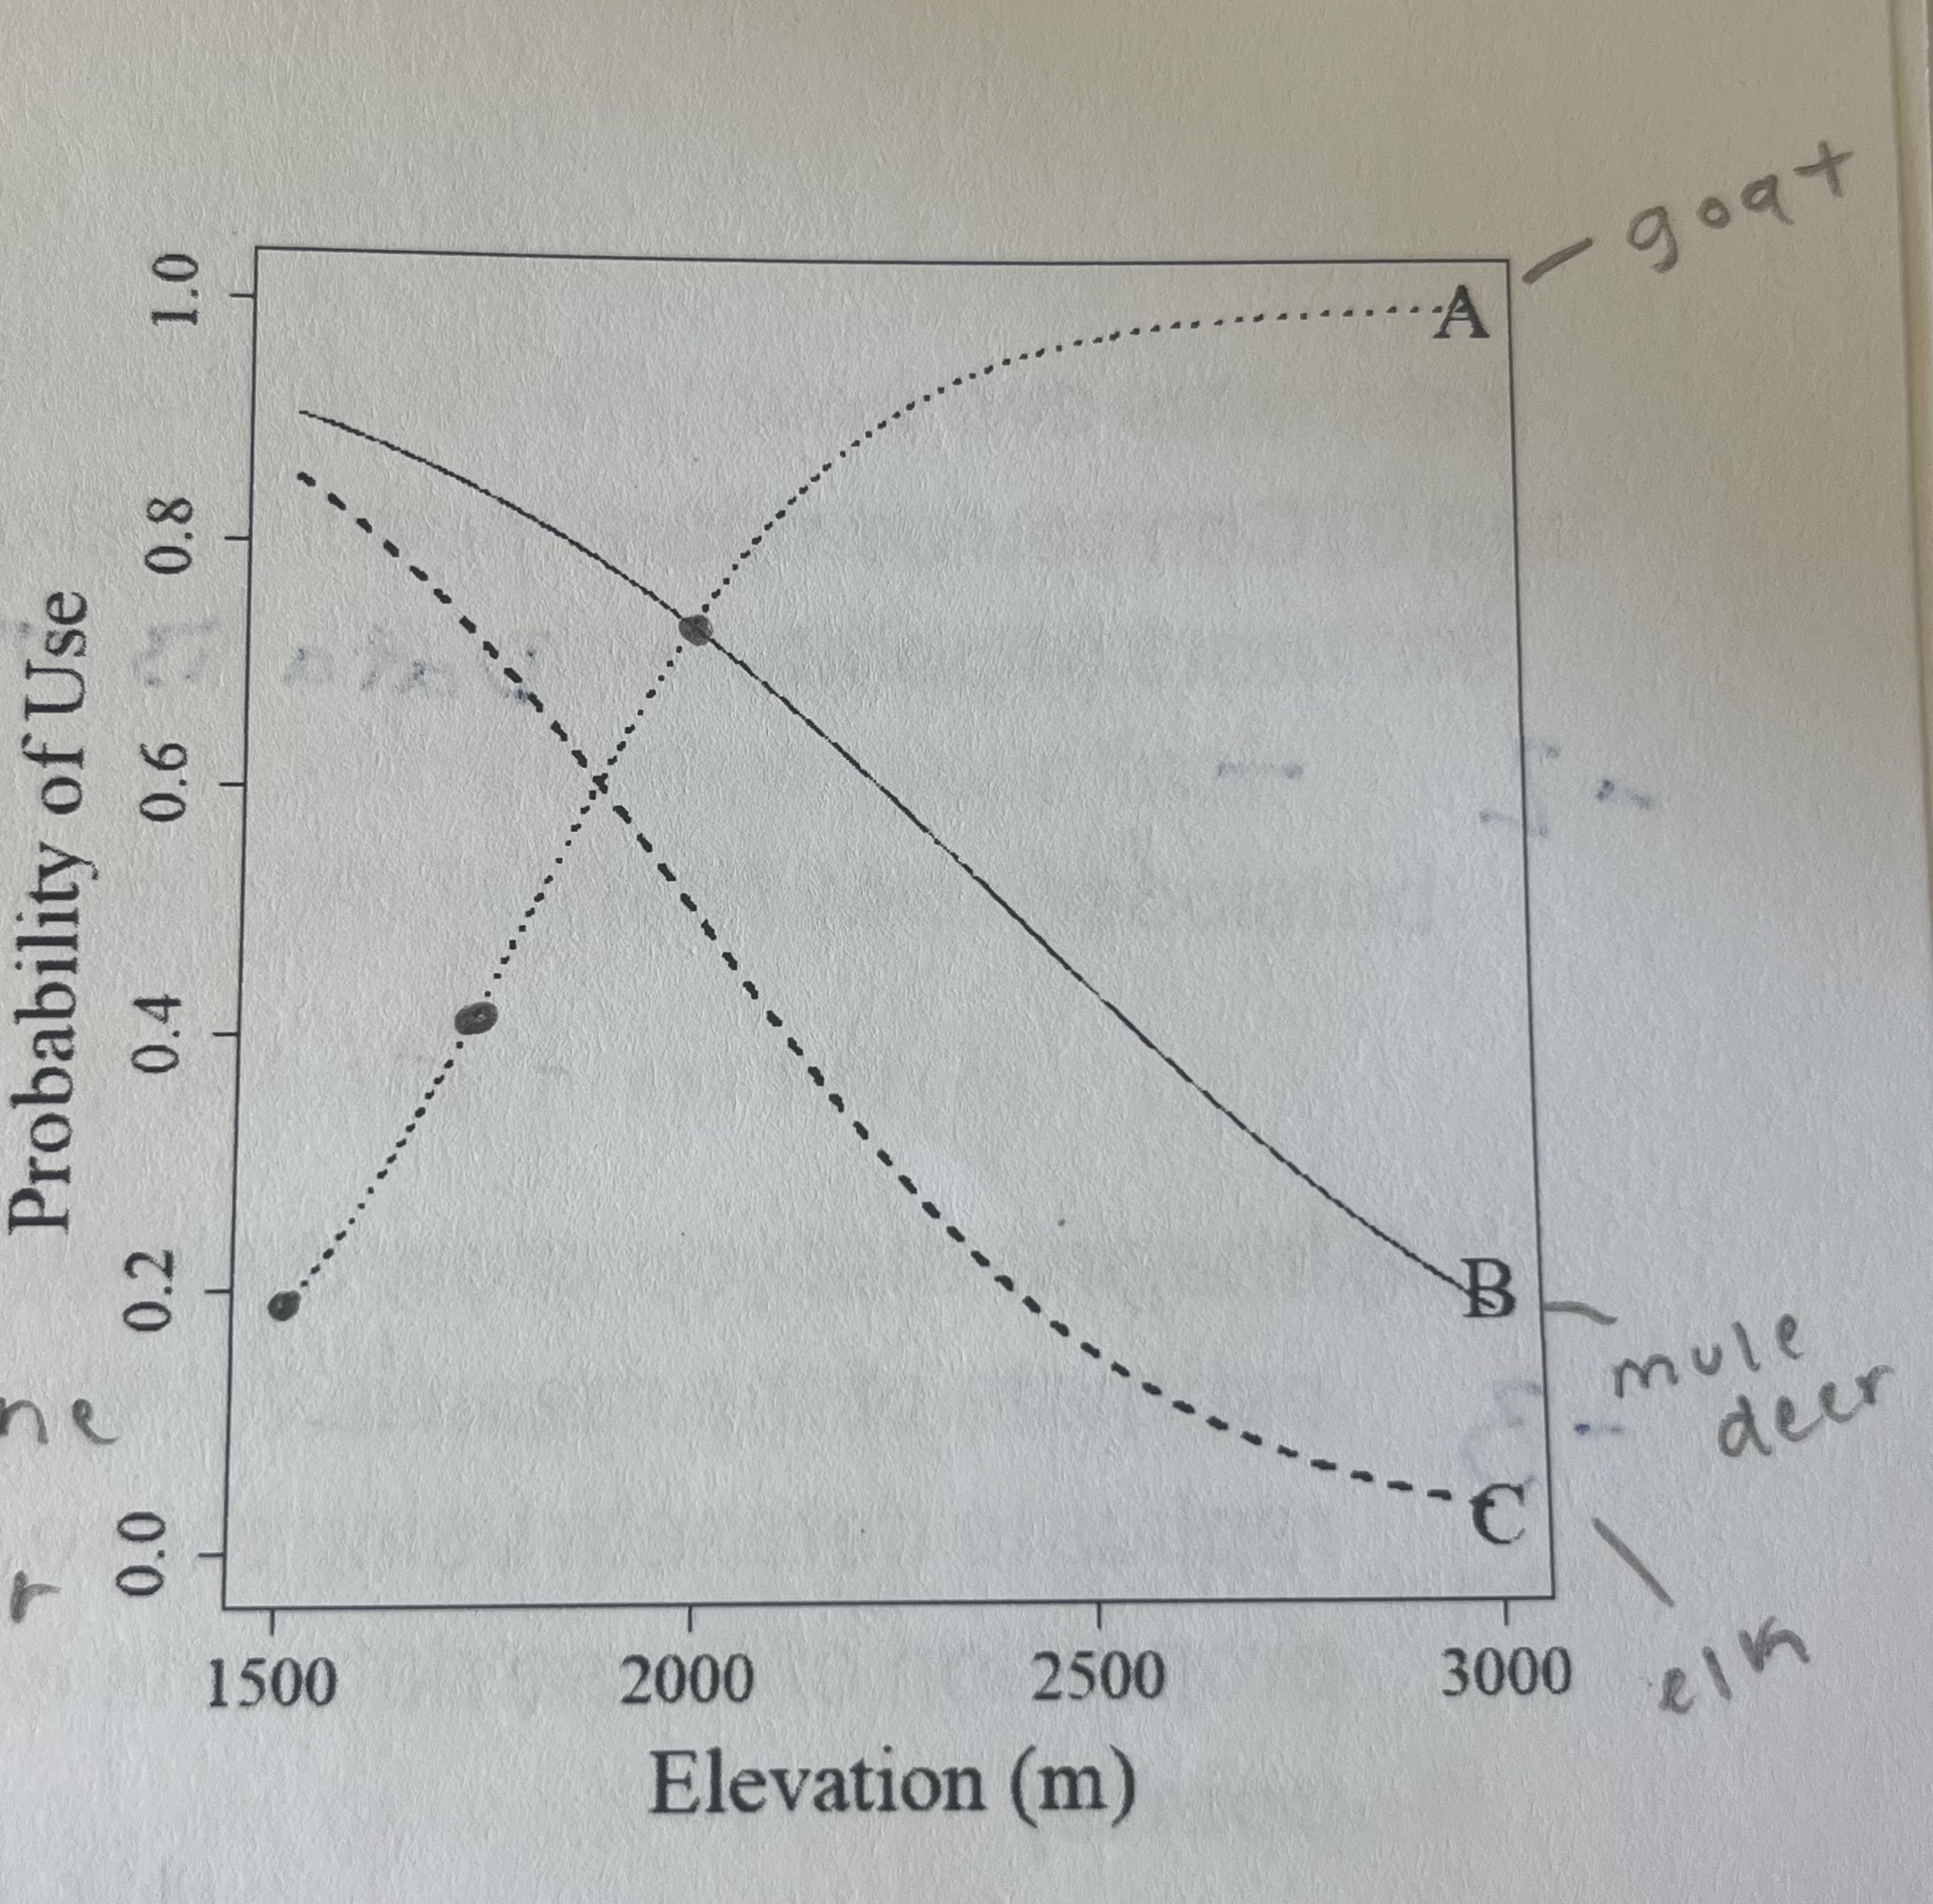
Researchers conducted a radio-telemetry study of three ungulate species in Banff National Park. They then compared environmental covariates at telemetry locations with random locations generated within an estimate of each individual's home range. They observed relationships between elevation and mule deer (B = -0.0025), elk (B = -0.0035), and mountain goat (B = 0.005) winter habitat selection. Which line on the inset figure of the probability of use was mule deer? Which was elk? Which was mountain goat?
A = mountain goat because it is the only positive line
B = mule deer because the slope is more positive than C
C = elk because the slope is more negative than B

Imagine that you are conducting a camera trap study of bears. Previous work has allowed you to estimate that the expected number of bears you will photograph is 2.6. If y (the outcome) is drawn from a Poisson distribution with a rate of 2.6, what is the approximate probability of observing four bears at your camera trap?
The probability of observing 4 bears with a rate of 2.6 would approximately be 0.15.
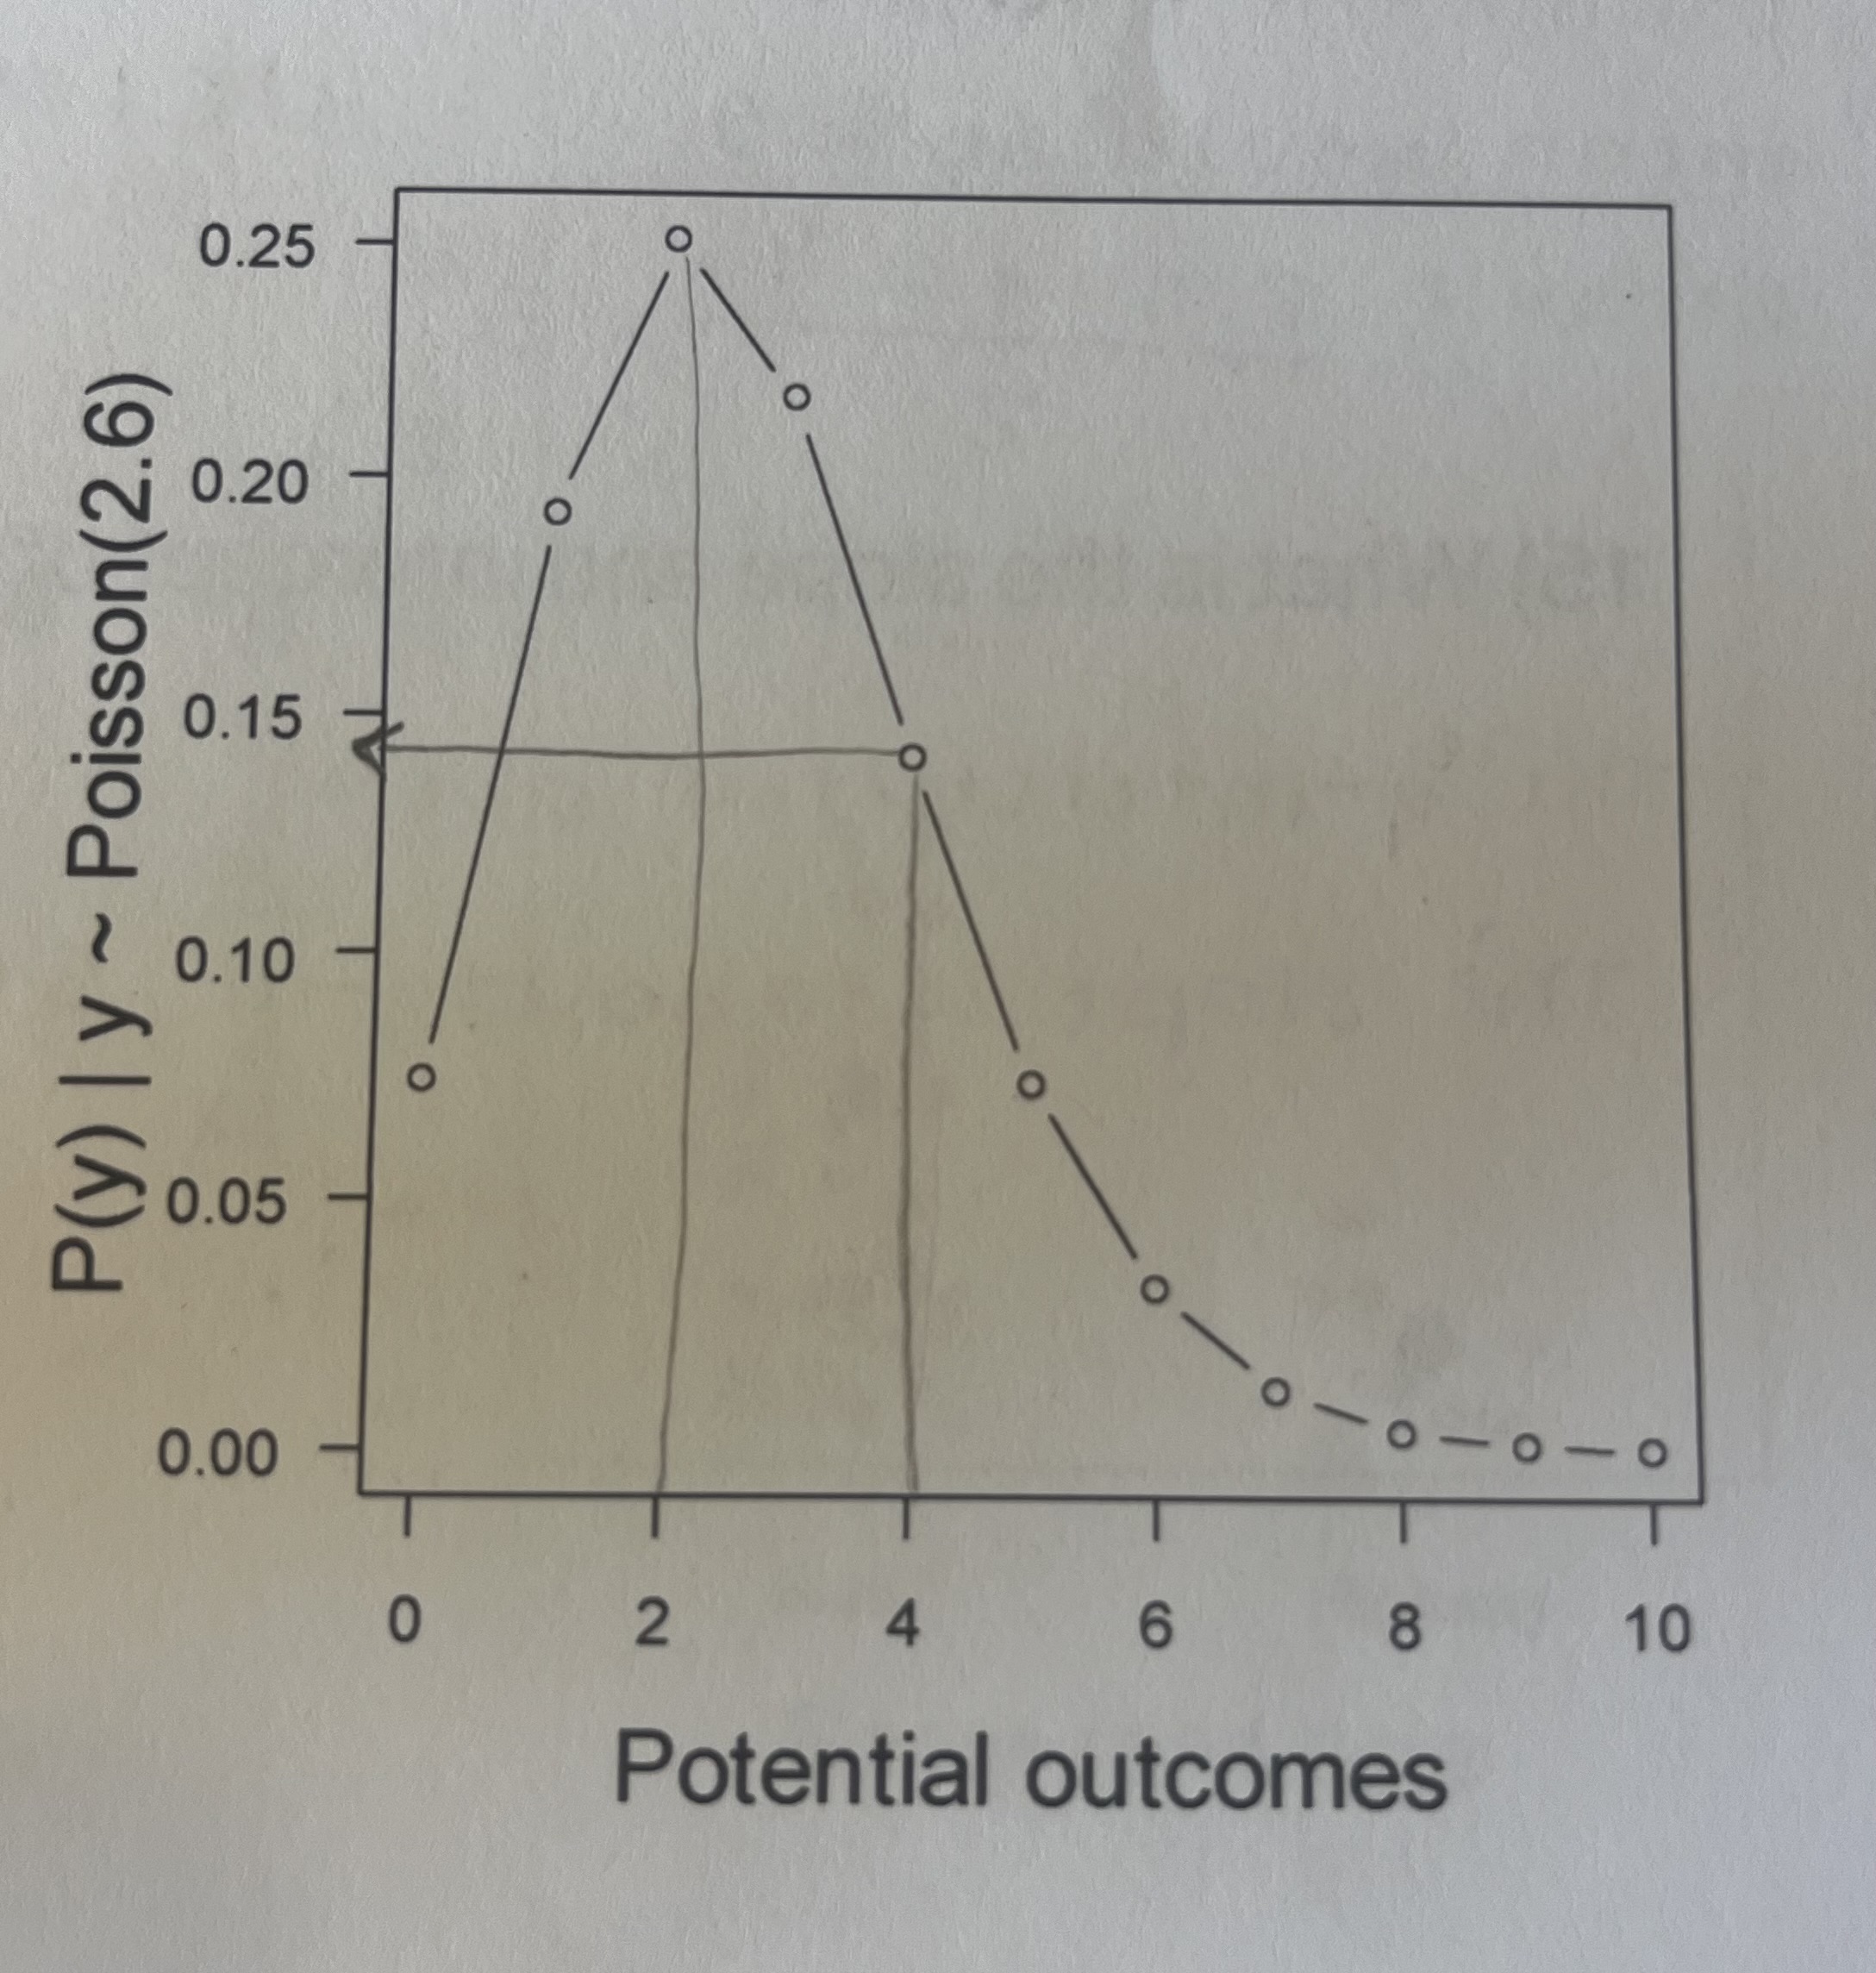
what is the most likely number of bears that will be photographed?
2
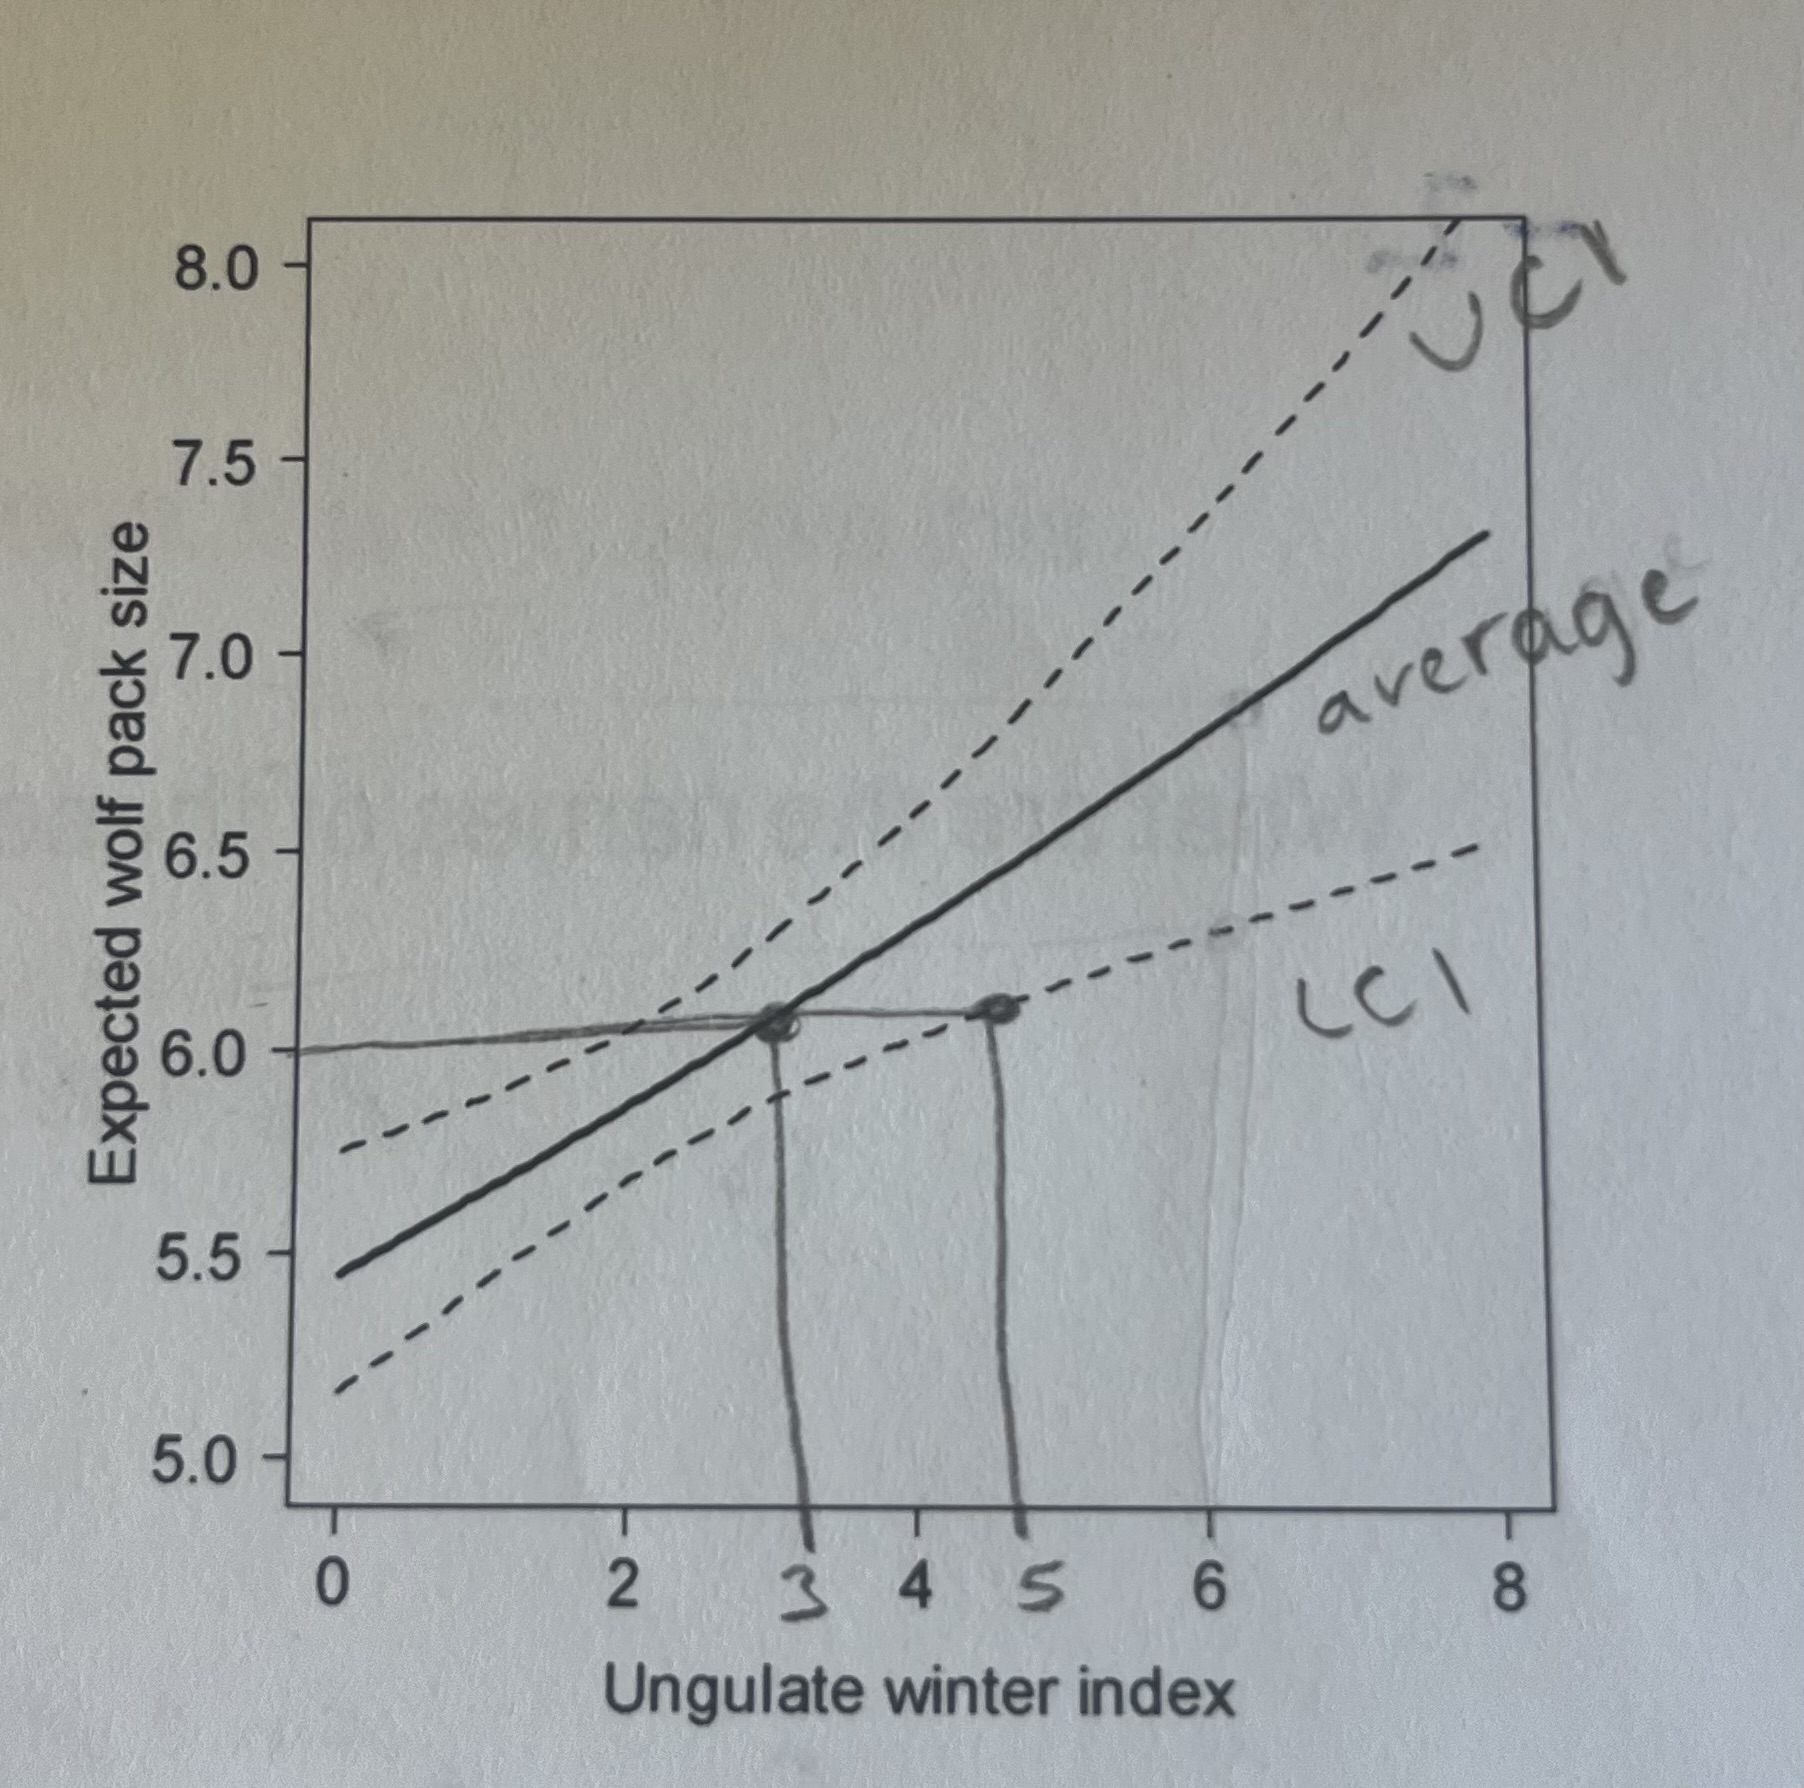
Imagine that you have used a Poison glm to estimate the relationship between wolf pack size and winter ungulate abundance (right). At what value of winter ungulate abundance would you expect average wolf pack size to equal 6. At what value of winter ungulate abundance would you expect average wolf pack size to be significantly greater than 6?
average wolf pack size to equal 6 is 3
average wolf pack size to be significantly greater than 6 is 5
Can you compare model log-likelihoods between or among two or more different datasets? Why or why not?
No, log-likelihoods cannot be compared across different datasets because they are calculated based on the specific data used. They are only meaningful when comparing models fit to the same dataset.
Imagine that you know the mean of a distribution is 5. You also know that the standard error of the estimate of the mean is 1. What are the approximate 95% confidence intervals? If you simulated 1000 replicate datasets using those parameter values and calculated the mean for each new dataset/what proportion of those datasets would you expect to have a mean within the 95% confidence intervals?
LCI = 5 - 2(1) = 3
UCI = 5 + 2(1) = 7
If 1000 datasets were simulated, about 95% of them would have means within this interval.
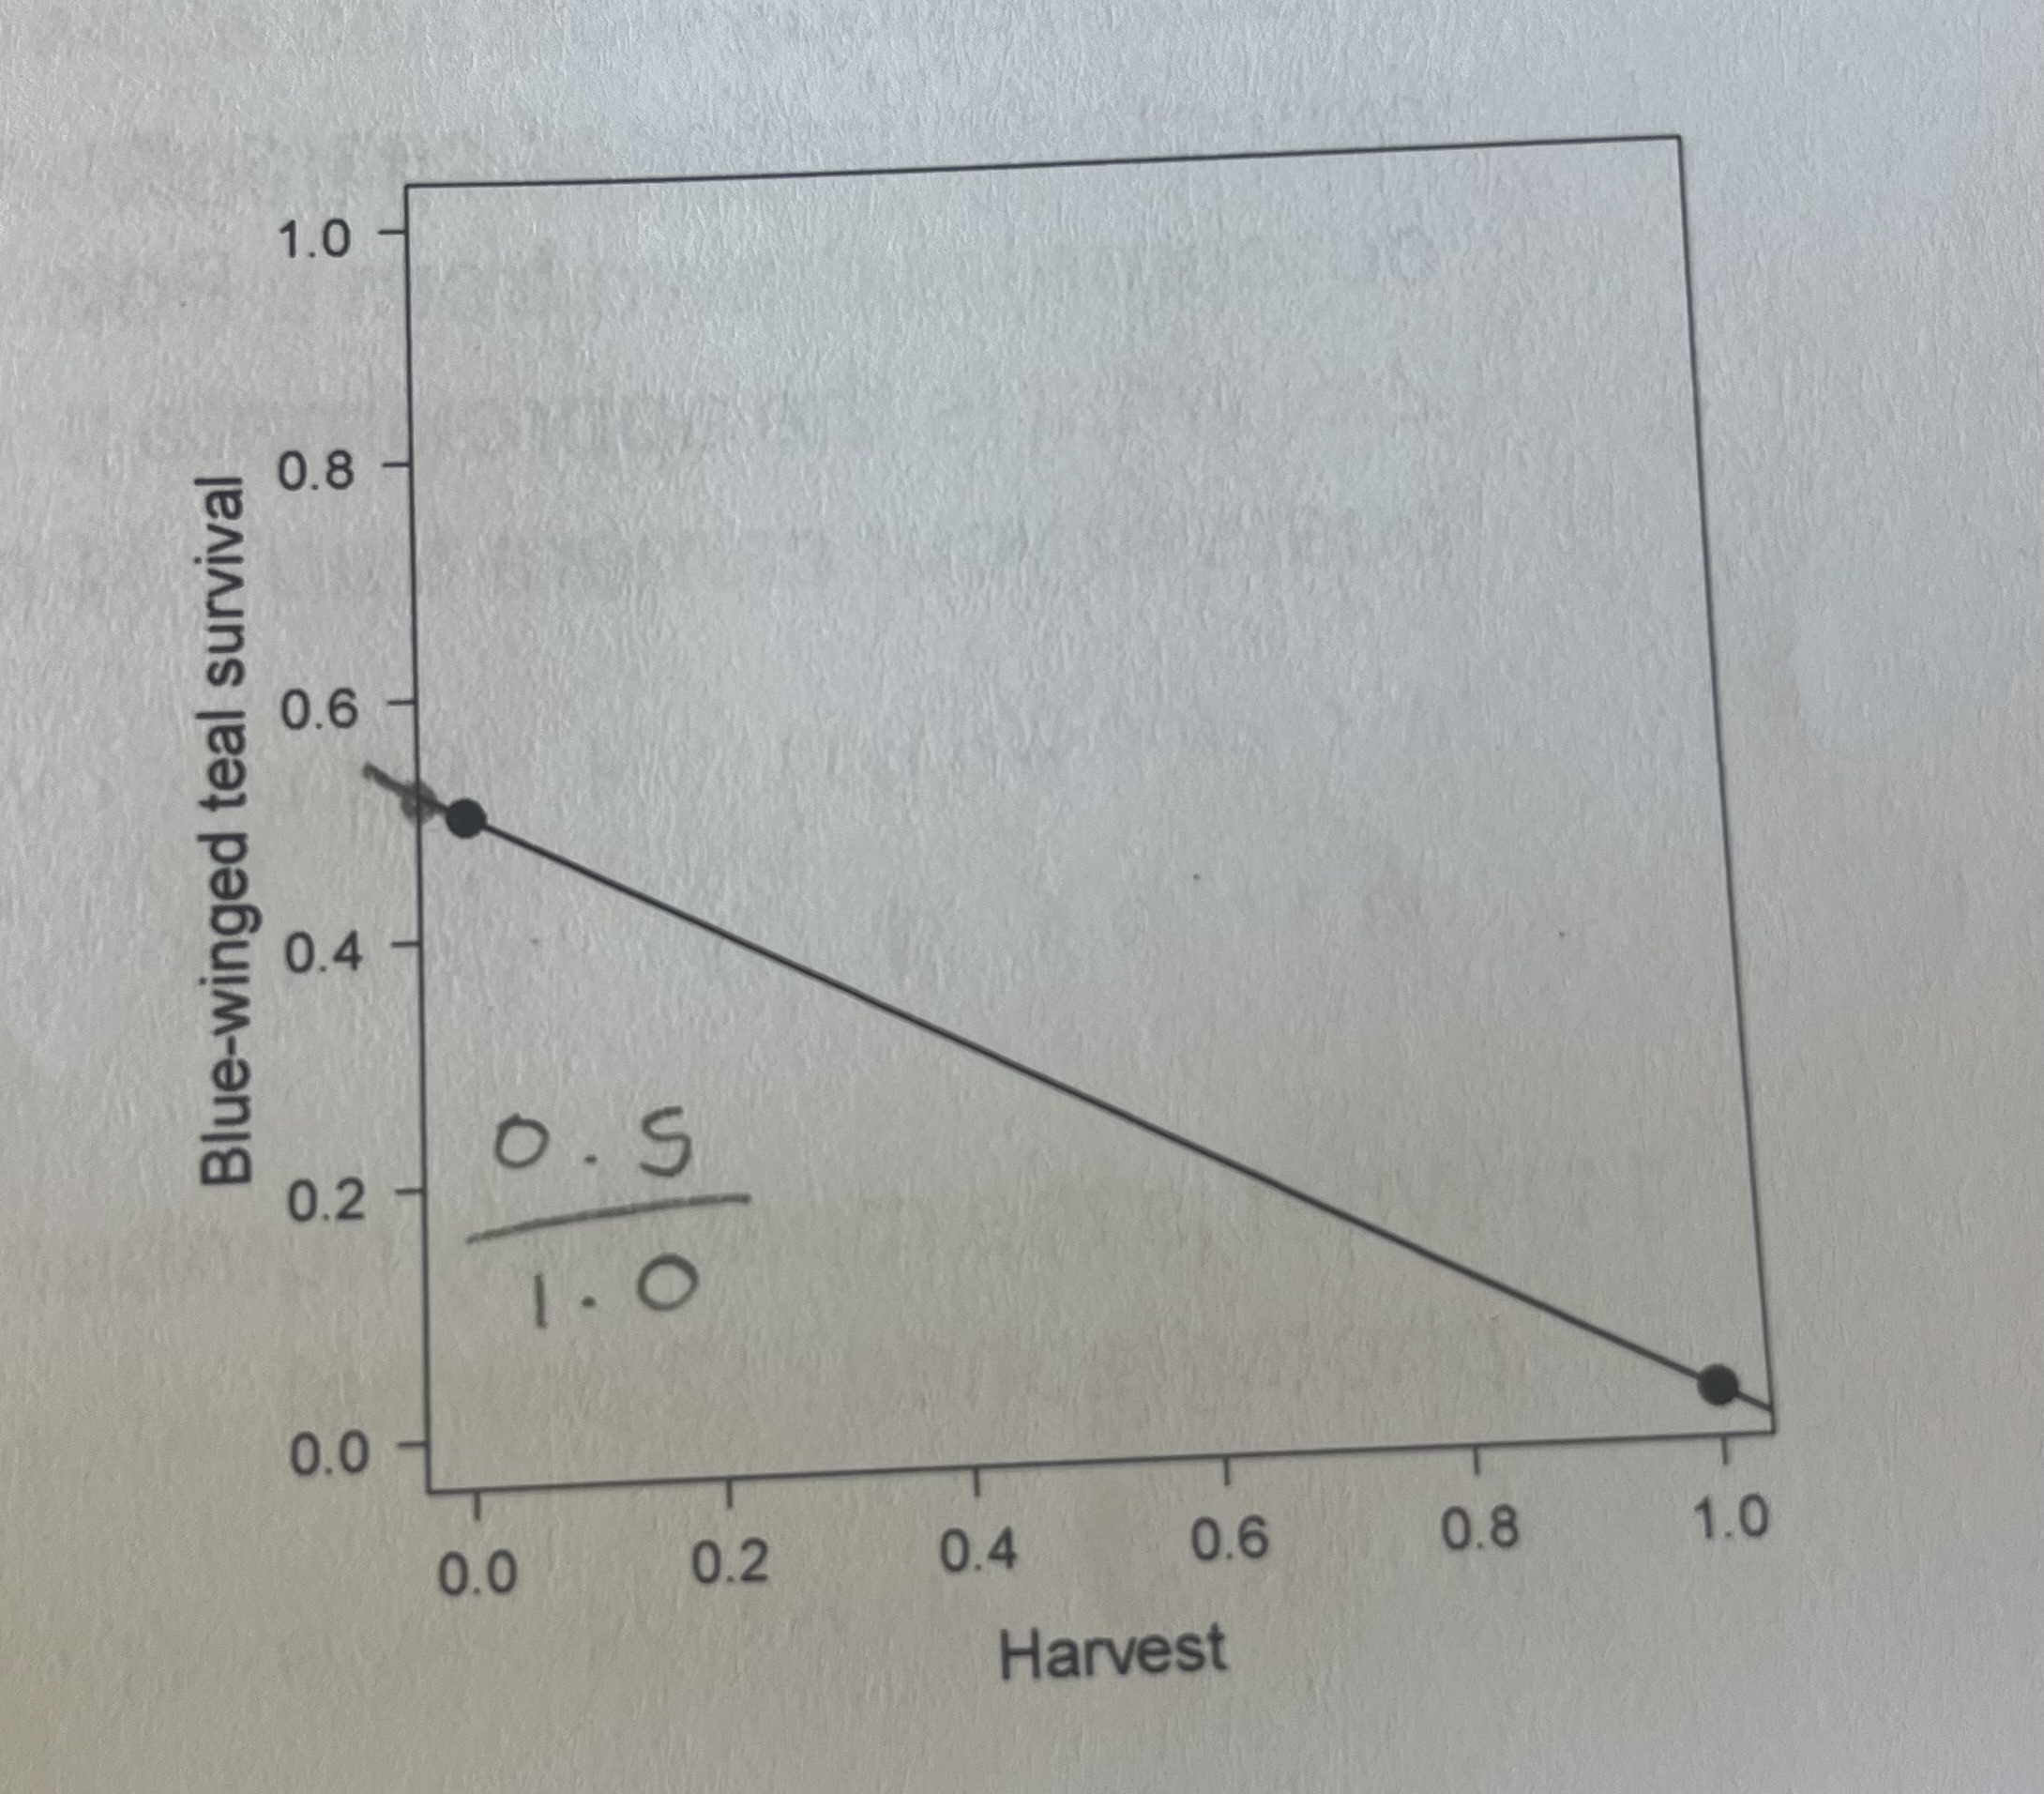
what is the slope and intercept of this line?
y-intercept = 0.5
slope = -0.5 → (0.5/1)
need 16
what does a low standard error signify?
a sample mean is a precise and reliable estimate of the true population mean, signifying that sample data is tightly clustered rather than widely spread
what does a high(er) standard error signify?
sample means are widely spread around the true population mean, indicating lower precision and that the sample is less representative of the population → increases uncertainty
does a smaller sample size mean more or less uncertainty?
more uncertainty
does a bigger sample size mean more or less uncertainty?
less uncertainty
Imagine that you are fairly confident that there are 100 wolf packs in Montana. You have two estimates of mean pack size. The first has a mean of 5 and a standard error of 0.1. The second has a mean of 6 and a standard error of 1. The total number of wolves in packs is a function of the number of packs and the number of wolves in each pack. What impact would the use of either estimate have on your final estimate of the total number of wolves in Montana in terms of the total number itself and associated uncertainty?
The estimate with mean 5 and SE 0.1 would result in a lower total estimate (~500 wolves) with low uncertainty.
The estimate with mean 6 and SE 1 would result in a higher total (~600 wolves) but with much greater uncertainty.
Thus, the second estimate produces a less precise estimate of total population size.
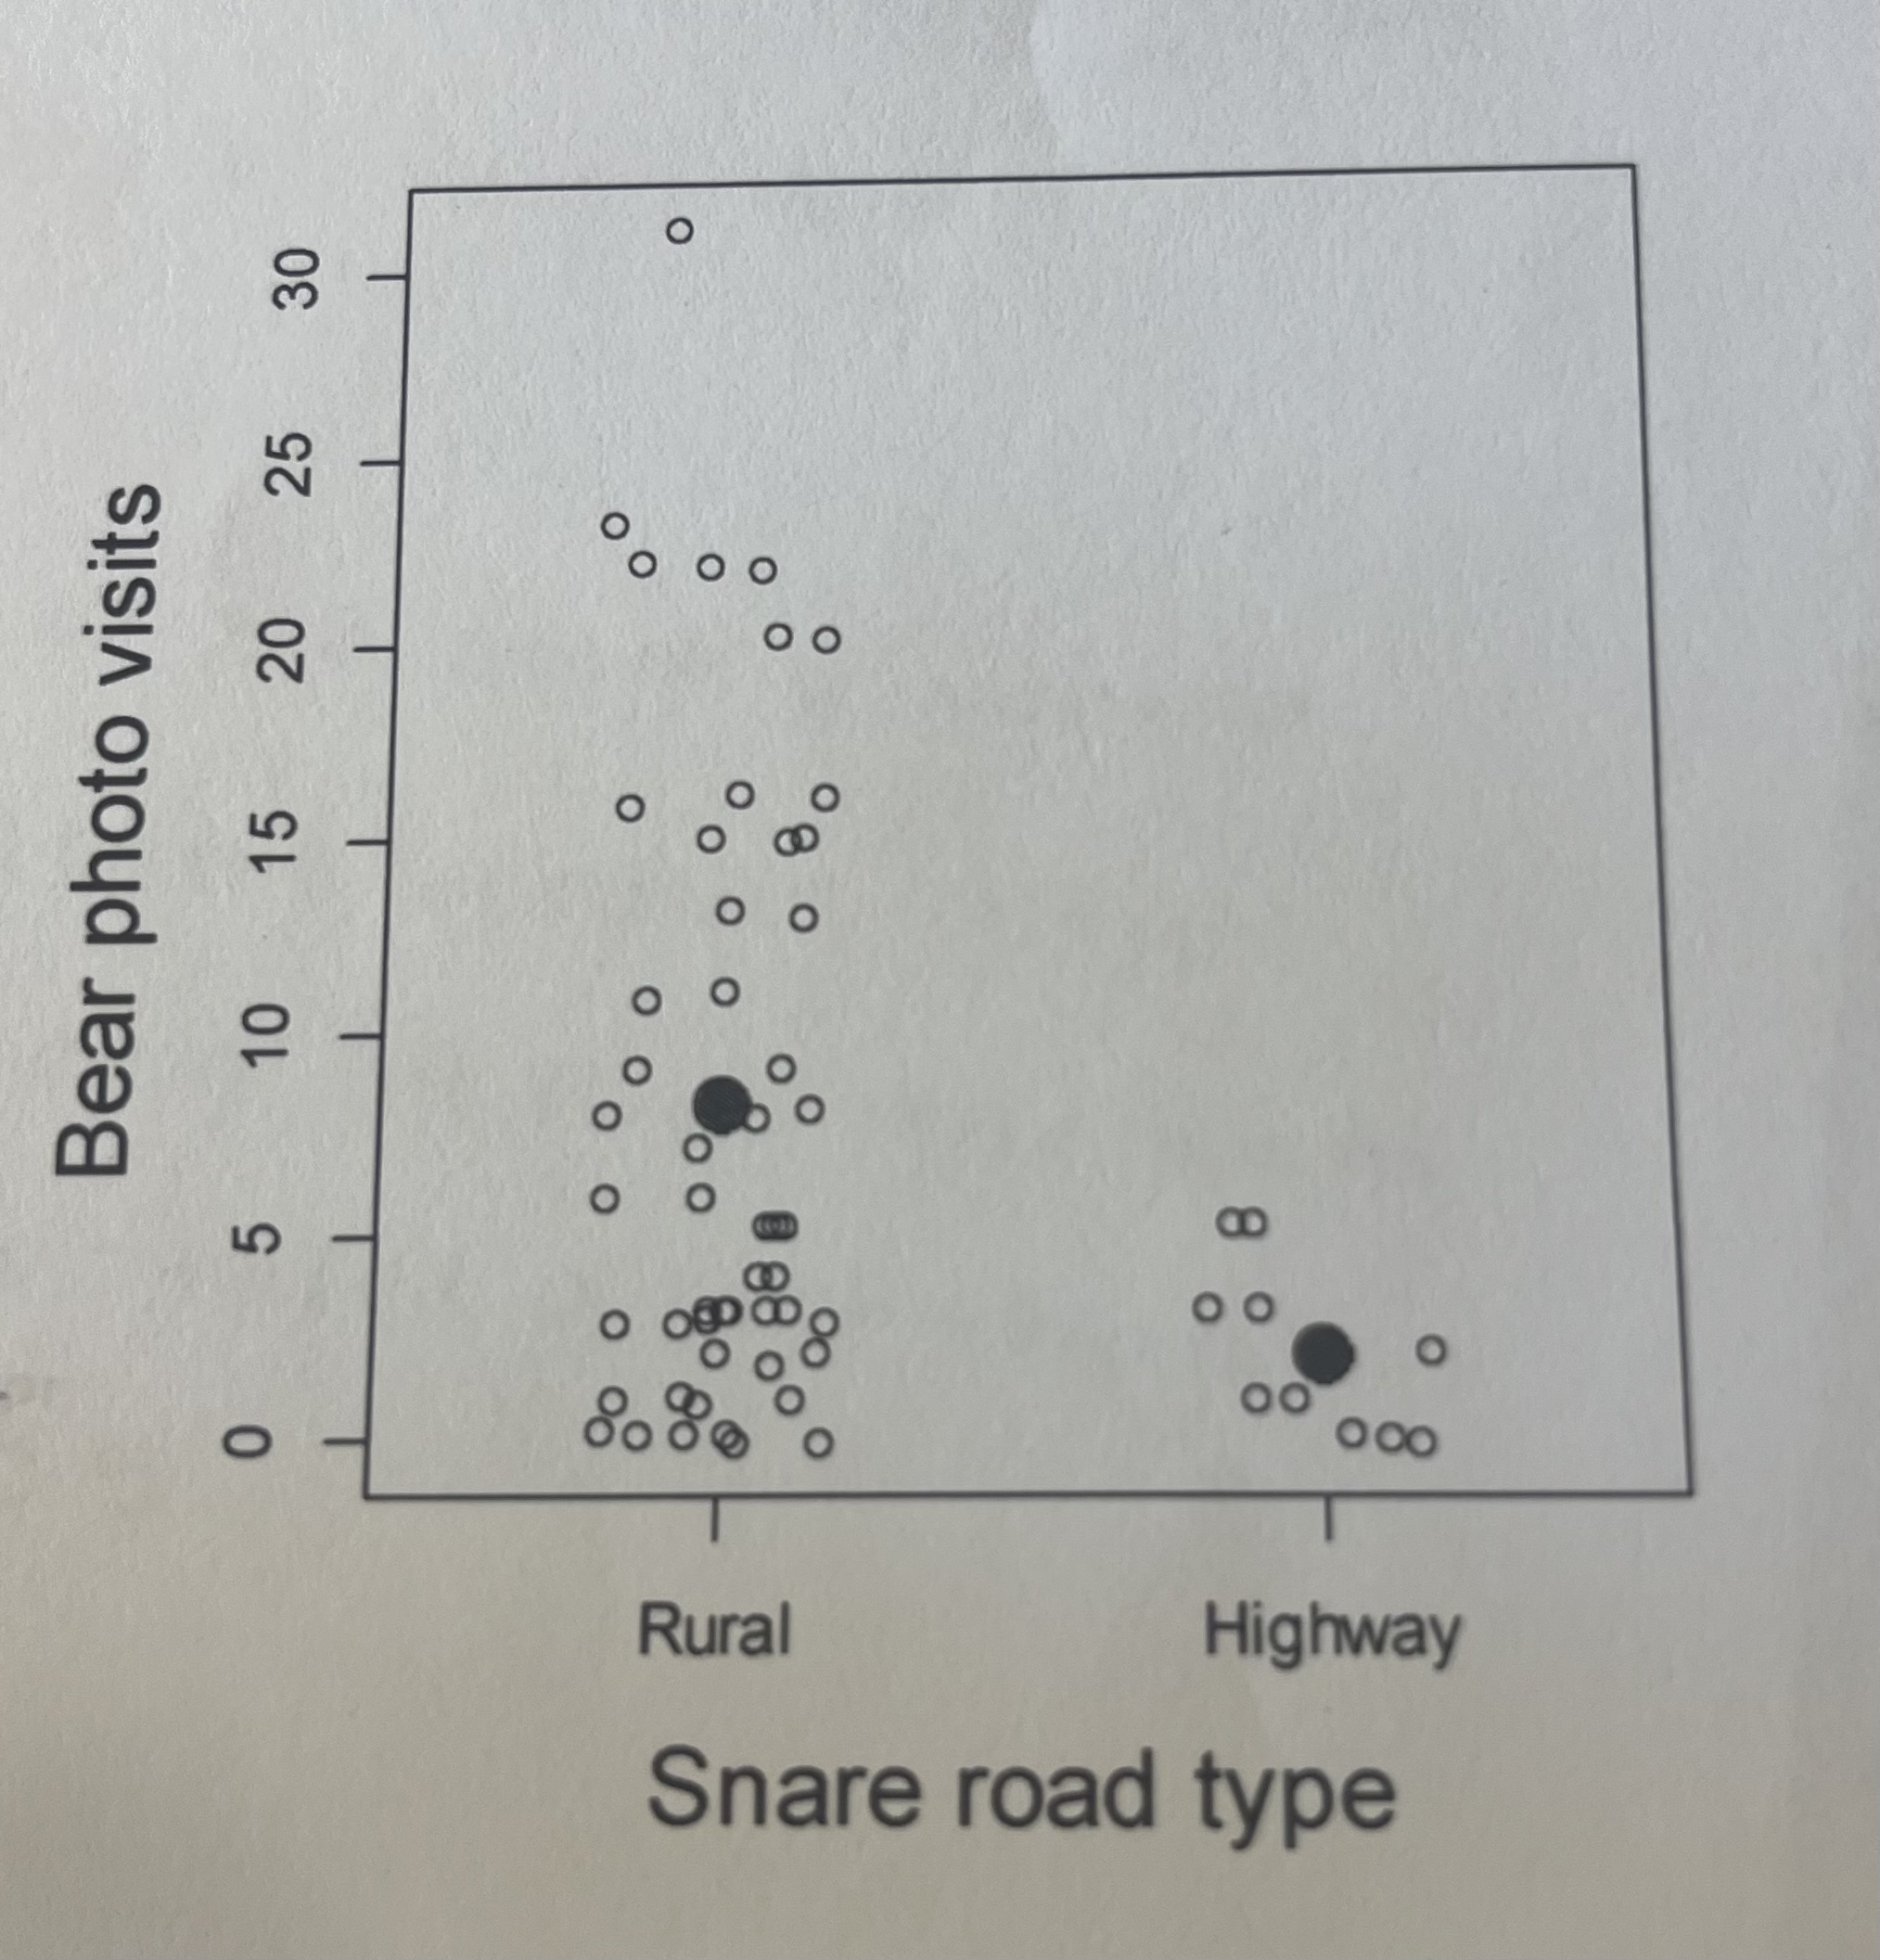
Imagine that you've estimated the intercept (B0 = 2.09) and slope (B1 = -1.4) on the log scale from a generalized linear model. In your own words, given the figure to the right (where the solid points are plotted as a function of these two parameters), what does the intercept represent? What does the slope represent?
The intercept represents the expected number of bear visits at rural sites (the reference group), expressed on the log scale.
The slope represents the change in bear visits from rural to highway sites, with the negative value indicating that highway sites have fewer visits.
This equation, yi x ln(ui), is part of the Poisson log-likelihood function. If ui = 1, solve this component of the equation.
ln(1) = 0, so y x 0 would equal zero.
Why would the mean and median of a vector (i.e., set or group) of numbers be substantially different? Give a quick real-life example.
outliers often affect the mean more than the median (making it bigger or smaller depending on the situation)
ex: If there was a statistical analysis of average incomes in the US, the billionaires could make the mean seem a lot higher than it actually is. The median would likely be a much lower number, possibly more accurate as well.
if the data is skewed, the mean could be very different from the median
what is the general rule for telling if t-statistics are significant or not?
it is significant if the t-statistic is less than -2 or greater than 2

Here is a plot of a t-distribution (df = 97). Approximately 95% of this distribution is between -1.985 and 1.985, and 99% of the distribution is between -2.627 and 2.627. Would a t-value of -2 result in a significant (p < 0.05) result?
Yes, this would be significant (p < 0.05) because -2 falls outside the 95% range.
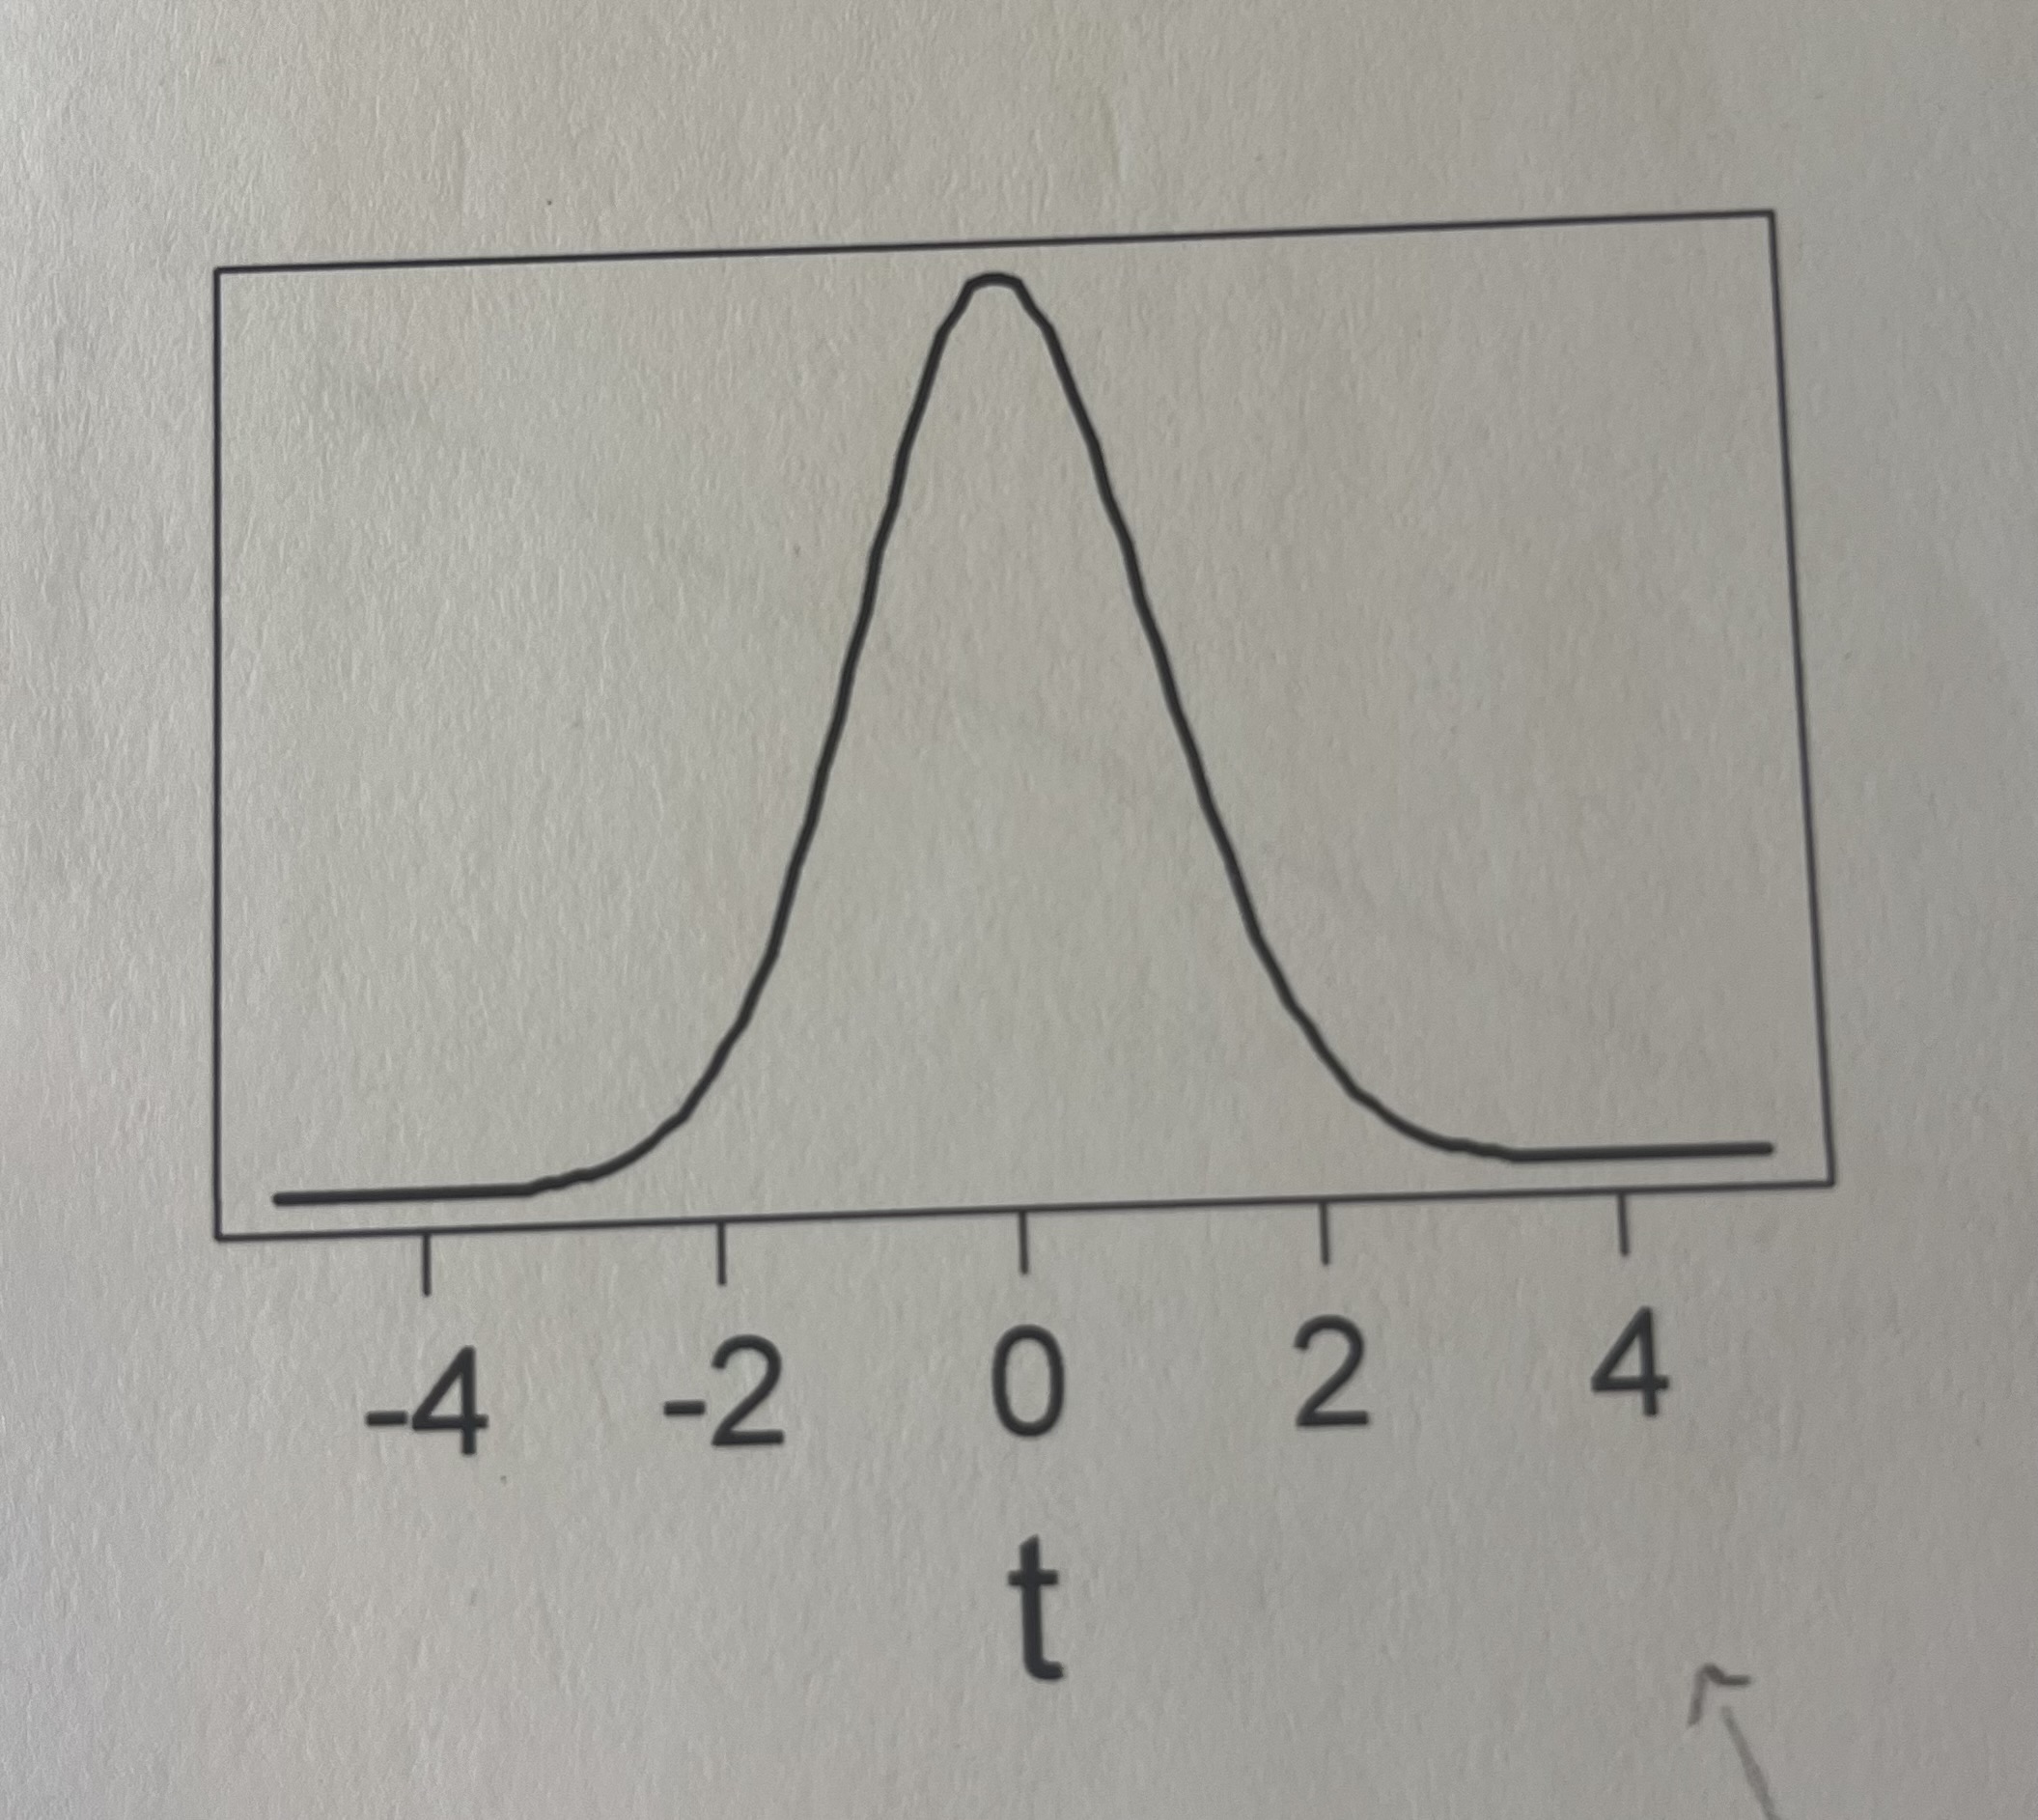
Here is a plot of a t-distribution (df = 97). Approximately 95% of this distribution is between -1.985 and 1.985, and 99% of the distribution is between -2.627 and 2.627. Would a t-value of -1.5 result in a significant (p < 0.05) result?
No, this is not significant because -1.5 falls within the 95% range.
what would the p-value be if t = 0?
1
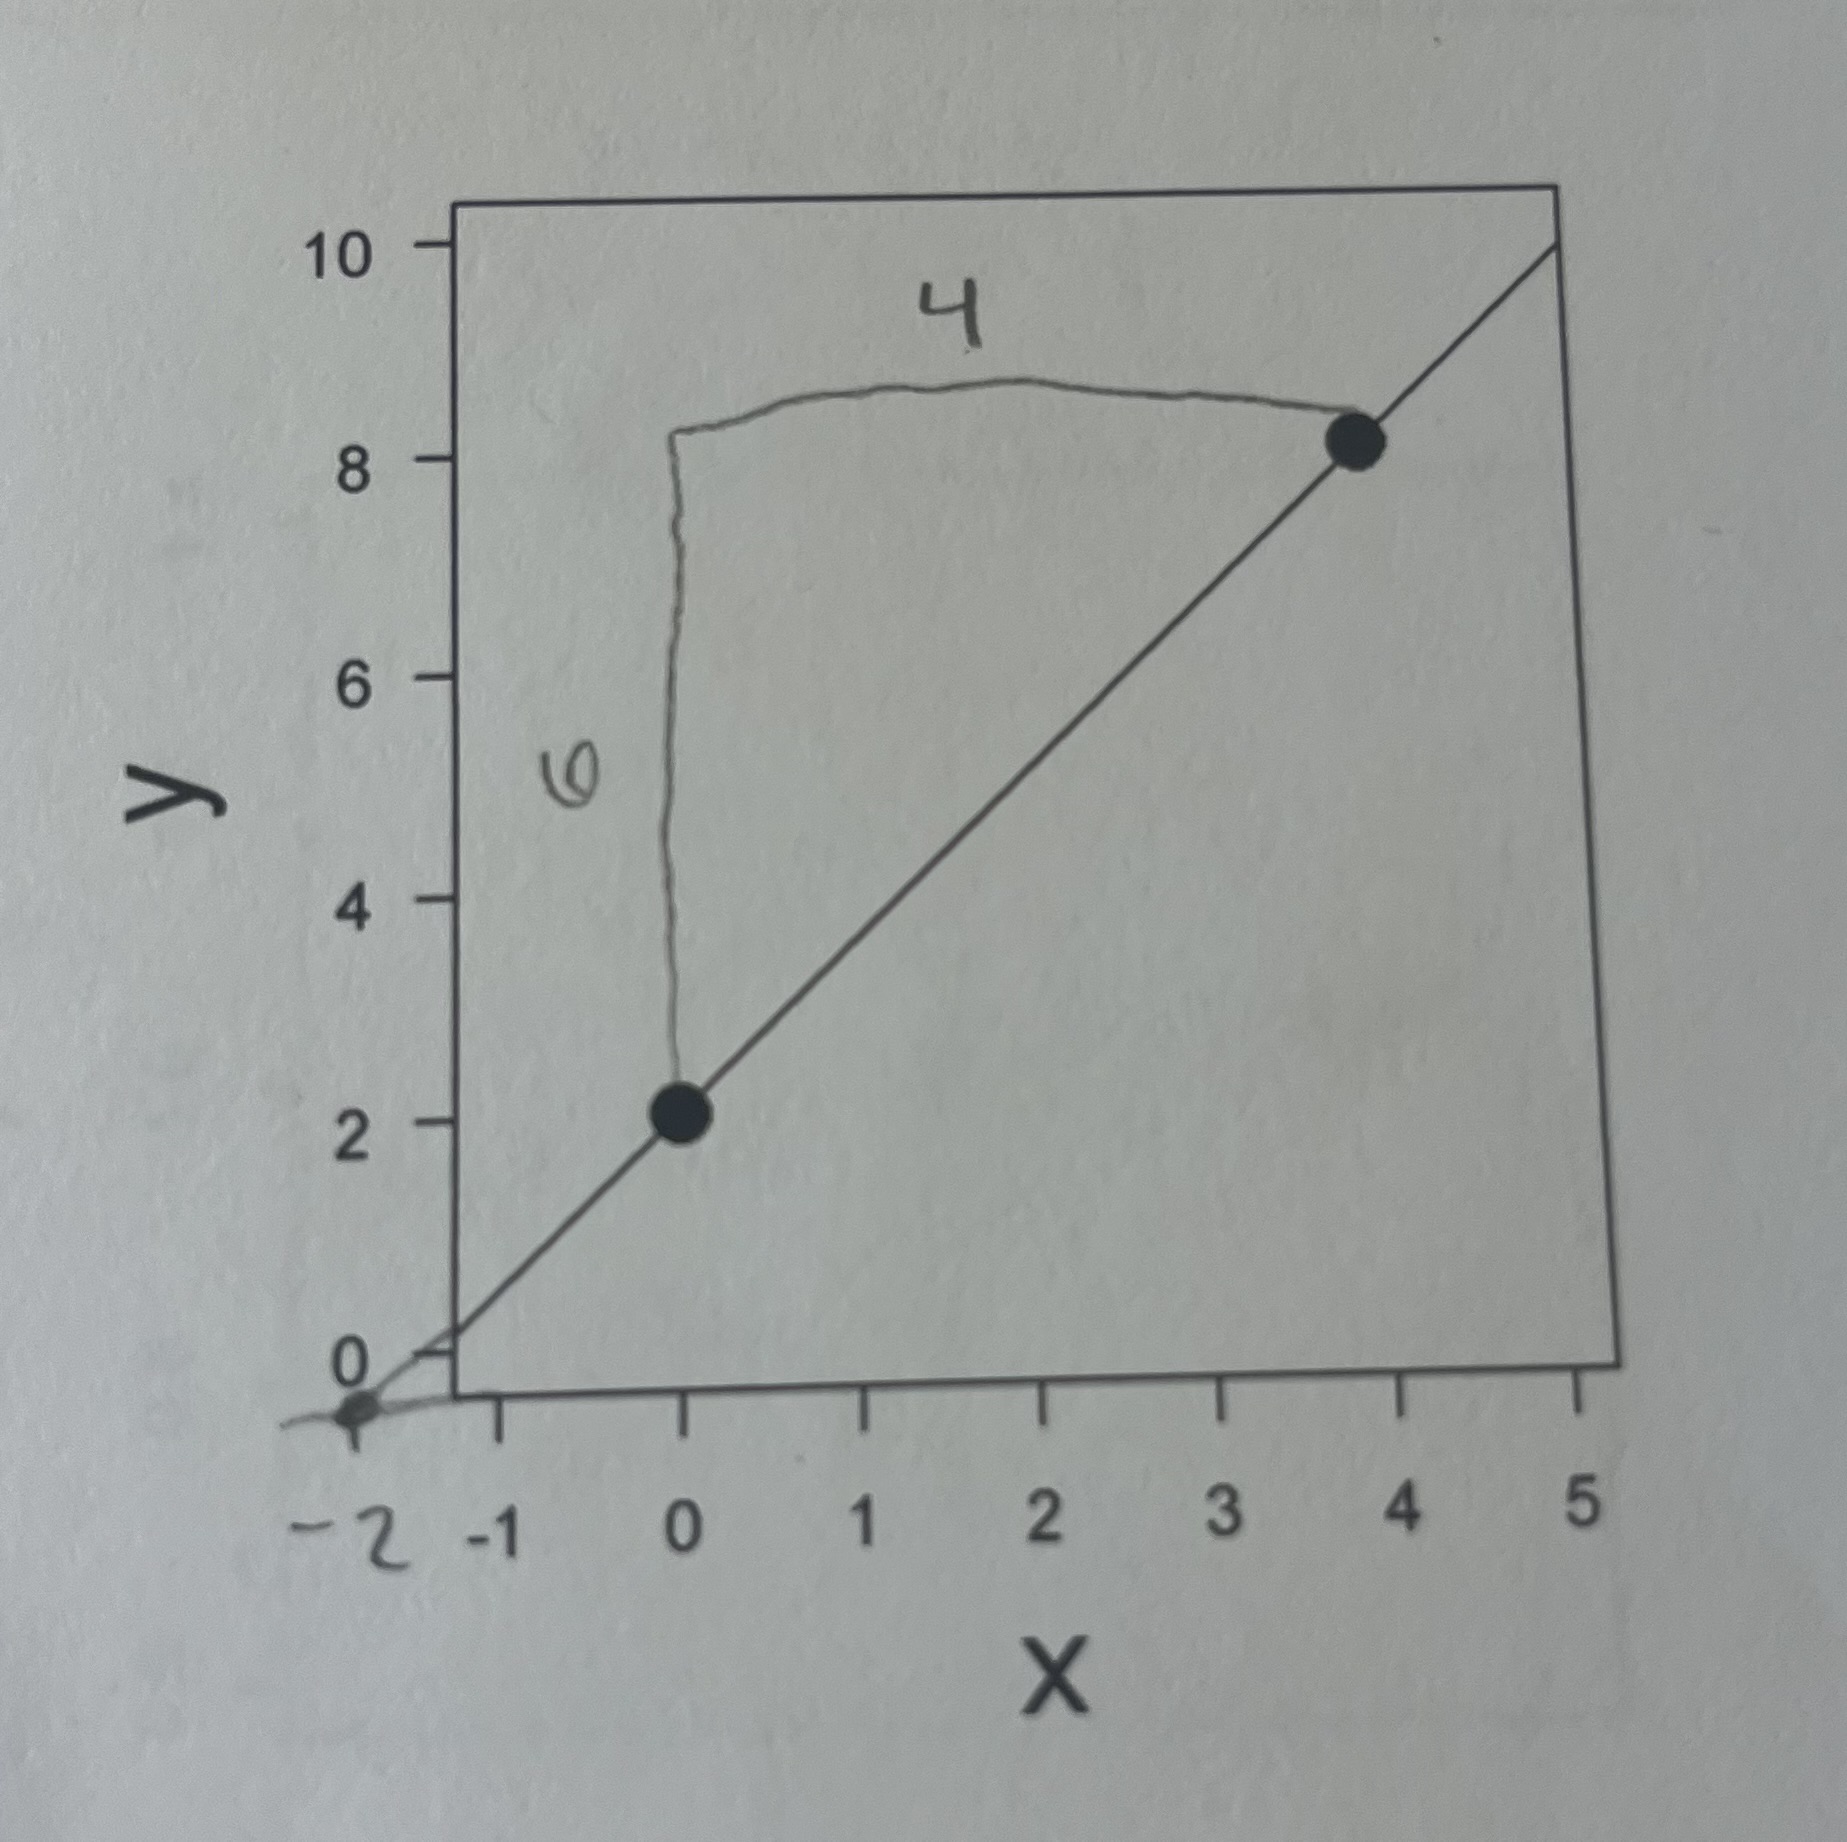
What is the slope and intercept of this line?
slope = 6/4 = 3/2 = 1.5
y-intercept = 0 (maybe a little more)
x-intercept = not shown, but likely -2
what is a representative sample?
a small, accurate sample of a larger population → acts as a mirror of the whole population’s characteristics
Describe a problem that might arise from a non-random (and non-representative) sample of a population.
bear visits at heavy vs. light traffic sights (from the hw)
If this sample had only been taken from heavy traffic areas, it would not have been an accurate representation of the whole population because there are more bears in lighter traffic areas.
non-random samples do not include the whole picture or the many variables at hand, making them vague and inaccurate
how do you know if a beta parameter (slope) with 95% confidence intervals is significant?
if 0 is in the interval → not significant (ex: -0.2 to 0.4)
if 0 is NOT in the interval → significant (ex: 0.1 to 0.8)
how do you know if a beta parameter (slope) with 95% confidence intervals is a positive or negative effect?
entire confidence interval is above 0 (e.g., 0.2 to 0.5) → positive effect
entire confidence interval is below 0 (e.g., -0.5 to -0.2) → negative effect
if interval includes both positives and negatives → not significant
Here is an estimate of a beta parameter (i.e., a slope) with 95% confidence intervals. Is this a “significant” (p < 0.05) effect? Is the effect positive or negative?
This is a significant effect because zero is not included in the interval (0.7 to 1.3).
This is a positive effect because the entire confidence interval is above zero (0.7 to 1.3).
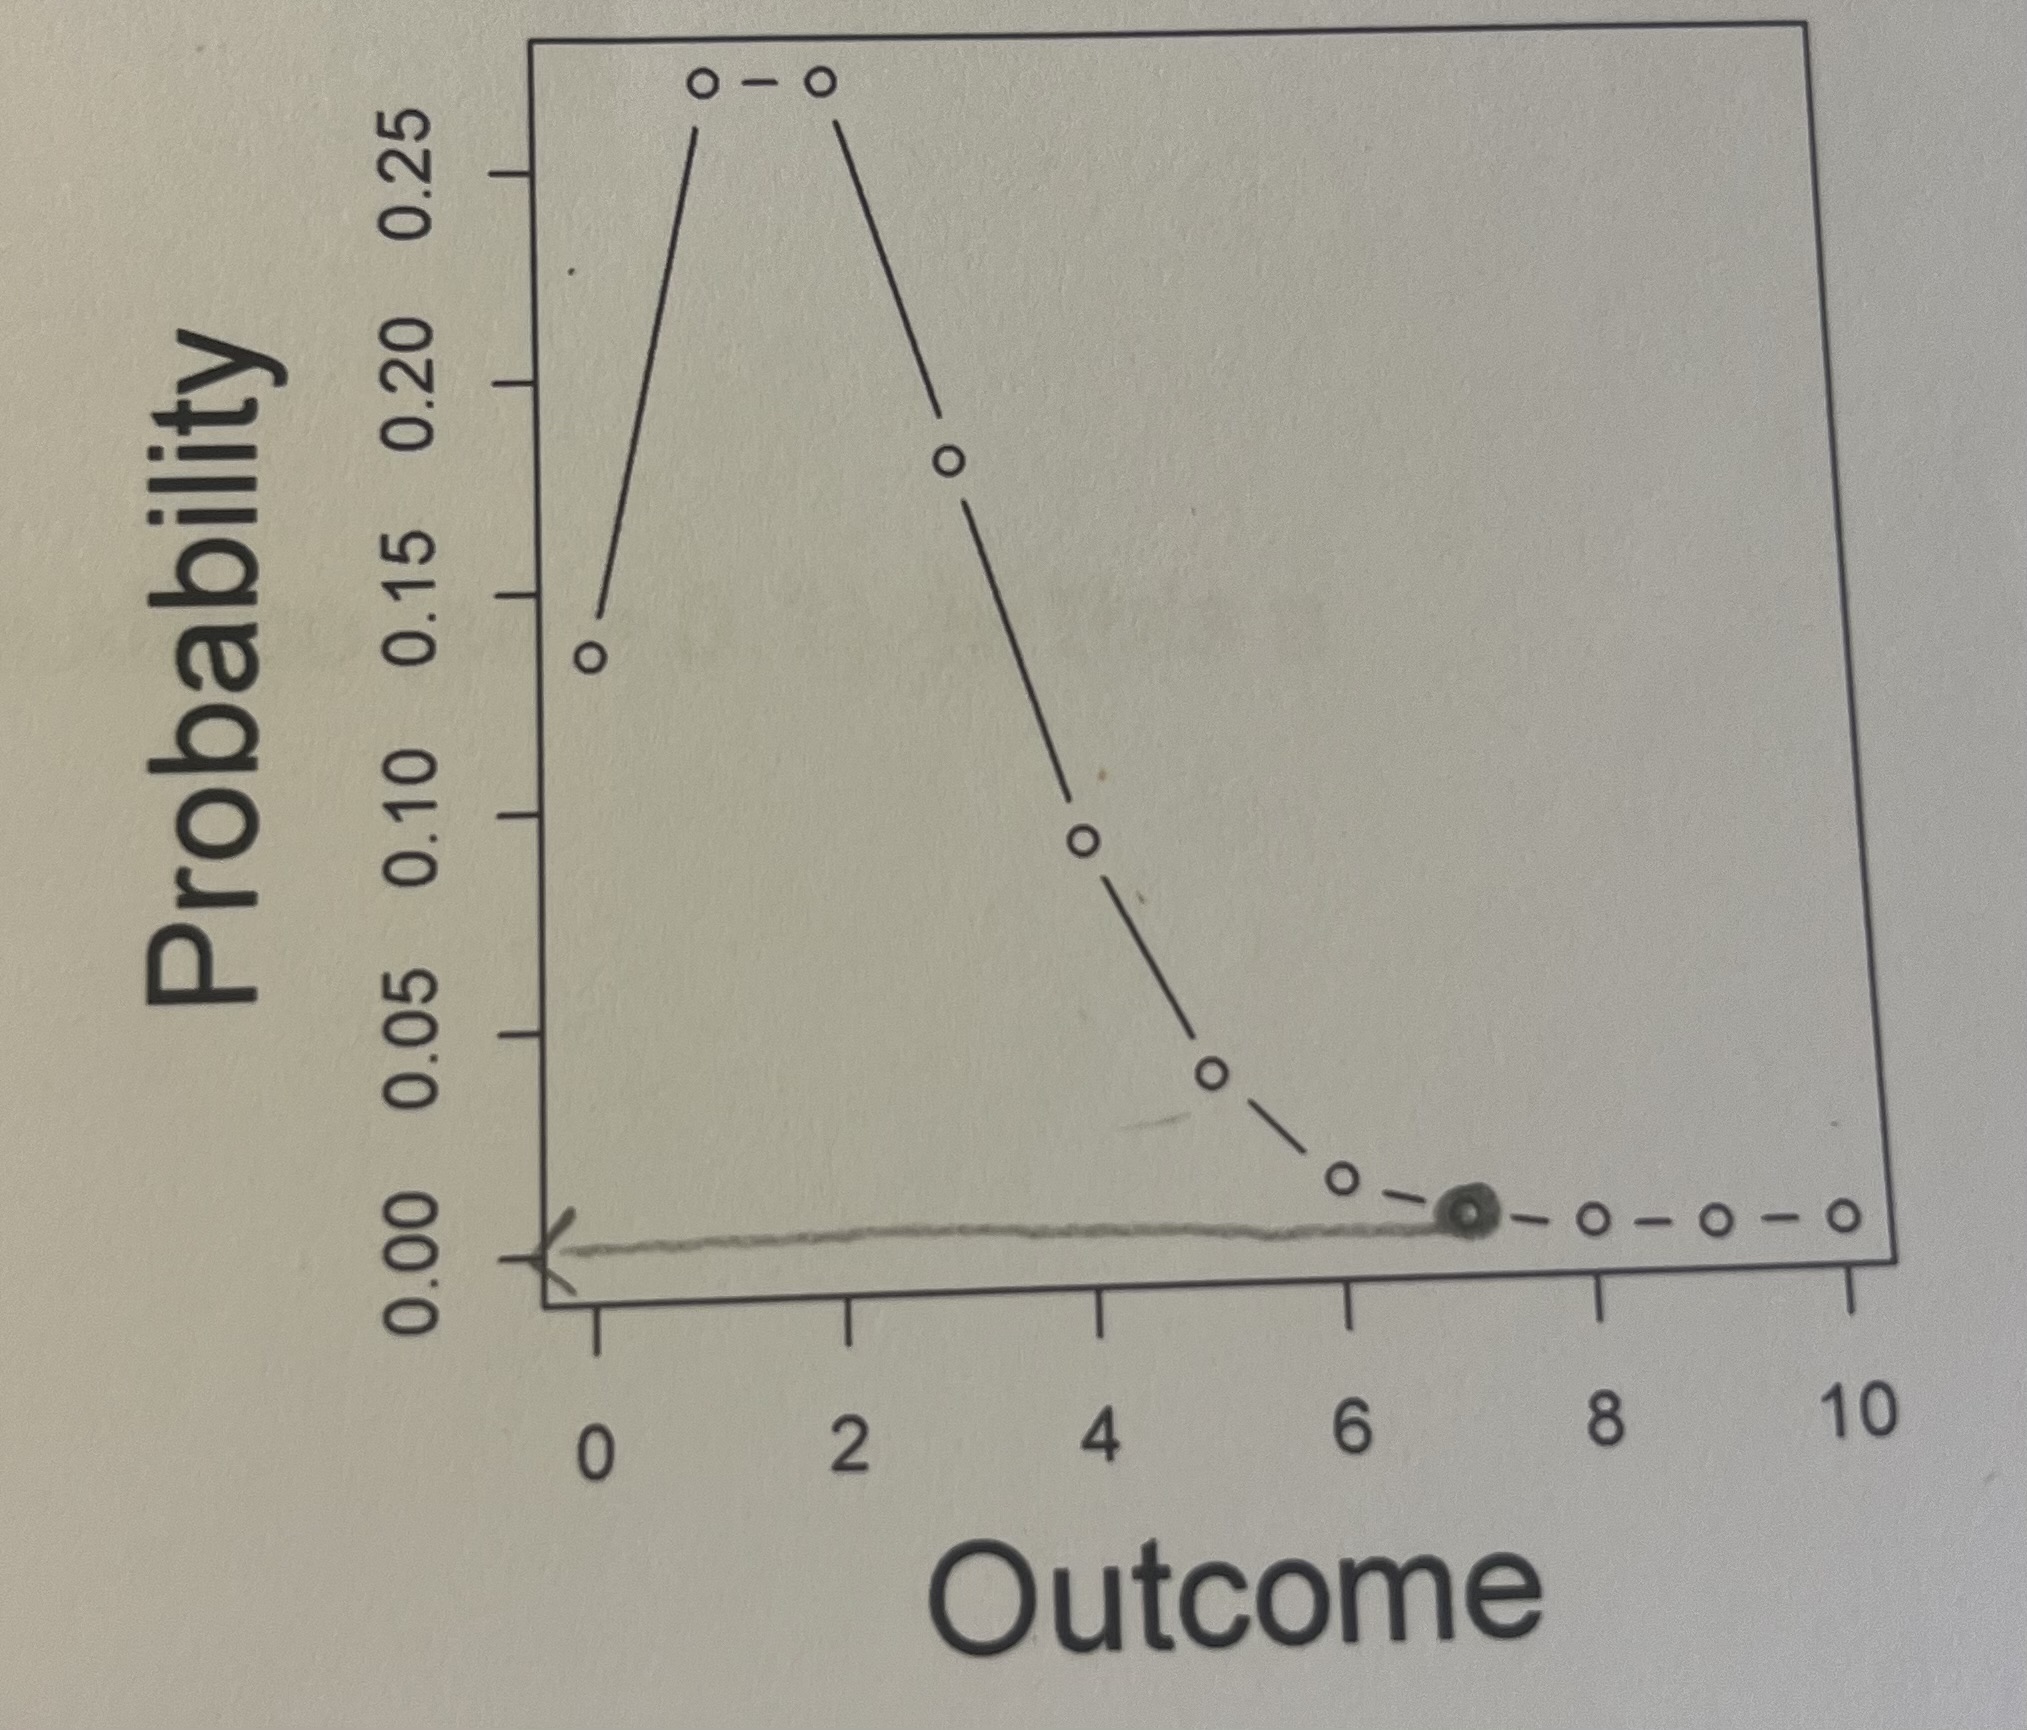
Here is a probability mass function for the Poisson distribution with a rate of 2. What is the probability (roughly) of obtaining a 7 given a single draw from this distribution?
The probability is extremely low, and is about a 0% of obtaining a 7. The most likely result is drawing a 2.

Imagine that the number of bears recorded at a camera site (y) arises from a Poisson distribution with a known rate of 2 (i.e., y ~ Poisson(2)). Do you think it is likely that 8 bears will be photographed at this site? Why or why not?
It’s not likely that 8 bears will be photographed because that is a significantly larger amount than 2. According to the graph with a rate of 2, the probability of obtaining an outcome of 8 is about 0%.
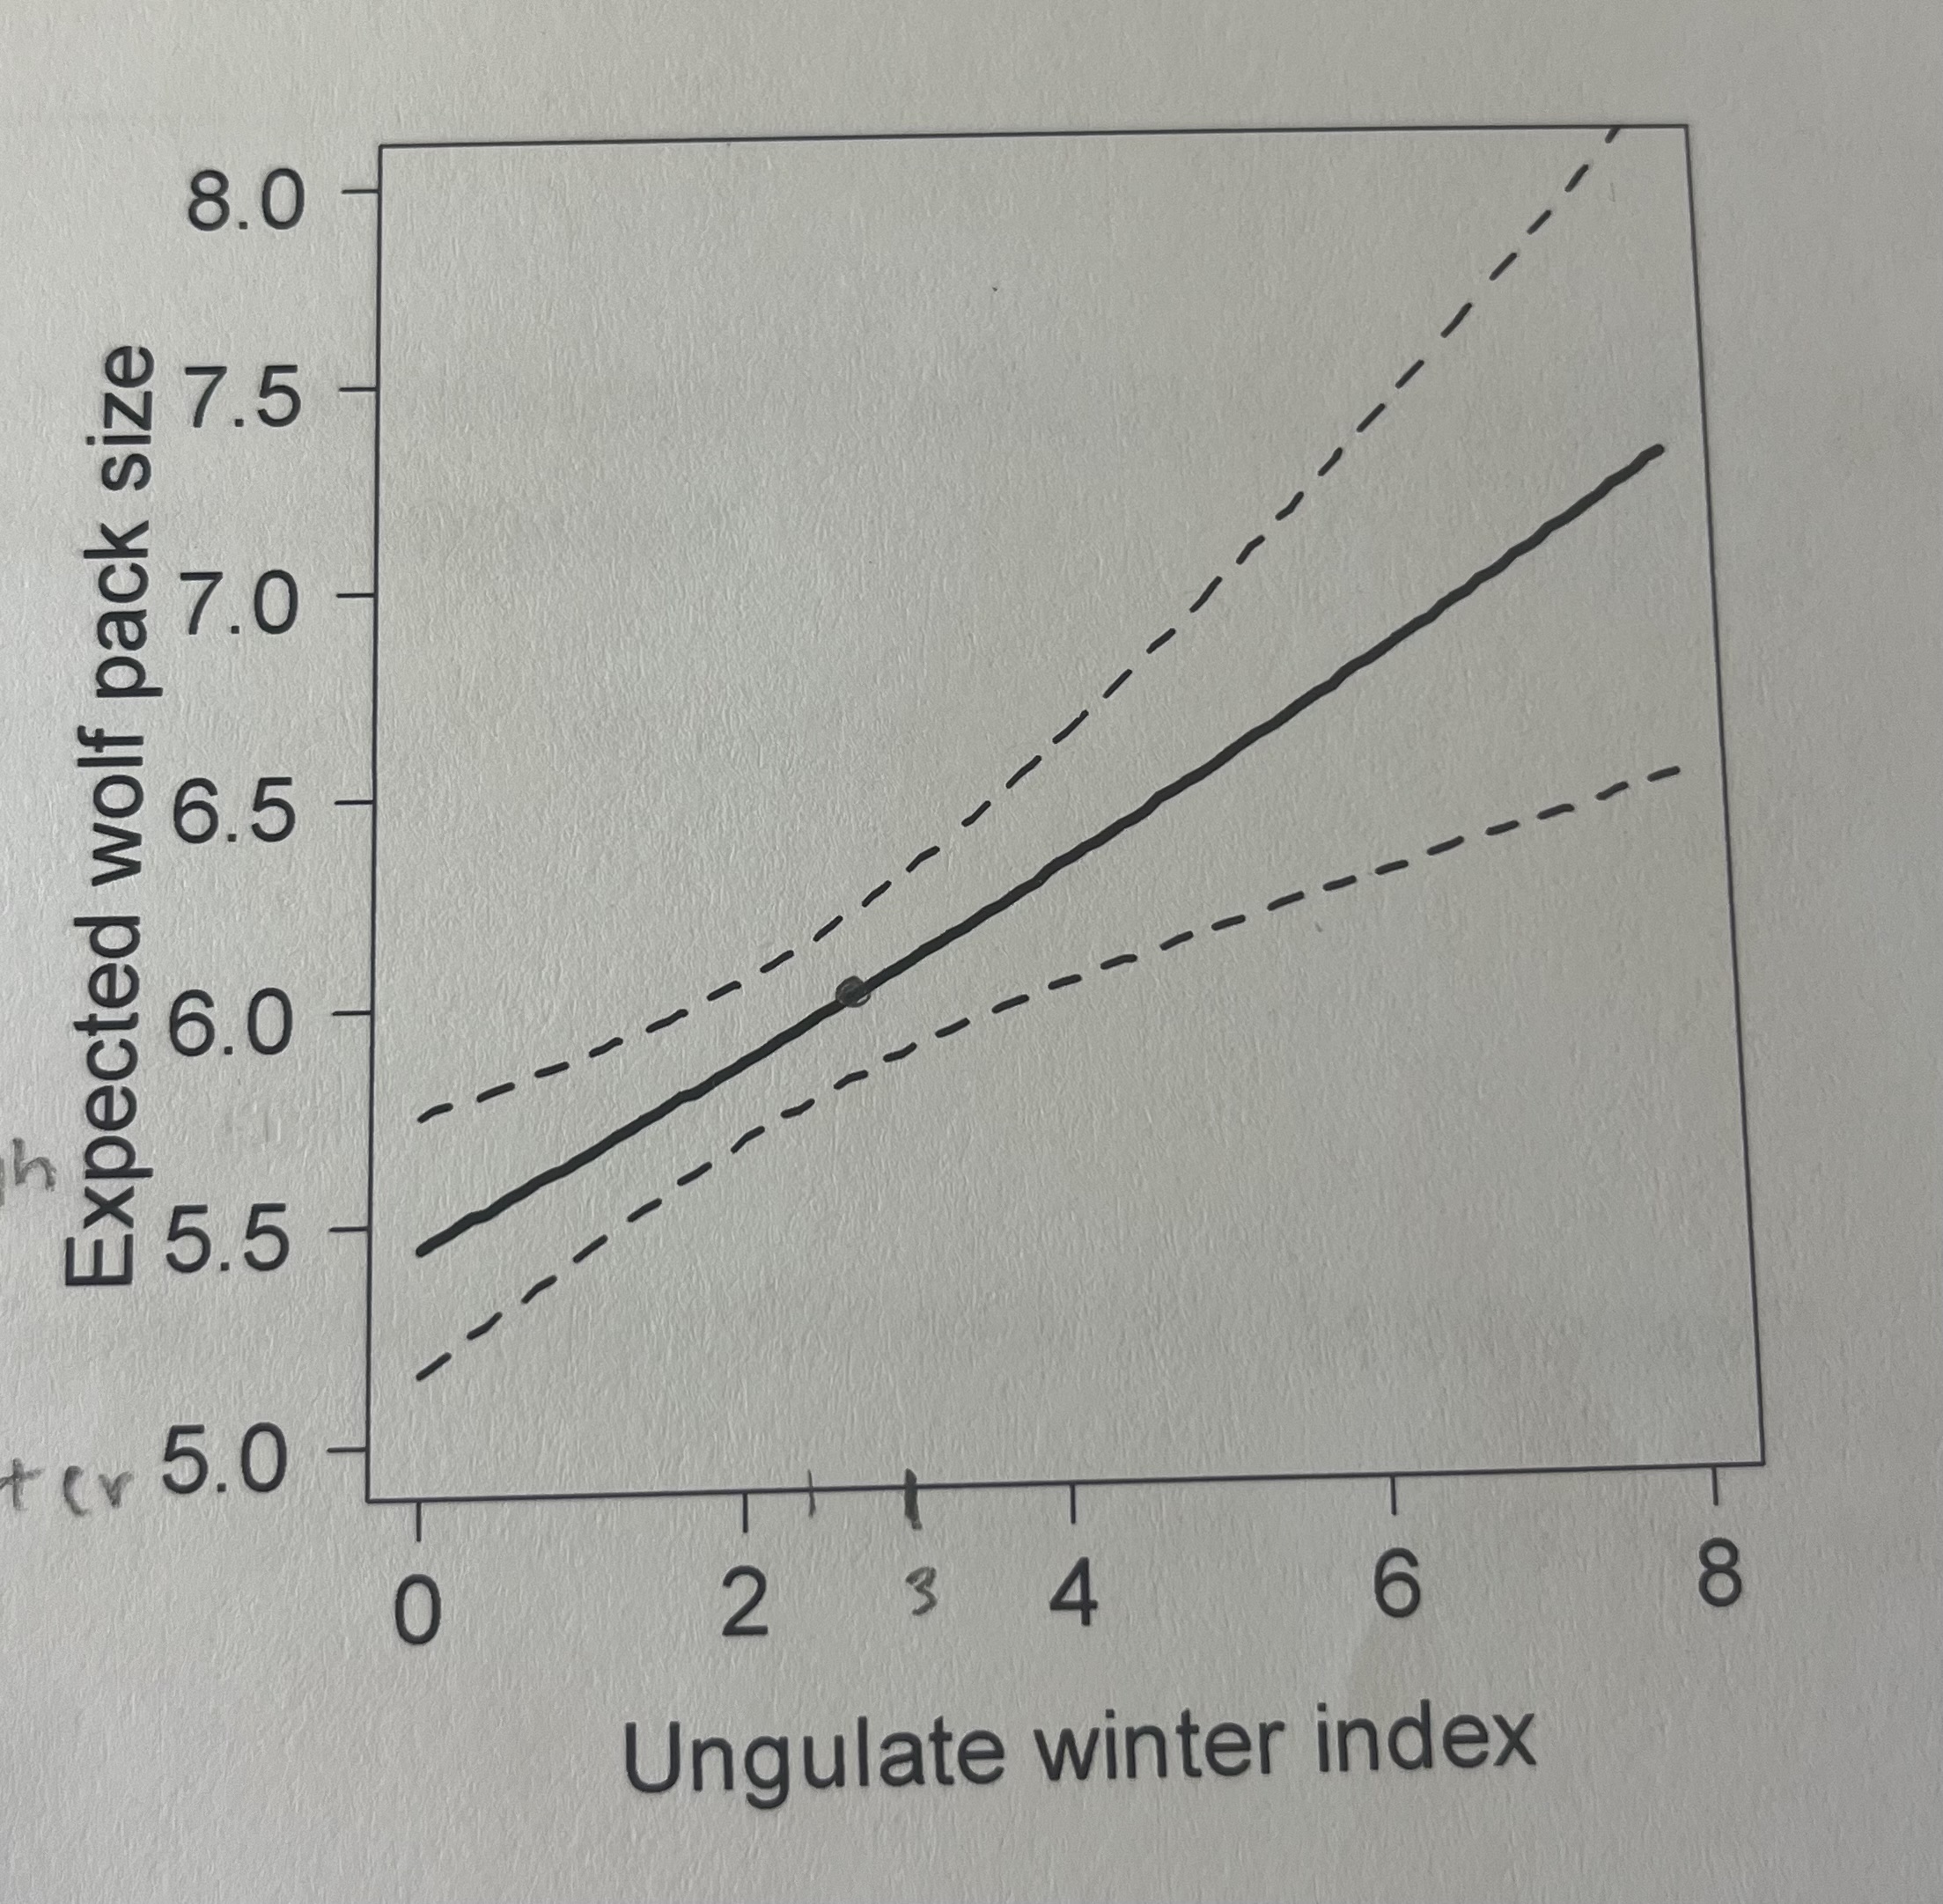
Here is an estimate of the relationship between pack size and ungulate winter density with 95% confidence intervals. Is this a “significant” (p < 0.05) effect? What value of ungulate winter index would be required for pack size to equal 6?
This is a significant effect because you cannot draw a flat line through the confidence intervals.
For pack size to equal 6, the ungulate winter index would have to be ~2.5.
You estimate a slope of 1 and uncertainty around the slope (se = 0.1). Is this a significant effect? Why or why not?
LCI = 1 - 2(0.1) = 0.8
UCI = 1 + 2(0.1) = 1.2
Yes, this is a significant positive effect because the 95% confidence interval (0.8 to 1.2) does not include 0.
You estimate a slope of 0.3 and uncertainty around the slope (se = 0.1). What are the approximate 95% confidence intervals for the estimate of the slope?
LCI = 0.3 - 2(0.1) = 0.1
UCI = 0.3 + 2(0.1) = 0.5
You estimate a slope of 0.3 and uncertainty around the slope (se = 0.1). Is this a significant effect? Why or why not?
This is a significant effect because the interval (0.1 to 0.5) does not include zero.
You estimate a slope of 0.3 and uncertainty around the slope (se = 0.1). Is the effect positive or negative? Why or why not?
This is a positive effect because the entire interval (0.1 to 0.5) is above zero.
how do you tell which log-likelihood model is better?
higher (less negative) log-likelihood = better model
ex: -2 will be a better model than -10
Imagine that you run two models, each using a different covariate to explain the same response variable. The log-likelihood of Model 1 is -811. The log-likelihood of Model 2 is -814. Which model is more likely? Why?
Model 1 is more likely because it has a higher (less negative) log-likelihood value (-811 vs -814), indicating a better fit to the data.
You estimate a slope of -0.2 with a standard error of 0.15. What are the approximate 95% confidence intervals for the estimate of the slope? Is it positive or negative? Is it significant? Why?
LCI = -0.2 - 2(0.15) = -0.5
UCI = -0.2 + 2(0.15) = 0.1
This is not significant because the interval (-0.5 to 0.1) includes zero.
This is a negative effect due to the negative slope.
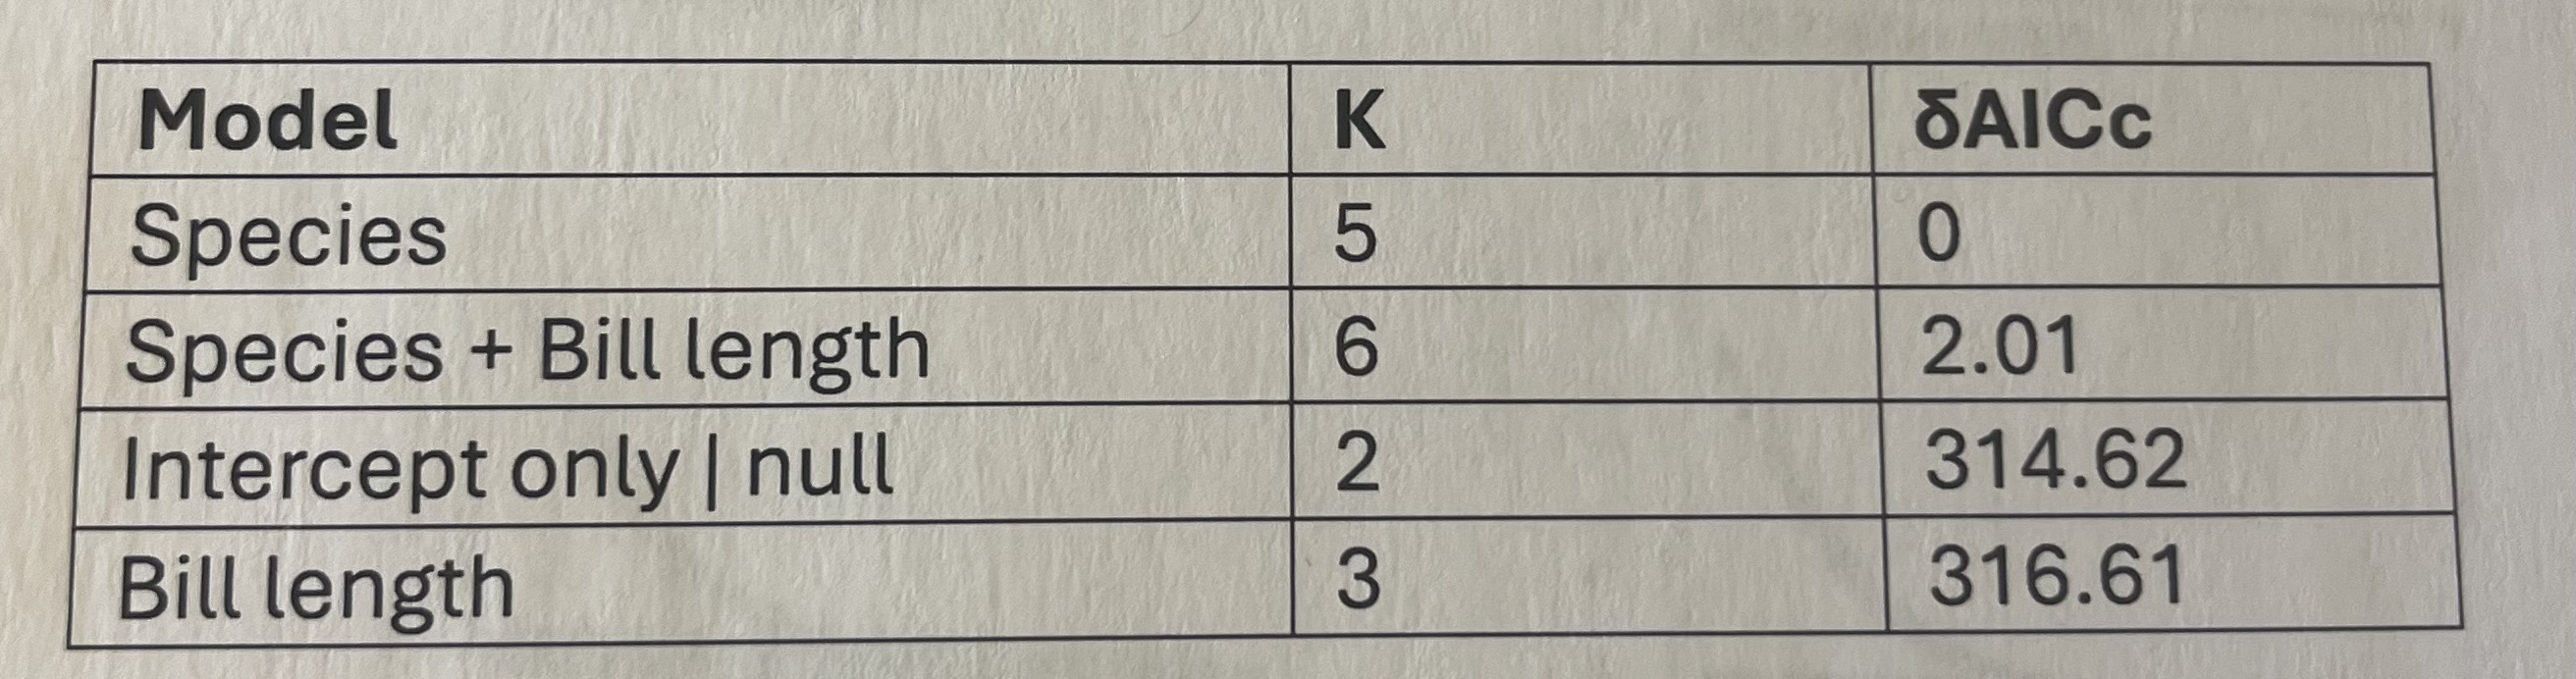
Here is an AICc table containing δAICc values for a set of models using bill length and species to explain variation in bird body mass.
Model selection results for models estimating mass as a function of species, bill length, both covariates, and no covariates (i.e, intercept only) for five species of birds captured near Missoula, MT, 2024-2026.
What is the best model?
The best model is the species-only model because it has the lowest AICc (δAICc = 0), indicating the best fit among the candidate models.

Here is an AICc table containing δAICc values for a set of models using bill length and species to explain variation in bird body mass.
Model selection results for models estimating mass as a function of species, bill length, both covariates, and no covariates (i.e, intercept only) for five species of birds captured near Missoula, MT, 2024-2026.
Are the two covariates (bill length and species) “significant”? Why?
Species is definitely significant because it is the top model with the lowest AICc.
Bill length does not show strong evidence of a significant effect because every time it’s added to a model, the AICc worsens by 2 points.
The model with Bill Length alone performs very poorly as well, which can indicate that this covariate is not contributing much to the model.

Here is an AICc table containing δAICc values for a set of models using bill length and species to explain variation in bird body mass.
Model selection results for models estimating mass as a function of species, bill length, both covariates, and no covariates (i.e, intercept only) for five species of birds captured near Missoula, MT, 2024-2026.
Can you tell whether they have a positive or negative effect? If so, how did you tell?
No, we can’t tell from this table.
AICc only tells us which model fits best, not the positive/negative effects.
In order to figure this out, we would need the intercept, which we could find through summary(lm).
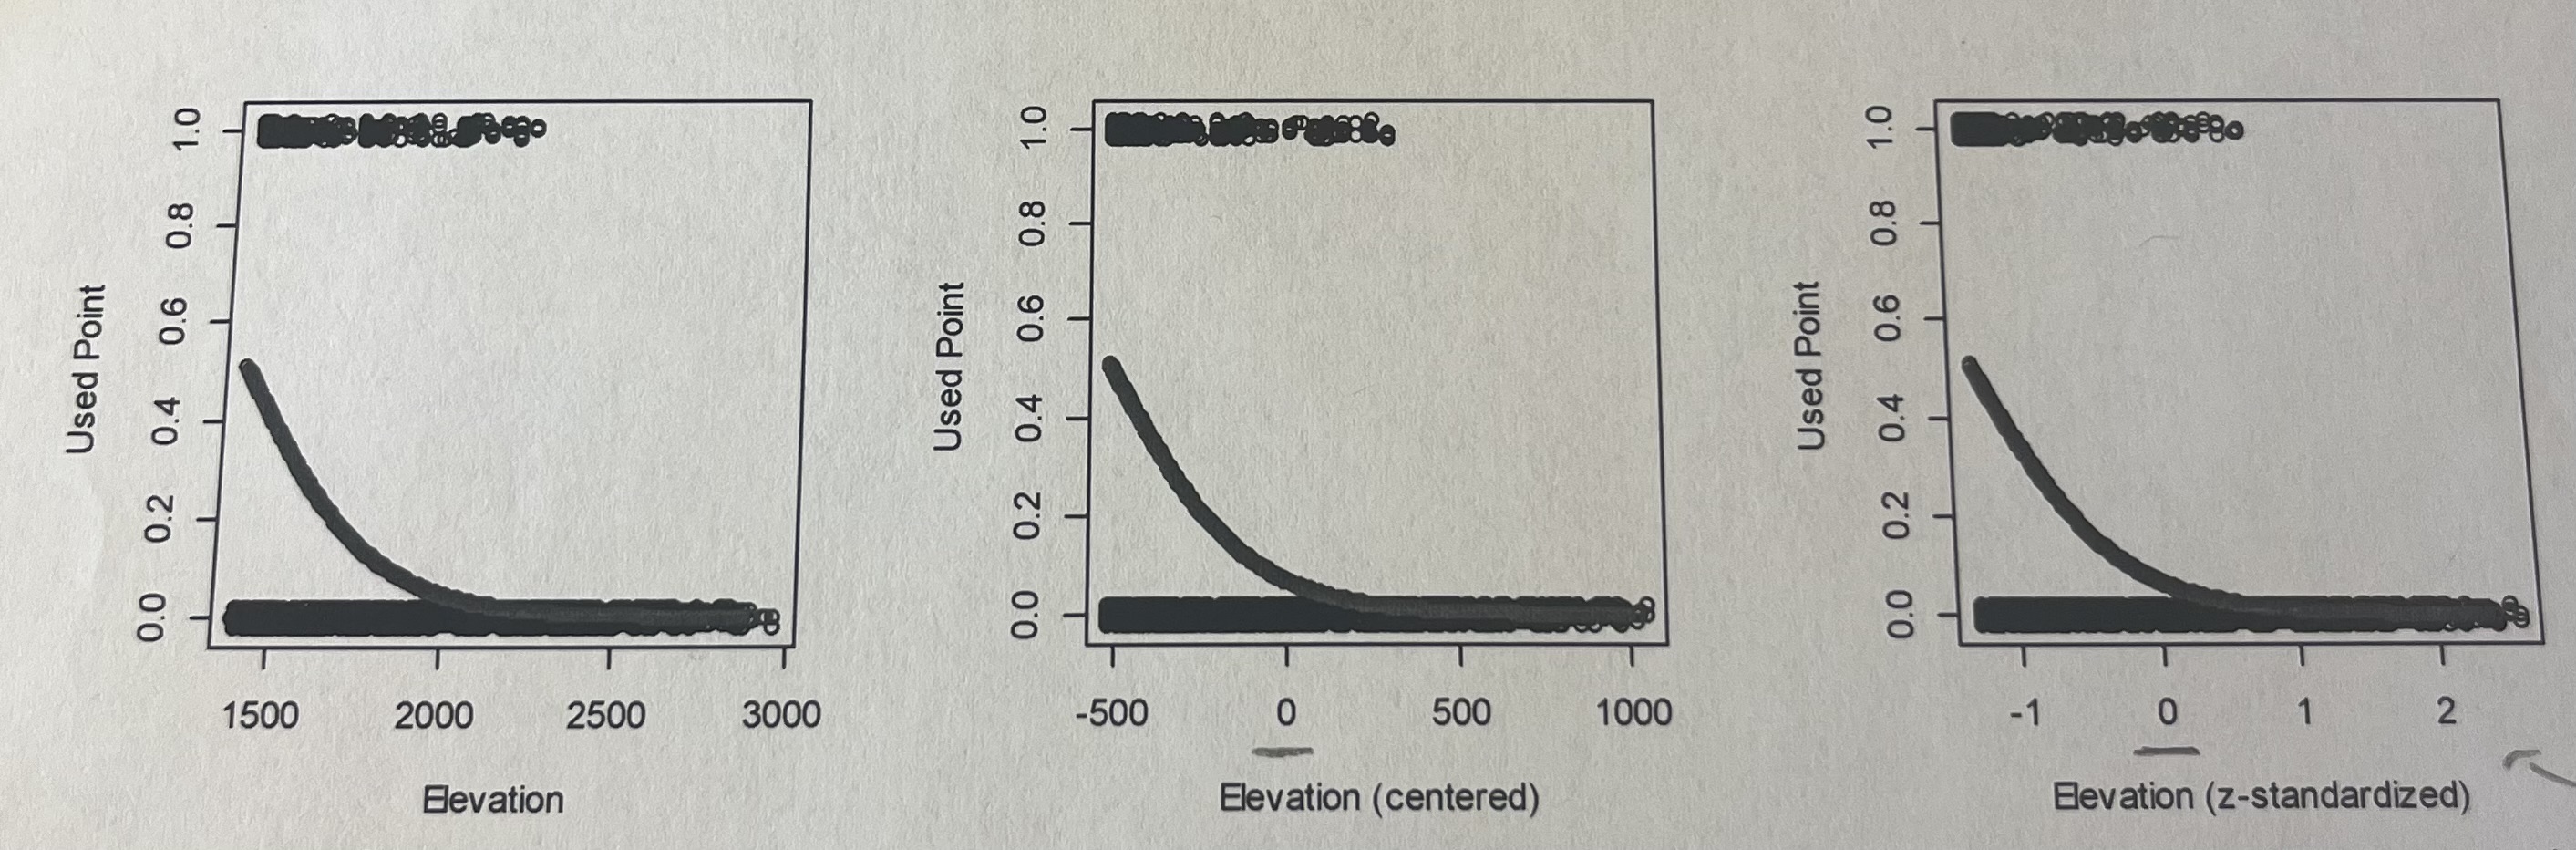
Here is a figure showing predictions from three models examining the probability that a point is a used point (from a wolf radio collar, not a random point) as a function of elevation (in meters), centered elevation (in meters), and z-standardized elevation (in standard deviations).
1) The intercepts for these three models are 7.23 (elevation), -2.64 (centered elevation), and -2.64 (z-standardized). Why are the intercepts for the centered and z-standardized covariates the same?
Both centered and z-standardized variables are shifted so that the mean = 0
In both models, the intercept represents the predicted value at the mean elevation, resulting in the same intercept estimate.

Here is a figure showing predictions from three models examining the probability that a point is a used point (from a wolf radio collar, not a random point) as a function of elevation (in meters), centered elevation (in meters), and z-standardized elevation (in standard deviations).
2) The slopes for these three models are -0.005 (elevation), -0.005 (centered), and 2.079 (z-standardized). Why are the slopes for the elevation and centered covariates the same?
Centering only shifts the data — it does NOT stretch or compress it
The relationship (slope) stays identical
Only the intercept changes

Here is a figure showing predictions from three models examining the probability that a point is a used point (from a wolf radio collar, not a random point) as a function of elevation (in meters), centered elevation (in meters), and z-standardized elevation (in standard deviations).
3) Each model has the same log-likelihood and AICc. Why?
They are all technically using the same data, predictions, and parameters. The only thing that is changing is the scale.
what are the different kinds of hypotheses?
null [Ho] and alternate [Ha]
when do we reject the null?
when the p-value is less than 0.05
what is the equation for degrees of freedom?
df = n1 + n2 - 3
what does Ho represent in a two-tailed test?
there is no difference in mean
what does Ha represent in a two-tailed test?
there is a difference between means
what does Ho represent in a one-tailed test?
the mean of Group 1 is not greater than the mean of Group 2
what does Ha represent in a one-tailed test?
the mean of Group 1 is greater than the mean of Group 2
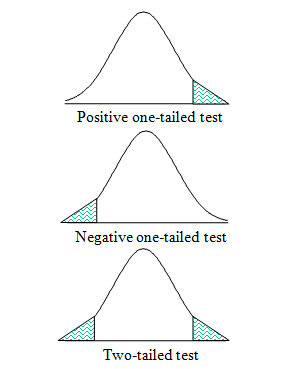
what is the difference between one-tailed and two-tailed tests?
Use a one-tailed test when you only care if a result is higher or lower, but not both.
Use a two-tailed test when you need to detect any significant effect regardless of direction.
what is a for-loop designed for?
to do something over and over again
why is there lots of grey area in creating groups?
hard to differentiate, can be based on opinions
ex: urban, suburban, semi-rural, rural
what does the likelihood function do?
tells us what the most likely line through a plot is
what does more variance correlate with?
more uncertainty
ex: if variance = 0.1, then the data will be organized
if variance = 1, the data will not be organized
what does y or x represent?
data (something we have already measured)
what do Greek letters represent?
parameters (something we need to estimate with uncertainty)
what is the dependent variable called?
the response (y)
what is the independent variable called?
covariate (x)
how does sample size effect uncertainty?
certainty increases when sample size increases
what is a binomial?
has 2 outcomes (like flipping a coin)
what is a multinomial?
has multiple outcomes (like rolling a die)
what do link functions do?
they allow us to constrain parameters (boundaries) so we don’t predict things like 150% survival rate
ln(N)
x
ln(1)
0
ln(e)
1
N
ex
e0
1
what are 95% confidence intervals?
a range of values calculated from sample data that is likely to contain the true population parameter 95% of the time if the study were repeated
what does the standard error measure?
how accurately a sample mean represents the true population mean, indicating how much the average would vary if you repeated a study with new samples
what does the null hypothesis state?
there is no difference between groups
what does the alternate hypothesis state?
there is a difference between groups
why is representative sampling important?
data will not be accurate if it only represents one aspect of the hypothesis/population
what would a linear graph look like if the null hypothesis was true?
a straight line with no slope