EBP - Summarising Data and RCTs
0.0(0)
Studied by 1 person Call Kai
 Learn
Learn Practice Test
 Spaced Repetition
 Match
Match Flashcards
 Knowt Play
Card Sorting
1/64

Earn XP
Description and Tags
Last updated 7:07 PM on 12/28/22
Name | Mastery | Learn | Test | Matching | Spaced | Call with Kai | Chat |
|---|
No analytics yet
Send a link to your students to track their progress
65 Terms
1
New cards
variable
characteristics for which information is recoded
2
New cards
categorical variable
have non-numerical values, with each value associated with a category
3
New cards
Ordinal/ Ordered Categorical
can assign numbers to categories / ranked
4
New cards
Nominal/ Unordered Categorical
can not assign numbers to categories
5
New cards
Binary/ Dichotomous
two categories only
6
New cards
numerical variables
have numerical/ measured values
7
New cards
continuous
can potentially take an infinite number of distinct values
8
New cards
Discrete/ Count
can only take integer values
9
New cards
can numerical variables be converted into categorical?
yes for simpler summary of information
ordinal or binary
never nominal
ordinal or binary
never nominal
10
New cards
can categorical variables be converted into numerical?
no
11
New cards
ALSPAC
avon longitudinal study of parents and children
due date april 1991- december 1992
due date april 1991- december 1992
12
New cards
graph for single categorical/discrete variable
bar chart
pie chart
making variable ordinal improves graph
pie chart
making variable ordinal improves graph
13
New cards
graph for single continuous variable
histogram
has group intervals
if converted to ordinal it can be done as bar/pie chart
has group intervals
if converted to ordinal it can be done as bar/pie chart
14
New cards
graph for continuous outcome X categorical/discrete exposure
box and whisker plot
compare distributions
compare distributions
15
New cards
graph for a pair of continuous variables
scatter plot
16
New cards
graph for a pair of categorical/discrete variables
no graph
presented in table
presented in table
17
New cards
prevalence
proportion with the outcome at a particular point in time
18
New cards
incidence
proportion of new cases with the outcome that occurred in a specific time period
new diagnosis and immigration of ill people
new diagnosis and immigration of ill people
19
New cards
what does prevalence and incidence not include
cure
death
emigration
death
emigration
20
New cards
normal distribution
symmetric distribution described by mean and SD
gaussian
gaussian
21
New cards
skewed data
positively skewed (long tail to right)
negatively skewed (long tail to left)
negatively skewed (long tail to left)
22
New cards
measures of location
mean median mode
also known as measures of central tendency
also known as measures of central tendency
23
New cards
when is the mean suitable?
continuous
normal distrubution
normal distrubution
24
New cards
when is the median suitable?
continuous normally distributed
continuous non-normally distributed
discrete variables, with extremes/ outliers
continuous non-normally distributed
discrete variables, with extremes/ outliers
25
New cards
when does the mode not exist?
if data has been measured precisely so each value can be distinguished
26
New cards
measures of variability
standard deviation, interquartile range
also known as measures of spread
also known as measures of spread
27
New cards
standard deviation
measure of spread of observations around the mean
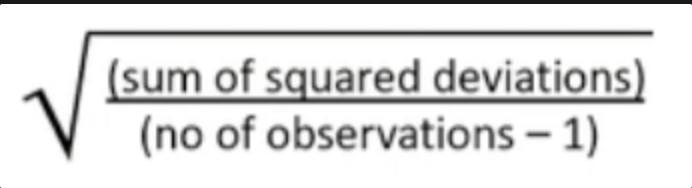
28
New cards
varience
SD^2
29
New cards
when is SD suitable?
continuous approximately normally distributed variables
30
New cards
when is IQR suitable?
continuous non-normally distributed or discrete variables
31
New cards
why is the range not that useful?
relies on two extreme values - unrepresentative
32
New cards
95% reference range
= mean +/- 1.96\*SD
likely values for an individual in population / ‘clinical normality’
likely values for an individual in population / ‘clinical normality’
33
New cards
limitations of clinical experience
patients may get better anyway
placebo effect
no controls
follow-up is a haphazard
small numbers of patients
placebo effect
no controls
follow-up is a haphazard
small numbers of patients
34
New cards
placebo
phenomenon where patients symptoms can be alleviated by an otherwise ineffective treatment, as they expect the treatment will work
35
New cards
overcoming limitations of clinical experience
randomly allocate patients to a an active treatment group or control group
randomised control trial
randomised control trial
36
New cards
random allocation
every patients has the same chance of ending up in either group
37
New cards
why are RCTs at the top of the hierarchy of evidence?
best evidence of associations
confounding eliminated
temporal sequence known so no reverse causality
bias minimised
confounding eliminated
temporal sequence known so no reverse causality
bias minimised
38
New cards
in an RCT what is the control group?
placebo or the current standard treatment
39
New cards
in an RCT what is the exposure
whether or not they receive treatment
40
New cards
PICO model for clinical questions
patient/problem/population
intervention
comparison/control/comparator
outcome
intervention
comparison/control/comparator
outcome
41
New cards
3 steps of an RCT
planning
conducting
analysing
conducting
analysing
42
New cards
planning an RCT
establish H
define EC I C BC
calculate SS PC
specify O
establish H
define EC I C BC
calculate SS PC
specify O
establish a hypothesis
define eligibility criteria
define intervention
define control
define baseline characteristics of interest
calculate sample size/power calculation
specify outcome measures
define eligibility criteria
define intervention
define control
define baseline characteristics of interest
calculate sample size/power calculation
specify outcome measures
43
New cards
why should the eligibility criteria not be too restrictive?
results of the study will only be generalisable to a limited range of patients in clinical practice
44
New cards
how to check successful random allocation?
done by comparing baseline characteristics/confounding factors across treatment groups
similarities between the groups suggests successful randomisation
similarities between the groups suggests successful randomisation
45
New cards
why do we need to do a power calculation?
what is power?
what is power?
need to calculate a sample size that is large enough to detect a difference between intervention and control group if it genuinely exists but not waste time and resources
probability of detecting a difference
probability of detecting a difference
46
New cards
why and how do we need to specify the outcome measures?
judge efficacy of the treatments must be specified
definition of, how and when outcome is measured
definition of, how and when outcome is measured
47
New cards
conducting an RCT
obtain EA
seek IC
screen for E
generate RAS
ensure COR
specify B
obtain EA
seek IC
screen for E
generate RAS
ensure COR
specify B
obtain ethical approval
seek informed consent
screen for eligibility
generate random allocation sequence
ensure concealment of randomisation
specify blinding
seek informed consent
screen for eligibility
generate random allocation sequence
ensure concealment of randomisation
specify blinding
48
New cards
where to obtain ethical approval?
local or regional research ethics committees
49
New cards
ethics committees can refuse X and request Y
permission
amendments
amendments
50
New cards
clinical equipoise
uncertainty that the treatment is better than control
51
New cards
selection bias
bias due to systematic difference in the characteristics of participants selected to take part in a study and those who are not
lack of concealment of randomisation leads to this
lack of concealment of randomisation leads to this
52
New cards
blinding
single vs double
single vs double
unawareness of treatment allocation
participant and/or outcome assessor is unaware
participant and/or outcome assessor is unaware
53
New cards
performance bias
behaving differently due to awareness of treatment
eg placebo
overcome by blinding
eg placebo
overcome by blinding
54
New cards
recall bias
behaving differently due to awareness of treatment when self-reporting
55
New cards
detection bias
change in measurement of outcome due to awareness of treatment
overcome by blinding
overcome by blinding
56
New cards
interviewer bias
change in behaviour when conducting an interview to measure outcomes due to awareness of treatment
57
New cards
analysing an RCT
check randomisation successful
check loss to follow up
main comparison analysis
check loss to follow up
main comparison analysis
58
New cards
loss to follow up bias
difference in proportion of drop out between treatment and control group
eg if those with side effects or bad outcome withdraw treatment effect if overestimated
eg if those with side effects or bad outcome withdraw treatment effect if overestimated
59
New cards
intention to treat
participants are kept in their allocated groups for analysis even if they swapped groups, ideally they are also included in analysis even if they drop out
60
New cards
per protocol
only those who adhere to treatment and do not drop out are included
61
New cards
why is ITT preferable?
minimises confounding
maintains sample size
represents clinical practice
maintains sample size
represents clinical practice
62
New cards
why does ITT minimise confounding?
maintains comparability of groups in terms of baseline characteristics
63
New cards
strengths of RCTs
no reverse causality
minimised confounding (confounders evenly distributed)
selection/performance bias minimised
measurement bias minimised
minimised confounding (confounders evenly distributed)
selection/performance bias minimised
measurement bias minimised
64
New cards
weaknesses of RCTs
loss to follow up bias
large sample sizes/long follow up times can be ==expensive and time consuming==
efficacy of treatment under trial conditions may be different from effectiveness in normal practise
not suitable for all exposures eg unethical
large sample sizes/long follow up times can be ==expensive and time consuming==
efficacy of treatment under trial conditions may be different from effectiveness in normal practise
not suitable for all exposures eg unethical
65
New cards
efficacy
does the treatment work under ideal conditions